News | Market Wraps
Evening Wrap: ASX 200 steady despite inflation shock — rate hike odds rise as gold and energy stocks power on
The S&P/ASX 200 closed 7.7 points lower, down 0.09%.

Mentioned
The S&P/ASX 200 closed 7.7 points lower, down 0.09%.
"Shock" inflation data cements not one, but two, likely interest rate hikes from the RBA before the middle of this year. Exclamation point, exclamation point!!
That's what most mainstream ASX evening wraps are leading with today. We're not leading with it so much, just noting that for all the hype — there was very little translation through to the ASX 200.
But that doesn't mean there weren't some very big moves within the index. Indeed, there were substantial winners and losers out of today's inflation news: and that's what we'll investigate... So...
Be sure to click/scroll through for the usual reporting of the major sector and stock-specific moves, the broker responses to them, as well as all the key economic data in tonight's Evening Wrap.
Also, I have detailed technical analysis on the Nasdaq Composite and the S&P/ASX 200 in today's ChartWatch.
Let's dive in!
Today in Review
Wed 28 Jan 26, 5:46pm (AEST)
Name | Value | % Chg |
|---|---|---|
Major Indices | ||
| ASX 200 | 8,933.9 | -0.09% |
| All Ords | 9,250.6 | -0.19% |
| Small Ords | 3,984.6 | -0.08% |
| All Tech | 3,243.1 | -2.81% |
| Emerging Companies | 3,442.4 | -0.59% |
Currency | ||
| AUD/USD | 0.7 | -0.18% |
US Futures | ||
| S&P 500 | 7,039.5 | +0.44% |
| Dow Jones | 49,181.0 | +0.04% |
| Nasdaq | 26,326.25 | +0.97% |
Name | Value | % Chg |
|---|---|---|
Sector | ||
| Energy | 9,238.7 | +2.33% |
| Materials | 23,843.7 | +1.35% |
| Utilities | 9,735.7 | -0.20% |
| Industrials | 8,483.3 | -0.26% |
| Financials | 9,152.0 | -0.33% |
| Real Estate | 3,843.5 | -0.86% |
| Consumer Staples | 11,647.0 | -0.94% |
| Communication Services | 1,717.8 | -1.06% |
| Consumer Discretionary | 3,997.2 | -1.26% |
| Health Care | 34,360.5 | -1.40% |
| Information Technology | 2,035.7 | -2.79% |
Markets
%20intraday%20chart_28%20Jan.png)
ASX 200 Session Chart
The S&P/ASX 200 (XJO) finished 7.7 points lower at 8,933.9, 0.5% from its session high and 0.29% from its low. Somewhat of greater concern, i.e., not reflecting the narrow loss on the benchmark, in the broader-based S&P/ASX 300 (XKO) advancers lagged decliners by 89 to 181.
Fund flows: Makes a lot of sense when you think about it... 🤔
No doubt you’ve read about the negative reaction among analysts (and journalists reporting what those analysts had to say…) regarding today’s inflation data.
If you haven’t, then: 🔎
It isn’t good for RBA on hold or cutting rates
It is more likely going to push the RBA towards a rate hike sooner rather than later (market pricing was May, now it’s Feb, plus second hike pricing has reeled in from early-mid 2027 to mid-late this year).
Putting aside the dozens of hysterical headlines in the mainstream finance media, I (and I trust, now, YOU) prefer to look at how stock prices responded.
After all, the demand-side takes all that stuff into account.
The supply side takes all that stuff into account.
Each does their thing… and price discovery occurs. ⚖️
It’s a very pure and beautiful thing. It’s been happening since the dawn of economics. It will happen for many years to come. ♾️
So, what did ASX stock prices do today after the CPI data? Did they panic like the finance journos? 🤔
Well… looking at the intraday chart of the ASX 200, a.k.a the Old Tin Pot, above… hardly. Can I offer: we closed roughly at the same point we were when the data was released at 11:30 AEDT.
I think the saying is: “Don’t believe the hype”. 🙅
There was next-to-zero “surprise” factor in today’s data. The big money knew it was coming. Today's CPI data changed little as far as their demand-supply intentions are concerned.
However, this doesn’t mean all sectors and stocks within those sectors got away unscathed. There are certain sectors that are far more sensitive to the prospect of higher interest rates than others.
“Interest rates sensitives”
= Long duration — earnings-skew is into the future, higher market rates = higher discounting rate = more susceptible to discounting of future cashflows, also tend to have higher ratio of debt-funding as in growth phase.
= Consumer discretionary — rely on consumer spending to maintain and grow earnings — clearly going to be negatively impacted by the prospect of higher interest rates.
= Bond proxies — companies with bond-like earnings and dividend payouts. Rising interest rates lift bond yields, making bonds relatively more attractive and diminishing the valuation appeal of bond-proxy equities.
“Interest rate agnostics”
= Short duration — earnings now… less debt-to-fund-growth oriented… much lower impact of higher discount rate.
= Pricing power — usually cyclicals like commodities… the prices of which tend to rise in inflationary environments.
That’s the economic theory, anyway… so how did stuff play out on the ASX today? 🧐
“Interest rates sensitives”
Information Technology (XIJ) (-2.8%) = Long duration
Health Care (XHJ) (-1.4%) = Long duration
Consumer Discretionary (XDJ) (-1.3%) = Consumer discretionary + Long duration
Communication Services (XTJ) (-1.1%) = Long duration
Consumer Staples (XSJ) (-0.9%) = Consumer discretionary
Real Estate (XPJ) (-0.9%) = Bond proxies
Financials (XFJ) (-0.3%) = Bond proxies
Utilities (XUJ) (-0.2%) = Bond proxies
“Interest rate agnostics”
Resources (XJR) (+1.6%) = Short duration + Pricing power
Gold Sub-Index (XGD) (+2.2%) = Short duration + Pricing power
Energy (XEJ) (+2.3%) = Short duration + Pricing power
To be fair, our major ASX sectors have been moving along these lines for over 6-months now. Hopefully you'll agree that this is the only Evening Wrap that has identified and tracked this move for just about that long. 💯
But! I guess when you look at the market though the lens of fund flows vs changes in the price of money — because ultimately that’s all movements in interest rates are — then stuff that happens on the share market starts to make a lot of sense.
See — we didn’t need all that finance journo hype! 😉
Today's best blue chip gainers
Company | Last Price | Change $ | Change % | 1mo % | 1yr % |
|---|---|---|---|---|---|
Evolution Mining (EVN) | $15.35 | +$0.59 | +4.0% | +18.6% | +171.2% |
Northern Star Resources (NST) | $28.60 | +$0.9 | +3.2% | +5.9% | +65.5% |
Santos (STO) | $6.82 | +$0.2 | +3.0% | +11.8% | -4.3% |
Sandfire Resources (SFR) | $20.25 | +$0.54 | +2.7% | +13.3% | +104.5% |
Woodside Energy Group (WDS) | $24.98 | +$0.66 | +2.7% | +7.9% | +0.1% |
Genesis Minerals (GMD) | $8.13 | +$0.2 | +2.5% | +9.0% | +166.6% |
Rio Tinto (RIO) | $154.82 | +$3.62 | +2.4% | +5.0% | +31.2% |
Perseus Mining (PRU) | $6.43 | +$0.14 | +2.2% | +12.2% | +131.3% |
Capricorn Metals (CMM) | $15.97 | +$0.28 | +1.8% | +8.8% | +110.1% |
BHP Group (BHP) | $50.60 | +$0.85 | +1.7% | +10.9% | +29.3% |
Newmont Corp. (NEM) | $183.79 | +$2.85 | +1.6% | +17.6% | +176.6% |
Medibank Private (MPL) | $4.63 | +$0.07 | +1.5% | -2.9% | +21.8% |
Qantas Airways (QAN) | $10.37 | +$0.14 | +1.4% | +0.9% | +12.2% |
South32 (S32) | $4.56 | +$0.06 | +1.3% | +29.9% | +29.2% |
Lynas Rare Earths (LYC) | $16.20 | +$0.19 | +1.2% | +28.9% | +138.9% |
Whitehaven Coal (WHC) | $9.19 | +$0.09 | +1.0% | +16.9% | +44.3% |
Ramelius Resources (RMS) | $4.97 | +$0.04 | +0.8% | +18.3% | +113.3% |
Downer EDI (DOW) | $7.92 | +$0.06 | +0.8% | -1.2% | +45.6% |
Brambles (BXB) | $22.91 | +$0.16 | +0.7% | +0.1% | +18.8% |
AGL Energy (AGL) | $8.97 | +$0.03 | +0.3% | -3.7% | -22.8% |
Today's worst blue chip losers
Company | Last Price | Change $ | Change % | 1mo % | 1yr % |
|---|---|---|---|---|---|
Life360 (360) | $28.52 | -$2.35 | -7.6% | -14.1% | +15.0% |
Netwealth Group (NWL) | $24.99 | -$1.1 | -4.2% | -7.1% | -16.4% |
Block (XYZ) | $92.33 | -$3.81 | -4.0% | -4.3% | -34.0% |
Ampol (ALD) | $29.15 | -$1.18 | -3.9% | -9.6% | -1.8% |
Wisetech Global (WTC) | $60.70 | -$2.37 | -3.8% | -11.7% | -49.0% |
Cochlear (COH) | $267.65 | -$9.61 | -3.5% | +2.2% | -14.2% |
JB HI-FI (JBH) | $83.02 | -$2.87 | -3.3% | -14.0% | -15.0% |
PLS Group (PLS) | $4.81 | -$0.15 | -3.0% | +9.8% | +107.3% |
Computershare (CPU) | $34.34 | -$1.02 | -2.9% | 0.0% | +0.4% |
IGO (IGO) | $9.10 | -$0.27 | -2.9% | +12.3% | +74.7% |
Aristocrat Leisure (ALL) | $55.01 | -$1.61 | -2.8% | -4.4% | -18.7% |
Nextdc (NXT) | $13.34 | -$0.37 | -2.7% | +2.9% | -16.9% |
Seek (SEK) | $22.21 | -$0.6 | -2.6% | -3.4% | +2.0% |
REA Group (REA) | $190.76 | -$5.06 | -2.6% | +3.5% | -20.9% |
Technology One (TNE) | $26.47 | -$0.64 | -2.4% | -7.3% | -10.4% |
Car Group (CAR) | $29.25 | -$0.68 | -2.3% | -4.0% | -25.4% |
Charter Hall Group (CHC) | $23.53 | -$0.52 | -2.2% | -4.0% | +54.6% |
Resmed Inc (RMD) | $36.82 | -$0.78 | -2.1% | +1.7% | -6.4% |
Challenger (CGF) | $9.09 | -$0.19 | -2.0% | -4.6% | +48.0% |
Pro Medicus (PME) | $186.28 | -$3.89 | -2.0% | -17.5% | -31.1% |
ChartWatch
Nasdaq Composite Index
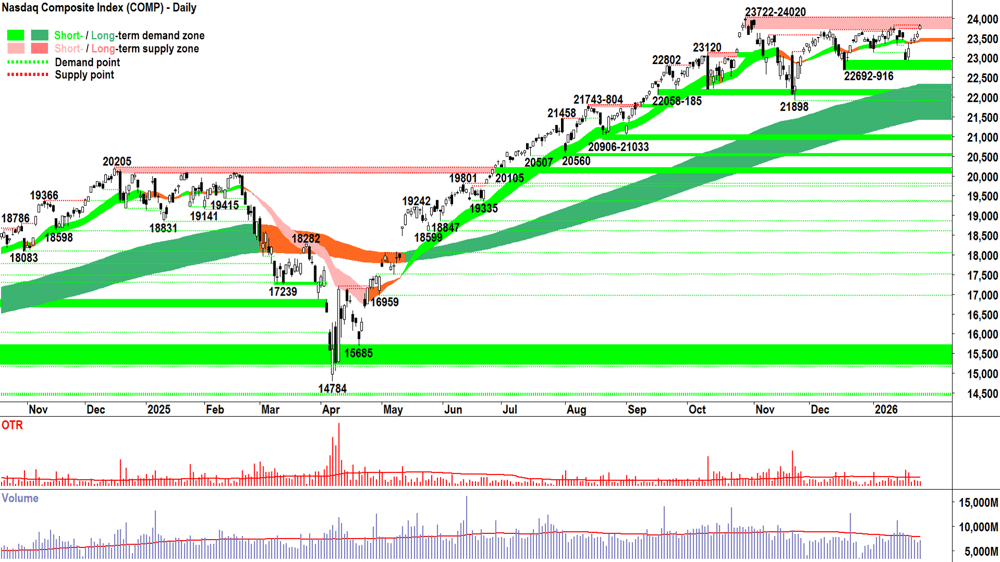
Analysis
We are officially in the 23722-24020 supply zone… 🥳
And based on Tuesday’s candle — there doesn’t seem to be a great deal of motivated supply there…
And based on the pedestrian volume — there doesn't seem to be a great deal of supply there at all.
The gap-open and run, resulting in a credible demand-side showing, however, suggests that there is a decent whack of demand-side motivation.
Size? Again, volume makes it hard to tell — demand simply isn’t encountering much supply… So, motivation is our best/only guide as to the demand-side’s strength and intent.
No change here. There’s all sorts of troubles in the world, and the usual cries of irrational exuberance and overvaluation… yet… the bull market — as it is its nature — has a habit of keeping on keeping on.
LONG LIVE THE BULL MARKET! 🐂💪
(You know the drill… we’re bulls until we see credible signals the supply-side is moving in to take control = black-bodied candles and or upward pointing shadows… lower peaks… lower troughs… volume and volatility spikes accompanying these…)
View
I remain at a 2/3RP portfolio risk limit 🪣 (RP = Risk Position — it reflects my personal allowable capital allocation limit for my investments in US stocks. So 1/2RP is 50%, 2/3RP is 67% and FRP is 100%). A credible demand-side candle from here will trigger a move to FRP vs a close below 22692 would trigger a move to 1/2RP.
Key levels
The next zone of demand is 22692-916. If the Comp closes below that zone, we can assume the supply side is in control. On a close below 21898 the long term uptrend is likely under significant pressure = ⚠️. 23722-24020 is the nearest critical zone of supply — the Comp must close within/above this zone with a strong demand-side candle to confirm the demand-side is unequivocally back in control of the Comp's price.
S&P/ASX 200 (XJO)
%20chart_28%20Jan.png)
Analysis
A bit of a nothing session today… but that’s not necessarily a terrible thing given market reaction to today’s CPI data (rate hike date brought forward from May to next month… and second hike brought forward from 2027 to second half of this year).
Let’s say today’s very modest supply-side showing is far from “the candle” that will likely break this short term uptrend.
Everything else we like to see in a short term uptrend remains intact:
Price Action: Rising peaks and rising troughs (i.e. consistent with supply removal and demand reinforcement, buy the dip + FOMO into rallies). ✅
Candles: Predominantly demand-side in nature (i.e. consistent with pervasive programmed buy orders, lack of strong opposing sell orders). ✅
Volume: Benign, nothing special going on there… which is okay… symptomatic of very little motivated / large supply. ✅
And, it goes without saying, the long term trend hasn’t changed ✅. So, ✅+✅+✅+✅ = Stay the course.
View
I remain comfortable at 2/3RP 🪣 (i.e., my personal allowable capital allocation limit for my investments in Australian stocks is now 67%).
Key levels
The short term trend ribbon is the closest zone of (dynamic) demand (presently 8775-8810). 8765 is the closest static point of demand. A close below it/the short term uptrend ribbon would neutralise the present short term uptrend, while a close below 8675 almost certainly would end it. The October all-time highs around 9110-9116 is the next key zone of supply.
💥 NEW ChartWatch *LIVE* Video Has Dropped! 💥
ChartWatch *LIVE* Webinar
ChartWatch *LIVE* Webinars – WEEKLY Wednesday's @ 12pm AEDT
Learn more about technical analysis and trend following through real case studies on ASX stocks. Australia's premier technical analyst, Carl Capolingua, shares his unique insights on stocks as requested by viewers. Ask about a company in your portfolio or anything related to trading and investing and get Carl's expert opinion.
Places are limited so >REGISTER NOW!<
Economy
Today
AUS December Quarter AUD CPI
Quarterly: +0.9% q/q vs +0.9% q/q forecast and +1.0% q/q in September
Yearly: +3.4% p.a. vs +3.3% p.a. forecast and +3.3% p.a. in September
Later this week
Thursday
11:30 AUD December Import Prices q/q (-0.2% m/m forecast and -0.4% m/m in November)
06:00 USA Federal Open Market Committee (FOMC)
Federal Funds Rate: no change at +3.75% p.a. forecast
06:30 Press Conference with Jerome Powell
Friday
11:30 AUD December Producer Price Index (PPI) q/q (+1.1% q/q forecast vs +1% q/q September)
11:30 AUD December Private Sector Credit m/m (+0.6% m/m forecast and +0.6% m/m in November)
Saturday
12:30 USA December Core PPI m/m (+0.2% m/m forecast vs 0% m/m in November)
Latest News
Interesting Movers
Trading higher
+17.6% Challenger Gold (CEL) – No news, general strength across the broader Energy sector today, rise is consistent with prevailing short and long term uptrends, a regular in ChartWatch ASX Scans Uptrends list 🔎📈
+17.1% Bannerman Energy (BMN) – Becoming a substantial holder, general strength across the broader Uranium sector today, rise is consistent with prevailing short and long term uptrends, a regular in ChartWatch ASX Scans Uptrends list 🔎📈
+13.6% Antipa Minerals (AZY) – Quarterly Activities/Appendix 5B Cash Flow Report, general strength across the broader Precious Metals sector today, rise is consistent with prevailing short and long term uptrends, a regular in ChartWatch ASX Scans Uptrends list 🔎📈
+10.7% Deep Yellow (DYL) – No news, general strength across the broader Uranium sector today, rise is consistent with prevailing short and long term uptrends, a regular in ChartWatch ASX Scans Uptrends list 🔎📈
+10.0% Boss Energy (BOE) – Quarterly Cashflow Report - December 2025 and December 2025 Quarterly Results Presentation, general strength across the broader Uranium sector today.
+8.5% Santana Minerals (SMI) – No news, general strength across the broader Precious Metals sector today, rebounded after yesterday’s sharp sell-off due to Quarterly Activities and Cashflow Reports.
+8.0% American Rare Earths (ARR) – Quarterly Activities/Appendix 5B Cash Flow Report.
+7.8% Silver Mines (SVL) – No news, general strength across the broader Precious Metals sector today.
+7.4% Silex Systems (SLX) – No news, general strength across the broader Uranium sector today.
+7.3% 29METALS (29M) – Retail Entitlement Offer Opens.
+6.8% Brightstar Resources (BTR) – Material early-stage aircore drilling success at Sandstone, general strength across the broader Precious Metals sector today.
+6.0% Lotus Resources (LOT) – No news, general strength across the broader Uranium sector today.
+5.4% Paladin Energy (PDN) – No news, general strength across the broader Uranium sector today.
Trading lower
-13.8% Elevra Lithium (ELV) – December 2025 Quarterly Activities Report, general weakness across the broader Lithium sector today.
-11.0% Dateline Resources (DTR) – Pulled back after yesterday’s sharp rally due to IP Survey Completed Ahead of Diamond Drilling.
-9.2% Fineos Corp. Holdings (FCL) – Quarterly Activities/Appendix 4C Cash Flow Report.
-8.6% Northern Minerals (NTU) – Exploration results including new Vulcan prospect.
-7.6% Life360 (360) – Pull back continues after 23-Jan sharp rally due to Update on Preliminary Q4 2025 and Full Year Results.
-7.2% Weebit Nano (WBT) – No news, general weakness across the broader Information Technology sector today.
-6.9% Syrah Resources (SYR) – December 2025 Quarterly Activities Presentation.
-6.9% Wildcat Resources (WC8) – No news, general weakness across the broader Lithium sector today.
-6.8% Catapult Sports (CAT) – CEO Share Sale, general weakness across the broader Information Technology sector today, fall is consistent with prevailing short and long term downtrends, a regular in ChartWatch ASX Scans Downtrends list 🔎📉
-6.6% Temple & Webster Group (TPW) – Ceasing to be a substantial holder, general weakness across the broader Consumer Discretionary sector today, fall is consistent with prevailing short and long term downtrends, a regular in ChartWatch ASX Scans Downtrends list 🔎📉
-6.1% Myer Holdings (MYR) – No news, general weakness across the broader Consumer Discretionary sector today, fall is consistent with prevailing short and long term downtrends, a regular in ChartWatch ASX Scans Downtrends list 🔎📉
-5.9% Bravura Solutions (BVS) – No news, general weakness across the broader Information Technology sector today, fall is consistent with prevailing short and long term downtrends, a regular in ChartWatch ASX Scans Downtrends list 🔎📉
Broker Moves
Australian Ethical Investment (AEF)
Upgraded to buy from accumulate at Ord Minnett; Price Target: $7.50
AML3D (AL3)
Retained at speculative buy at Bell Potter; Price Target: $0.40
ANZ Group Holdings (ANZ)
Retained at neutral at Macquarie; Price Target: $36.00 from $35.00
Retained at equal-weight at Morgan Stanley; Price Target: $36.30 from $36.00
Aspen Group (APZ)
Retained at buy at Bell Potter; Price Target: $6.25 from $5.95
ARB Corporation (ARB)
Retained at buy at Citi; Price Target: $42.25
Abacus Storage King (ASK)
Initiated at buy at Bell Potter; Price Target: $1.70
AUB Group (AUB)
Retained at outperform at CLSA; Price Target: $37.45 from $38.85
Retained at buy at Goldman Sachs; Price Target: $37.00 from $38.00
Retained at overweight at Jarden; Price Target: $38.20 from $37.90
Retained at overweight at JPMorgan; Price Target: $42.00
Retained at overweight at Morgan Stanley; Price Target: $45.00
Retained at neutral at UBS; Price Target: $35.00 from $33.70
Bendigo and Adelaide Bank (BEN)
Retained at underperform at Macquarie; Price Target: $10.00 from $9.70
Biome Australia (BIO)
Retained at buy at Bell Potter; Price Target: $1.00
Benz Mining Corp (BNZ)
Retained at speculative buy at Canaccord Genuity; Price Target: $3.10
Bank of Queensland (BOQ)
Upgraded to neutral from underperform at Macquarie; Price Target: $6.50 from $5.90
Botanix Pharmaceuticals (BOT)
Retained at buy at Canaccord Genuity; Price Target: $0.21 from $0.24
Retained at speculative buy at E&P; Price Target: $0.40 from $0.41
Retained at buy at Euroz Hartleys; Price Target: $0.43 from $0.44
BWP Trust (BWP)
Retained at buy at Citi; Price Target: $4.00
Commonwealth Bank of Australia (CBA)
Retained at underperform at Macquarie; Price Target: $120.00 from $106.00
Retained at underweight at Morgan Stanley; Price Target: $131.00
Centuria Industrial REIT (CIP)
Retained at buy at Bell Potter; Price Target: $3.75 from $3.65
Centuria Capital Group (CNI)
Downgraded to hold from buy at Bell Potter; Price Target: $2.25 from $2.40
Centuria Office REIT (COF)
Retained at sell at Bell Potter; Price Target: $1.05 from $1.10
Cedar Woods Properties (CWP)
Retained at buy at Bell Potter; Price Target: $10.00
Digico Infrastructure REIT (DGT)
Upgraded to buy from hold at Bell Potter; Price Target: $3.25 from $3.20
Dexus Convenience Retail REIT (DXC)
Retained at buy at Bell Potter; Price Target: $3.45
Dexus Industria REIT (DXI)
Retained at buy at Bell Potter; Price Target: $3.10
Electro Optic Systems Holdings (EOS)
Retained at speculative buy at Ord Minnett; Price Target: $12.72
GDI Property Group (GDI)
Retained at buy at Bell Potter; Price Target: $0.85
Gemlife Communities Group (GLF)
Retained at buy at Bell Potter; Price Target: $5.55
Goodman Group (GMG)
Retained at buy at Bell Potter; Price Target: $37.40 from $40.25
GQG Partners Inc. (GQG)
Retained at buy at Ord Minnett; Price Target: $2.30
HealthCo Healthcare and Wellness REIT (HCW)
Retained at buy at Bell Potter; Price Target: $1.00
HomeCo Daily Needs REIT (HDN)
Downgraded to sell from hold at Bell Potter; Price Target: $1.35 from $1.40
HMC Capital (HMC)
Retained at hold at Bell Potter; Price Target: $4.25 from $3.60
ioneer (INR)
Retained at speculative buy at Ord Minnett; Price Target: $0.40 from $0.35
Judo Capital Holdings (JDO)
Retained at outperform at Macquarie; Price Target: $2.00 from $1.95
Karoon Energy (KAR)
Retained at buy at Citi; Price Target: $1.90
Retained at overweight at Jarden; Price Target: $1.75 from $1.65
Retained at overweight at JPMorgan; Price Target: $2.00 from $2.15
Downgraded to underperform from neutral at Macquarie; Price Target: $1.50 from $1.65
Retained at equal-weight at Morgan Stanley; Price Target: $1.81
Retained at sector perform at RBC Capital Markets; Price Target: $2.05
Lifestyle Communities (LIC)
Retained at hold at Bell Potter; Price Target: $6.05 from $5.70
Monadelphous Group (MND)
Retained at buy at Citi; Price Target: $28.75
National Australia Bank (NAB)
Retained at equal-weight at Morgan Stanley; Price Target: $40.40 from $40.00
NRW Holdings (NWH)
Retained at buy at Citi; Price Target: $6.20
News Corporation (NWS)
Retained at buy at UBS; Price Target: $64.40
Oohmedia (OML)
Retained at buy at UBS; Price Target: $1.75
Region Group (RGN)
Retained at buy at Bell Potter; Price Target: $2.70
Regal Partners (RPL)
Retained at buy at Ord Minnett; Price Target: $4.80 from $4.90
Ricegrowers (SGLLV)
Initiated at buy at Bell Potter; Price Target: $18.75
Stanmore Resources (SMR)
Downgraded to trim from buy at Morgans; Price Target: $2.95 from $2.70
Retained at buy at Ord Minnett; Price Target: $3.80 from $3.70
Supply Network (SNL)
Retained at buy at Ord Minnett; Price Target: $41.00 from $40.20
Summerset Group Holdings (SNZ)
Retained at buy at Bell Potter; Price Target: $14.75
West African Resources (WAF)
Retained at neutral at Macquarie; Price Target: $3.20
Westpac Banking Corporation (WBC)
Retained at underperform at Macquarie; Price Target: $35.00 from $32.00
Retained at underweight at Morgan Stanley; Price Target: $34.50 from $34.10
Xero (XRO)
Retained at buy at Citi; Price Target: $210.00
Scans
Top Gainers
Code | Company | Last | % Chg |
|---|---|---|---|
| KLV | Klevo Rewards Ltd | $0.017 | +54.55% |
| EDE | Eden Innovations Ltd | $0.125 | +48.81% |
| HT8 | Harris Technology Group Ltd | $0.013 | +44.44% |
| CRI | Critica Ltd | $0.034 | +41.67% |
| SHN | Sunshine Metals Ltd | $0.039 | +34.48% |
Top Fallers
Code | Company | Last | % Chg |
|---|---|---|---|
| SNS | Sensen Networks Ltd | $0.039 | -38.10% |
| W2V | Way 2 Vat Ltd | $0.11 | -26.67% |
| ERE | European Resources Ltd | $0.012 | -20.00% |
| EMN | Euro Manganese Inc | $0.22 | -18.52% |
| VFX | Visionflex Group Ltd | $0.095 | -17.39% |
52 Week Highs
Code | Company | Last | % Chg |
|---|---|---|---|
| KLV | Klevo Rewards Ltd | $0.017 | +54.55% |
| EDE | Eden Innovations Ltd | $0.125 | +48.81% |
| SHN | Sunshine Metals Ltd | $0.039 | +34.48% |
| RC1 | Redcastle Resources Ltd | $0.20 | +33.33% |
| BNZ | BENZ Mining Corp | $2.74 | +21.78% |
52 Week Lows
Code | Company | Last | % Chg |
|---|---|---|---|
| ERE | European Resources Ltd | $0.012 | -20.00% |
| STH | Stepchange Holdings Ltd | $0.125 | -10.71% |
| HNG | Hancock & Gore Ltd | $0.20 | -6.98% |
| VHL | Vitasora Health Ltd | $0.021 | -6.67% |
| OFX | OFX Group Ltd | $0.47 | -6.00% |
Near Highs
Code | Company | Last | % Chg |
|---|---|---|---|
| WVOL | iShares MSCI World Ex Aust Minimum Volatility ETF | $44.50 | -0.54% |
| IAGPF | Insurance Australia Group Ltd | $105.70 | +0.32% |
| GCI | Gryphon Capital Income Trust | $2.07 | -0.48% |
| VVLU | Vanguard Global Value Equity Active ETF | $80.06 | -0.88% |
| IHD | iShares S&P/ASX DIV Opportunities Esg Screened ETF | $16.61 | -0.18% |
Relative Strength Index (RSI) Oversold
Code | Company | Last | % Chg |
|---|---|---|---|
| OPPT | Magellan Global Opportunities Fund - Active ETF | $1.685 | -2.04% |
| NDIA | Global X India Nifty 50 ETF | $66.51 | -1.25% |
| CTT | Cettire Ltd | $0.59 | -1.67% |
| PNV | Polynovo Ltd | $1.035 | -4.61% |
| USD | Betashares U.S. Dollar ETF | $14.34 | -1.17% |
