Aussie dollar rally creates winners and losers on the ASX 200
The Aussie has broken above 70 US cents for the first time in two years, with resources expected to benefit most, according to Citi.

Source: Shutterstock
KEY POINTS
- The Australian dollar has climbed to 70.22 US cents, its highest level since February 2023, driven by the highest bond yields in the developed world and expectations of further RBA rate hikes.
- Resource stocks including BHP, Rio Tinto and Fortescue historically outperform during Aussie dollar rallies, with materials showing the strongest positive correlation to currency movements.
- Defensive sectors like healthcare, utilities and staples tend to underperform when the Australian dollar strengthens, with stocks like CSL and Brambles showing negative correlations.
The Australian dollar rallied above 70 US cents for the first time since February 2023, with analysts widely expecting further gains amid a hawkish RBA and bullish commodity markets.
The Aussie posted a seven-day winning streak through to Tuesday, 3 February, climbing from 66.83 to 70.22 US cents. With a year-to-date gain of 4.6%, it has emerged as the best performing major currency.
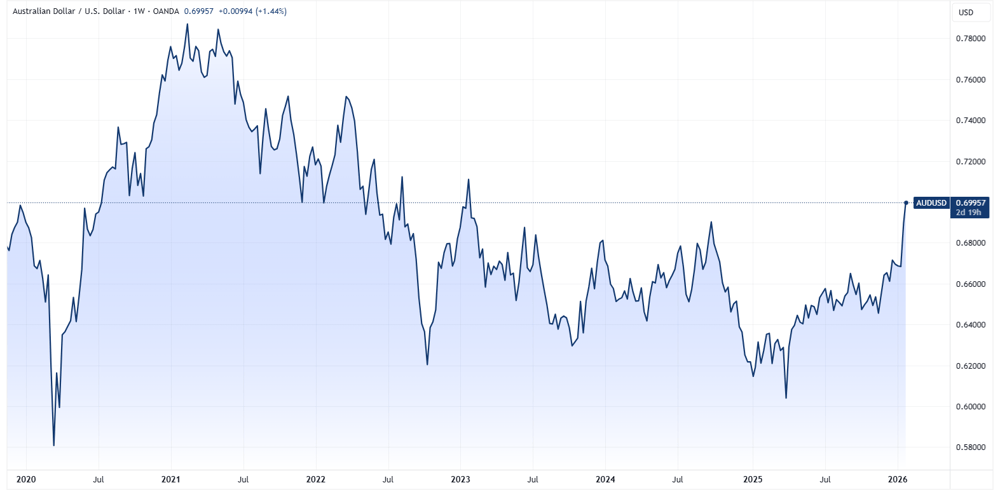
Australian dollar / US dollar chart (Source: TradingView)
The sharp rally reflects a range of converging factors:
Australian bonds now offer the highest yields in the developed world, with 10-year yields at 4.82%, their highest since October 2023. The US-Australia yield spread has widened to its largest gap in three years.
The RBA is widely expected to hike at its upcoming February meeting, with markets pricing in two 25 bp increases by year-end. This contrasts with most developed nation central banks that remain on hold.
Australia has one of the highest inflation rates in the developed world. The latest data (released 28-Jan) showed December CPI accelerating to 3.8%, up from 3.2% the previous month and above market expectations of 3.6%.
Commodity prices are surging, with the Bloomberg Commodity Index up 9.7% in the past month to its highest level since September 2022.
These factors boost relative returns and demand for the local currency. Higher bond yields and a widening yield spread attract global capital flows into Australian fixed income, lifting demand for the Aussie. Expectations of further RBA hikes and persistently high inflation reinforce the view that Australian rates will stay higher for longer, supporting carry trades and yield-seeking inflows. Meanwhile, rising commodity prices boost export revenues and Australia's terms of trade, directly increasing demand for the Australian dollar.
Sector winners and losers
The Aussie has been relatively quiet for some time, so analyst research is somewhat dated but remains relevant. In late 2023, Citi analysts found that a rising Australian dollar favors cyclicals while weighing on defensives.
Before diving into the tables below, there are two key terms that need to be explained:
Beta measures how much a sector's price moves relative to movements in the Aussie dollar. A beta above 1 indicates higher volatility. When the Aussie moves up or down, sectors with higher betas tend to swing more dramatically in the same direction.
T-stat is a confidence measure. A high t-stat suggests a reliable relationship between the Aussie dollar and sector performance, rather than random correlation.
Sector | Cyclical or Defensive | Beta | T-stat |
|---|---|---|---|
Materials | Cyclical | 0.6 | 1.2 |
Energy | Cyclical | 0.5 | 0.8 |
Financials | Cyclical | 0.1 | 0.5 |
Industrials | Cyclical | 0.2 | 0.1 |
Communications | Defensive | 0.1 | 0.1 |
Discretionary | Cyclical | 0.1 | 0.1 |
Technology | Cyclical | 0.2 | -0.1 |
Utilities | Defensive | -0.1 | -0.8 |
Real Estate | Defensive | -0.1 | -1.0 |
Staples | Defensive | -0.4 | -1.4 |
Health Care | Defensive | -0.3 | -1.5 |
Source: Citi Research, Dec-23
Miners run, defensives lag
A 10-year monthly backtest found resource stocks tend to outperform during Aussie dollar rallies, while defensives often lag.
The analysts noted that some of this correlation stems from cyclical stocks and a rising Aussie both being driven by improving economic conditions, rather than stock-specific fundamentals.
Source: Citi Research, Dec-23
Defensives typically perform better during periods of Australian dollar weakness, which tends to coincide with economic uncertainty.
Interestingly, Brambles has fallen roughly 11% since September and is now trading around its 200-day moving average, a level not seen since July 2024.
Ticker | Company | Sector | Beta | T-Stat |
|---|---|---|---|---|
Brambles | Industrials | -0.6 | -3.9 | |
CSL | Health Care | -0.5 | -3.5 | |
APA | Utilities | -0.5 | -3.3 | |
Transurban | Industrials | -0.3 | -2.8 | |
Telstra | Communications | -0.4 | -2.8 | |
ASX | Financials | -0.4 | -2.8 | |
Woolworths | Staples | -0.4 | -2.6 | |
Sonic Healthcare | Health Care | -0.4 | -2.6 | |
James Hardie Industries | Materials | -0.6 | -2.5 | |
Cochlear | Health Care | -0.4 | -2.4 |
Source: Citi Research, Dec-23
The bottom line
The Aussie may be turning a corner after spending most of 2021-2025 trending lower against the US dollar. Many of the drivers behind the recent rally continue to strengthen, particularly the soaring commodity price backdrop and widening yield differentials. If Citi's research is anything to go by, resources are the play here.
