News | Market Wraps
Evening Wrap: ASX 200 stacks on 125 points as BHP and RIO each rebound 3%, big banks also stronger as oil price eases
The S&P/ASX 200 closed 125.1 points higher, up 1.47%.

Mentioned
The S&P/ASX 200 closed 125.1 points higher, up 1.47%.
The ASX 200 surged after weaker-than-expected jobs data slashed the odds of further RBA rate hikes, while President Trump's claim that peace talks with Iran were in their "final stages" sent oil plunging overnight.
Be sure to click/scroll through for the usual reporting of the major sector and stock-specific moves, the broker responses to them, as well as all the key economic data in tonight's Evening Wrap. Also, I have detailed technical analysis on the Nasdaq Composite and the S&P/ASX 200 in today's ChartWatch.
Let's dive in!
Today in Review
Thu 21 May 26, 4:58pm (AEST)
Name | Value | % Chg |
|---|---|---|
Major Indices | ||
| ASX 200 | 8,621.7 | +1.47% |
| All Ords | 8,840.8 | +1.42% |
| Small Ords | 3,374.6 | +1.82% |
| All Tech | 2,786.2 | +0.34% |
| Emerging Companies | 2,943.9 | +1.59% |
Currency | ||
| AUD/USD | 0.712 | -0.45% |
US Futures | ||
| S&P 500 | 7,446.75 | -0.07% |
| Dow Jones | 50,023.0 | -0.14% |
| Nasdaq | 29,364.75 | -0.09% |
Name | Value | % Chg |
|---|---|---|
Sector | ||
| Materials | 23,961.9 | +2.56% |
| Real Estate | 3,573.8 | +2.21% |
| Industrials | 7,961.7 | +1.62% |
| Financials | 9,265.2 | +1.45% |
| Consumer Discretionary | 3,418.4 | +1.29% |
| Health Care | 22,940.4 | +1.17% |
| Consumer Staples | 11,713.2 | +0.18% |
| Information Technology | 1,726.0 | +0.02% |
| Communication Services | 1,724.5 | -0.64% |
| Utilities | 9,903.0 | -0.67% |
| Energy | 10,658.9 | -0.95% |
Markets
%20intraday%20chart_21%20May.png)
ASX 200 Session Chart
The S&P/ASX 200 (XJO) finished 125.1 points higher at 8,621.7, 1.5% from its session low and 0.3% from its high. This next metric has flipped-flopped from one extreme to the other over the last four trading sessions, but today in the broader-based S&P/ASX 300 (XKO) advancers easily beat decliners by 235 to 53.
Materials (XMJ) (+2.6%) led the session's recovery as investors bought a five-day pullback that had wiped nearly 8% from the sector at its lows. Today's prosperity was driven by a combination of falling bond yields and the overnight oil price drop reducing inflation pressure on global growth.
COMEX copper rallied 2.0% overnight before pulling back 1.3% to US$6.25/lb in Asian trade, while SGX iron ore futures fell 1.6% to US$105.60/t — arguably headwinds at the commodity level — but insufficient to deter buyers looking for bargains. Rio Tinto (RIO) (+3.2%), BHP (BHP) (+3.1%), James Hardie Industries (JHX) (+5.4%), South32 (S32) (+2.5%), and Sandfire Resources (SFR) (+2.4%) all advanced strongly.
Lithium stocks were the session's commodity standout, rising sharply despite GFEX lithium carbonate futures falling 3.0% to CNY 177,600/t — Australian spodumene concentrate steadied after five consecutive days of heavy losses, edging up 0.7% to US$2,647/t. The broader mining sector's strong momentum carried the cohort with it. Elevra Lithium (ELV) (+9.3%), IGO (IGO) (+7.5%), Liontown Resources (LTR) (+4.2%), Develop Global (DVP) (+3.6%), Mineral Resources (MIN) (+2.9%), and Pilbara Minerals (PLS) (+2.2%) all surged.
Rare earths stocks also gained as NdPr in China firmed 1.8% to CNY 702,500/t. Arafura Rare Earths (ARU) (+5.1%), Lynas Rare Earths (LYC) (+1.1%), and Iluka Resources (ILU) (+0.7%) were all stronger.
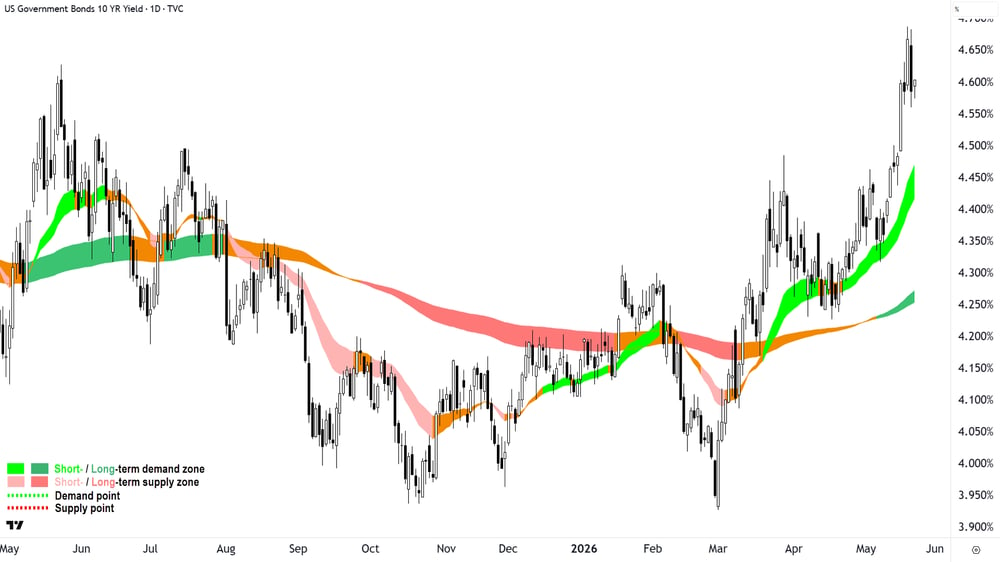
US 10-Year T-Bond yield, Daily chart
Real Estate (XPJ) (+2.3%) was the second-best sector as benchmark bond yields reversed sharply overnight following the pullback in the oil price. When risk-free yields fall, the stable income streams of property trusts become more attractive relative to bonds — drawing buyers back in. Goodman Group (GMG) (+2.8%), Stockland (SGP) (+2.8%), and Charter Hall (CHC) (+2.4%) led the sector.
Financials (XFJ) (+1.5%) bounced on the same lower-yield dynamic. The jobs surprise (see Economy) also directly reduced the probability of a fourth rate hike, easing credit quality concerns that had weighed on bank valuations. National Australia Bank (NAB) (+2.3%), Westpac (WBC) (+2.2%), ANZ (ANZ) (+1.6%), and Commonwealth Bank (CBA) (+0.9%) all gained.
The Gold Sub-Index (XGD) (+1.6%) recovered as lower bond yields reduced the opportunity cost of holding gold — but having said that, COMEX gold futures eased a modest 0.3% to US$4,527/oz and COMEX silver futures fell 1.1% to US$75.35/oz in the Asian session. Again, it was a matter sentiment shift lifting all boats today. Greatland Gold (GGP) (+5.0%), Evolution Mining (EVN) (+3.8%), and Newmont (NEM) (+2.2%) were the standout movers.
Consumer Discretionary (XDJ) (+1.3%) gained as the overnight oil plunge eased cost-of-living pressure and falling yields lifted consumer sentiment. Guzman Y Gomez (GYG) (+13.0%) was the session's standout after an RBC upgrade, though the broader sector was supported more generally by the same macro tailwinds as others.
Health Care (XHJ) (+1.2%) had its second positive session in three days in what remains an otherwise deeply bearish trend for the sector over the past 12 months. The lower-yield environment provided some relief for the sector's long-duration valuations.
Energy (XEJ) (-1.0%) was the session's weakest sector despite ICE Brent crude futures recovering 1.2% to US$106.31/bbl in Asian trade — the rebound was insufficient to offset the overnight 5.6% plunge that triggered sharp repositioning in oil and gas names. globalCoal Newcastle coal futures fell 1.2% to $140.15/t, weighing on coal stocks. Woodside Energy (WDS) (-2.1%), Yancoal Australia (YAL) (-3.4%), and Viva Energy (VEA) (-1.7%) were all lower.
Utilities (XUJ) (-0.7%) were softer, appearing to be caught in energy sector sentiment rather than reflecting the lower-yield dynamic that lifted real estate and financials — Origin Energy (ORG) (-1.0%) and AGL Energy (AGL) (-0.8%) were both weaker.
Communication Services (XTJ) (-0.6%) and Consumer Staples (XSJ) (+0.2%) both gave back some of yesterday's defensive gains as investors rotated back into cyclical and growth names. REA Group (REA) (-3.7%) was the sharpest Communication Services faller. Coles (COL) (-0.3%) and A2 Milk (A2M) (-0.5%) edged lower within Staples.
Today's best ASX Top 300 gainers
Company | Last Price | Change $ | Change % | 1mo % | 1yr % |
|---|---|---|---|---|---|
Guzman Y Gomez (GYG) | $18.08 | +$2.08 | +13.0% | -9.2% | -41.9% |
Weebit Nano (WBT) | $6.79 | +$0.78 | +13.0% | +64.8% | +299.4% |
Catapult Sports (CAT) | $3.76 | +$0.37 | +10.9% | +19.7% | -23.1% |
Qoria (QOR) | $0.275 | +$0.025 | +10.0% | -20.3% | -32.1% |
Virgin Australia (VGN) | $2.46 | +$0.21 | +9.3% | +2.1% | 0% |
Elevra Lithium (ELV) | $12.22 | +$1.04 | +9.3% | +17.6% | +409.2% |
Polynovo (PNV) | $1.135 | +$0.09 | +8.6% | +11.8% | -16.9% |
Clarity Pharmaceuticals (CU6) | $2.72 | +$0.2 | +7.9% | -7.2% | +18.8% |
IGO (IGO) | $9.07 | +$0.63 | +7.5% | +2.3% | +119.1% |
Firefly Metals (FFM) | $1.900 | +$0.12 | +6.7% | -9.1% | +107.0% |
Judo Capital (JDO) | $1.400 | +$0.085 | +6.5% | +2.9% | +1.8% |
G8 Education (GEM) | $0.165 | +$0.01 | +6.5% | -34.0% | -87.1% |
Imdex (IMD) | $4.03 | +$0.23 | +6.1% | -0.5% | +45.5% |
Droneshield (DRO) | $3.00 | +$0.17 | +6.0% | -21.7% | +144.9% |
Temple & Webster (TPW) | $5.01 | +$0.26 | +5.5% | -24.1% | -75.0% |
James Hardie (JHX) | $27.99 | +$1.44 | +5.4% | -8.9% | -22.4% |
Dateline Resources (DTR) | $0.195 | +$0.01 | +5.4% | -27.8% | +509.4% |
Capstone Copper (CSC) | $13.34 | +$0.67 | +5.3% | +9.1% | +74.4% |
Iperionx (IPX) | $4.90 | +$0.24 | +5.2% | +15.6% | +53.1% |
Tyro Payments (TYR) | $0.825 | +$0.04 | +5.1% | +4.4% | -4.1% |
Today's worst ASX Top 300 losers
Company | Last Price | Change $ | Change % | 1mo % | 1yr % |
|---|---|---|---|---|---|
Stanmore Resources (SMR) | $2.41 | -$0.2 | -7.7% | +10.0% | +25.5% |
EQT (EQT) | $16.64 | -$1.02 | -5.8% | -19.0% | -46.1% |
St Barbara (SBM) | $0.550 | -$0.03 | -5.2% | -17.9% | +80.3% |
Predictive Discovery (PDI) | $0.725 | -$0.035 | -4.6% | -24.9% | +72.6% |
REA (REA) | $158.47 | -$6.03 | -3.7% | -9.9% | -36.9% |
Yancoal Australia (YAL) | $6.72 | -$0.24 | -3.4% | -1.9% | +30.5% |
Propel Funeral Partners (PFP) | $3.40 | -$0.11 | -3.1% | -14.6% | -27.0% |
Southern Cross Gold (SX2) | $9.21 | -$0.24 | -2.5% | -19.1% | +60.5% |
Xero (XRO) | $76.54 | -$1.81 | -2.3% | -7.5% | -57.9% |
Technology One (TNE) | $29.16 | -$0.68 | -2.3% | -3.8% | -23.0% |
Vulcan Steel (VSL) | $5.33 | -$0.12 | -2.2% | +3.9% | -20.6% |
Beach Energy (BPT) | $1.135 | -$0.025 | -2.2% | -1.3% | -13.7% |
Northern Star Resources (NST) | $18.94 | -$0.41 | -2.1% | -16.9% | -6.5% |
Woodside Energy (WDS) | $31.83 | -$0.67 | -2.1% | +3.4% | +48.3% |
Viva Energy (VEA) | $2.30 | -$0.04 | -1.7% | -0.4% | +21.1% |
Lendlease (LLC) | $2.99 | -$0.05 | -1.6% | -12.3% | -48.6% |
GQG Partners (GQG) | $1.575 | -$0.025 | -1.6% | -6.8% | -26.1% |
Ramsay Health Care (RHC) | $37.71 | -$0.58 | -1.5% | -7.5% | +5.7% |
Integral Diagnostics (IDX) | $2.01 | -$0.03 | -1.5% | -9.5% | -16.9% |
ChartWatch
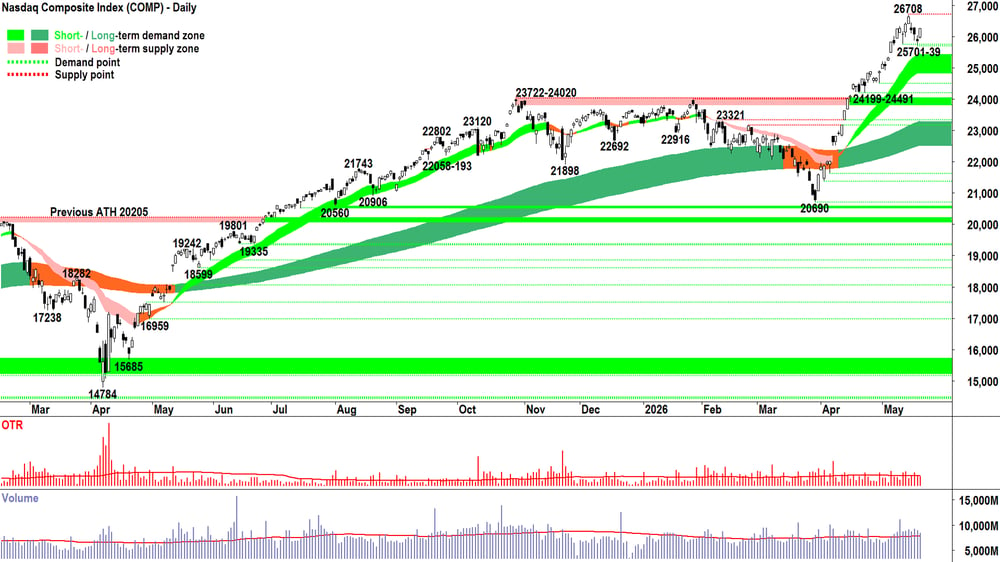
Nasdaq Composite Index
Analysis
What did you expect? For it to crash? 🤷
And that really gets to the heart of what I'm trying to do here. Do you want to be the kind of analyst that looks at the chart above and says: "It's sure to crash". Or do you want to be a trend follower who says, "Yep, makes sense, D > S = P⬆️ MOTN".
The two mindsets are polar opposites. You get plenty of the first mindset out there in financial media land — I hope I provide some balance via the second. ⚖️
Anyways, if you've been suffering through my ChartWatch content for long enough — you know there's very little required to add here. (Yeah, yeah Carl, shut up... You had me at 'D > S = P⬆️ MOTN'!)
'It's a cynical world we live in, full of tough competitors...' Yeah, yeah... You had me at 'hello'!
View
FRP (RP = Risk Position — it reflects my personal allowable capital allocation limit for my investments in US stocks. So 1/2RP is 50%, 2/3RP is 67% and FRP is 100% 🪣).
Key levels
26708 is the key point of supply. 25701-39 is the closest zone of demand, then there's the short term uptrend ribbon (presently 24915-25487). If the price closes back below this range, the supply-side is very likely back in control of the Comp's price.
S&P/ASX 200 (XJO)
%20chart_21%20May.png)
Analysis
It's foolish to call a market "crazy". Markets aren't corporeal beings! We can say something like: The last four trading sessions are unusual / rare / indicative of substantial indecision...
Finance journos would call it: "A volatile period on the ASX". Candlestick buffs would call it a "Zebra Pattern". 🦓
Whatever you call it, it's actually not that uncommon for the OTP to behave like this — particularly around major turning points. Just look at the chart above:
The 7169 major low showed a 4-candle 🦓
The 8383-8457 major low showed a 4-candle 🦓
The 86675-8683 test and hold of the long term uptrend ribbon showed plenty of chop before the definitive long-black-long-white due of 6-Feb - 9-Feb.
Scroll back and you'll find other, similar "chop and pop" moments. It just part of the price discovery process... How, at times, the prevailing supply side environment exhausts and is overwhelmed (eventually) by the demand side.
Whether this chop transitions into a pop (yes, I think I just coined a new candlestick pattern!) is yet to be seen. You know I have to say that. I don't do predictions. 🚫🔮
But today's candle is a very credible demand side showing that we must treat at face value: Long + White + High Close. ✅
Volume... yep — a bust. Hardly an emphatic: "Let me in!!!" from the demand side. Perhaps the benefit of the doubt is required here — because it's not like there was much supply around either. (= chop, chop, chop, on little commitment! 🪓)
The trend ribbons are critical now. Together, they represent a likely strong zone of excess supply that must be consumed if the OTP is to have any chance of constructing a new short term uptrend.
Really, until this occurs — or flipping the script and acknowledging the bear case — until a close below yesterday's low-now-trough at 8485, I feel my present risk settings are probably adequate.
Fingers crossed the OTP can do the job here🤞 — but surely with such little actual demand side commitment via the volume today, we can be forgiven for our collective scepticism!? 😒
View
Not so smug now, huh!? I remain 1/3RP 🪣 on the OTP (i.e., my personal allowable capital allocation limit for my investments in Australian stocks is 33%). Let's see a confident close back above the trend ribbons before deciding on whether to move some capital back in.
Key levels
The short- and long-term downtrend ribbons (presently 8675-8743) combine to represent the key zone of supply. Beyond that, it's the not so lucky 8888 level! Demand is the 8262-8379 zone. Below that... 😱!
(Glossary of acronyms! Old Tin Pot (OTP): S&P/ASX 200 | MOTN: More Often Than Not | FOMO: Fear Of Missing Out | HOFU: Holding On For Upside | BTD: Buy The Dip | STR: Sell The Rally | RP: Risk Position)
ChartWatch *LIVE* Webinar
ChartWatch *LIVE* Webinars – WEEKLY Wednesday's @ 12pm AEDT
Learn more about technical analysis and trend following through real case studies on ASX stocks. Australia's premier technical analyst, Carl Capolingua, shares his unique insights on stocks as requested by viewers. Ask about a company in your portfolio or anything related to trading and investing and get Carl's expert opinion.
Places are limited so >REGISTER NOW!<
Economy
Today
AUS April Employment Data
Employment Change: -18,600 vs +15,700 and +17,900 in March
Unemployment Rate: 4.5% vs unchanged at 4.3% forecast
Takeaways:
Looks bad at the headline, with full time employment dipping 11,000 and part time by 8,000, but hours worked increased... So there's still plenty of work to do — even if employers are scaling back.
Businesses appear to have slowed hiring activity on the back of falling confidence due to rising energy prices / general uncertainty over the Middle East conflict. April contained Easter and school holidays which may have contribute to the slower hiring.
Economists at National Australia Bank pushed back their forecast for the RBA's next rate hike from June to August; ANZ said the cash rate is likely on pause for now;
Later this week
Thursday
21:45 USA Flash May Purchasing Managers Index (PMI)
Manufacturing: 53.6 forecast vs 54.5 in April
Services: 51.1 forecast vs 51.0 in April
Friday
No major economic data are scheduled for release this day
Latest News
Interesting Movers
Trading higher
+13.0% Guzman Y Gomez (GYG) - RBC Capital Markets upgraded to Outperform from Sector Perform and lifted its price target to $22.00 from $20.00, noting the stock is down 26% year-to-date and down 27% from its IPO price, and citing the company's store pipeline as the primary driver of near-term earnings growth.
+10.9% Catapult Sports (CAT) - five of five brokers surveyed retained buy-equivalent ratings following yesterday's FY26 results, with four increasing their price targets; the average price target rose to $4.86 from $4.78.
+10.4% Webjet Group (WJL) - disclosed that Helloworld Travel had accumulated a 19.95% stake in the company; under the Corporations Act, Helloworld will be required to make a formal bid if its stake reaches 20%.
+9.3% Virgin Australia (VGN) - announced the indefinite suspension of Brisbane-Apia services from August 24 and Brisbane/Melbourne-Uluru services from late October, reducing capacity commitments and improving cost structure.
+6.8% SkinKandy (SK1) - debuted on the ASX following an oversubscribed $160 million IPO at $2.20 per share, giving the body piercing chain a market capitalisation of $245.7 million at the offer price.
+5.4% James Hardie Industries (JHX) - four of four brokers retained buy-equivalent ratings following yesterday's fourth-quarter results, with Citi describing the result as "solid" and noting tight guidance suggests trading conditions may be stabilising, despite three cutting their price targets.
+5.2% IperionX (IPX) - commissioned a 300-tonne six-axis SACMI powder metallurgy press at its Virginia titanium manufacturing campus, tripling existing capacity and enabling production of complex near-net-shape parts with capacity for up to 11 million single-cavity parts annually.
+4.8% GR Engineering Services (GNG) - signed a $229 million engineering, procurement and construction contract with Genesis Minerals for the Tower Hill Gold Project in Western Australia, formalising delivery responsibilities for the 3.5–4.0Mtpa development.
+2.7% Zip Co (ZIP) - reached a settlement with Firstmac over its trademark dispute, acquiring the registered Zip trademark and securing the right to continue using the brand across its Australian products and services with no further liability for damages or costs.
Trading lower
-12.3% IPD Group (IPG) - FY26 underlying EBITDA guidance of $50.5–51.3 million came in approximately 7.6% below the FactSet consensus midpoint of $53.2–57.2 million.
-5.8% EQT Holdings (EQT) - disclosed it will defend ASIC civil proceedings in the Federal Court relating to the First Guardian Master Fund, involving its subsidiary Equity Trustees Superannuation Limited.
-2.1% Northern Star Resources (NST) - managing director Stuart Tonkin announced he will step down in the first quarter of next financial year after 13 years with the company, with a formal succession process now underway.
Broker Moves
The a2 Milk Company (A2M)
Retained at overweight at Morgan Stanley; Price Target: $9.90
Accent Group (AX1)
Retained at hold at Bell Potter; Price Target: $0.60 from $0.68
Boab Metals (BML)
Retained at buy at Shaw and Partners; Price Target: $1.70
Brambles (BXB)
Downgraded to equal-weight from overweight at Morgan Stanley; Price Target: $19.00 from $28.00
Catapult Sports (CAT)
Retained at buy at Bell Potter; Price Target: $4.65 from $4.50
Retained at outperform at CLSA; Price Target: $5.55 from $5.35
Retained at positive at E&P; Price Target: $4.94 from $4.60
Retained at overweight at Morgan Stanley; Price Target: $5.20 from $5.00
Retained at buy at Ord Minnett; Price Target: $3.97 from $4.16
Dalrymple Bay Infrastructure (DBI)
Retained at buy at Citi; Price Target: $6.10
Retained at outperform at Macquarie; Price Target: $5.48 from $5.39
Electro Optic Systems Holdings (EOS)
Retained at speculative buy at Ord Minnett; Price Target: $11.15 from $11.40
Guzman Y Gomez (GYG)
Upgraded to outperform from sector perform at RBC Capital Markets; Price Target: $22.00 from $20.00
Insurance Australia Group (IAG)
Retained at outperform at Macquarie; Price Target: $9.00
James Hardie Industries Plc (JHX)
Retained at buy at Citi; Price Target: $36.50 from $38.00
Retained at outperform at Macquarie; Price Target: $39.60 from $41.10
Retained at overweight at Morgan Stanley; Price Target: $44.00
Retained at buy at Morgans; Price Target: $39.00 from $45.75
Jumbo Interactive (JIN)
Retained at outperform at Macquarie; Price Target: $10.50 from $14.10
LendLease Group (LLC)
Retained at hold at Ord Minnett; Price Target: $3.05 from $4.60
Midas Minerals (MM1)
Retained at speculative buy at Canaccord Genuity; Price Target: $1.50
Nick Scali (NCK)
Retained at neutral at Citi; Price Target: $14.15 from $19.20
Retained at outperform at Macquarie; Price Target: $15.30 from $21.60
Northern Star Resources (NST)
Retained at outperform at Macquarie; Price Target: $25.00
Santos (STO)
Retained at outperform at Macquarie; Price Target: $9.15
The Lottery Corporation (TLC)
Retained at outperform at Macquarie; Price Target: $5.80 from $5.70
Webjet Group (WJL)
Retained at overweight at Jarden; Price Target: $0.80 from $0.90
Retained at neutral at JPMorgan; Price Target: $0.50 from $0.90
Retained at hold at Morgans; Price Target: $0.41 from $0.61
Retained at outperform at RBC Capital Markets; Price Target: $0.80 from $1.00
Scans
Top Gainers
Code | Company | Last | % Chg |
|---|---|---|---|
| INV | Investsmart Group Ltd | $0.135 | +58.82% |
| AUA | Audeara Ltd | $0.04 | +42.86% |
| ADO | Anteotech Ltd | $0.017 | +30.77% |
| GLE | GLG Corp Ltd | $0.145 | +26.09% |
| MBK | Metal Bank Ltd | $0.015 | +25.00% |
Top Fallers
Code | Company | Last | % Chg |
|---|---|---|---|
| BEZ | Besra Gold Inc | $0.10 | -25.93% |
| HYD | HYDRIX Ltd | $0.014 | -22.22% |
| TNY | Tinybeans Group Ltd | $0.073 | -17.98% |
| CBY | Canterbury Resources Ltd | $0.043 | -17.31% |
| TSK | Tusker Minerals Ltd | $0.087 | -17.14% |
52 Week Highs
Code | Company | Last | % Chg |
|---|---|---|---|
| GLE | GLG Corp Ltd | $0.145 | +26.09% |
| AVR | Anteris Technologies Global Corp | $12.54 | +13.48% |
| WBT | Weebit Nano Ltd | $6.79 | +12.98% |
| BRE | Brazilian Rare EARTHS Ltd | $6.42 | +10.50% |
| TTX | Tetratherix Ltd | $6.75 | +9.76% |
52 Week Lows
Code | Company | Last | % Chg |
|---|---|---|---|
| MEX | Minerals Exploration Ltd | $0.07 | -13.58% |
| DME | Dome Gold Mines Ltd | $0.039 | -13.33% |
| MEL | Metgasco Ltd | $0.014 | -12.50% |
| GTI | Gratifii Ltd | $0.042 | -10.64% |
| RWL | Rubicon Water Ltd | $0.09 | -10.00% |
Near Highs
Code | Company | Last | % Chg |
|---|---|---|---|
| WVOL | iShares MSCI World Ex Aust Minimum Volatility ETF | $44.62 | +0.25% |
| EGH | Eureka Group Holdings Ltd | $0.585 | +0.86% |
| IAGPF | Insurance Australia Group Ltd | $105.35 | +0.00% |
| IHD | iShares S&P/ASX DIV Opportunities Esg Screened ETF | $17.29 | +1.65% |
| CNEW | Vaneck China New Economy ETF | $8.26 | +0.98% |
Relative Strength Index (RSI) Oversold
Code | Company | Last | % Chg |
|---|---|---|---|
| TWD | Tamawood Ltd | $2.54 | -5.22% |
| STK | Strickland Metals Ltd | $0.11 | +10.00% |
| TUA | Tuas Ltd | $2.31 | +4.05% |
| DGL | DGL Group Ltd | $0.335 | -2.90% |
| IRE | Iress Ltd | $5.67 | +0.18% |
