News | Market Wraps
Evening Wrap: ASX 200 slumps as spike in global bond yields triggers major reset for gold and mining stocks
The S&P/ASX 200 closed 125.5 points lower, down 1.45%.

Mentioned
The S&P/ASX 200 closed 125.5 points lower, down 1.45%.
The ASX 200 slumped as a global bond sell-off — driven by rising inflation fears from higher oil prices and Iran war deadlock — sent yields surging across multiple markets, hammering gold, real estate, and mining stocks. Rising energy stocks and resilient banks weren't enough to stem the bleeding at index level.
Be sure to click/scroll through for the usual reporting of the major sector and stock-specific moves, the broker responses to them, as well as all the key economic data in tonight's Evening Wrap. Also, I have detailed technical analysis on the Nasdaq Composite and the S&P/ASX 200 in today's ChartWatch.
Let's dive in!
Today in Review
Mon 18 May 26, 4:58pm (AEST)
Name | Value | % Chg |
|---|---|---|
Major Indices | ||
| ASX 200 | 8,505.3 | -1.45% |
| All Ords | 8,735.4 | -1.52% |
| Small Ords | 3,365.2 | -2.65% |
| All Tech | 2,774.6 | -0.30% |
| Emerging Companies | 2,991.2 | -3.03% |
Currency | ||
| AUD/USD | 0.7141 | -0.14% |
US Futures | ||
| S&P 500 | 7,380.25 | -0.70% |
| Dow Jones | 49,210.0 | -0.82% |
| Nasdaq | 29,014.75 | -0.74% |
Name | Value | % Chg |
|---|---|---|
Sector | ||
| Energy | 10,704.9 | +2.00% |
| Financials | 9,079.5 | -0.25% |
| Communication Services | 1,719.3 | -0.83% |
| Consumer Discretionary | 3,338.4 | -0.87% |
| Consumer Staples | 11,333.8 | -0.89% |
| Information Technology | 1,732.4 | -0.94% |
| Utilities | 10,035.0 | -1.30% |
| Health Care | 22,312.6 | -1.48% |
| Real Estate | 3,490.9 | -2.81% |
| Materials | 23,887.9 | -2.84% |
| Industrials | 7,856.8 | -4.02% |
Markets
%20intraday%20chart_18%20May.png)
ASX 200 Session Chart
The S&P/ASX 200 (XJO) finished 125.5 points lower at 8,505.3, 1.5% from its session high/low and just 0.06% from its low. In the broader-based S&P/ASX 300 (XKO) advancers lagged decliners by an absolutely pathetic 41 to 251.
Energy (XEJ) (+2.0%) was the session's clear outperformer as ICE Brent crude futures rose 1.5% to US$110.85/bbl in Asian trade, extending a 3.4% surge on Friday as the Iran conflict entered its 12th week with the Strait of Hormuz still at a standstill. globalCoal Newcastle coal futures also gained 2.1% to $138.85/t, supporting the sector's coal cohort.
Woodside Energy (WDS) (+2.9%), Beach Energy (BPT) (+2.7%), and Santos (STO) (+2.7%) led the oil and gas names. Coal stocks also advanced — New Hope Corp. (NHC) (+1.7%) and Whitehaven Coal (WHC) (+0.9%) were both firmer. Downstream names Ampol (ALD) (+1.5%) and Viva Energy (VEA) (+1.3%) also rose.
Financials (XFJ) (-0.3%) was the relative standout despite finishing slightly lower — with every other sector down materially, the banks' ability to hold near flat reflected continued investor rotation toward the safety of high, fully franked dividend payers following the budget's capital gains tax changes. Commonwealth Bank (CBA) (+0.8%), QBE Insurance (QBE) (+1.0%), NIB Holdings (NHF) (+0.9%), MyState (MYS) (+0.9%), Medibank Private (MPL) (+0.6%), and Bank of Queensland (BOQ) (+0.6%) were all firmer.
Industrials (XNJ) (-4.0%) was the worst sector, dominated entirely by the collapse in Brambles (BXB) (-20.2%) after the pallet group slashed its FY26 underlying profit growth guidance to 3–5% from 8–11% previously. ALS Limited (ALQ) (-1.7%) also weighed on the sector after a conservative FY27 outlook offset a slight beat on its $384 million profit.
The Gold Sub-Index (XGD) (-4.0%) was hammered by the global bond sell-off. When benchmark bond yields rise — as they did sharply Friday night, with the US 30-year reaching its highest level in nearly three years and Australia's 10-year hitting 5.11% — the opportunity cost of holding gold increases, since bonds now offer higher risk-free returns by comparison.
Gold producers face the additional squeeze of rising diesel input costs as oil prices surge simultaneously. COMEX gold futures fell a further 0.3% to US$4,545/oz in Asian trade after plunging 2.6% on Friday, while COMEX silver futures dropped 1.9% to US$76.10/oz after collapsing 9.1% on Friday. Pantoro Gold (PNR) (-6.6%), West African Resources (WAF) (-6.1%), Vault Minerals (VAU) (-5.6%), and Evolution Mining (EVN) (-4.6%) were all sharply lower.
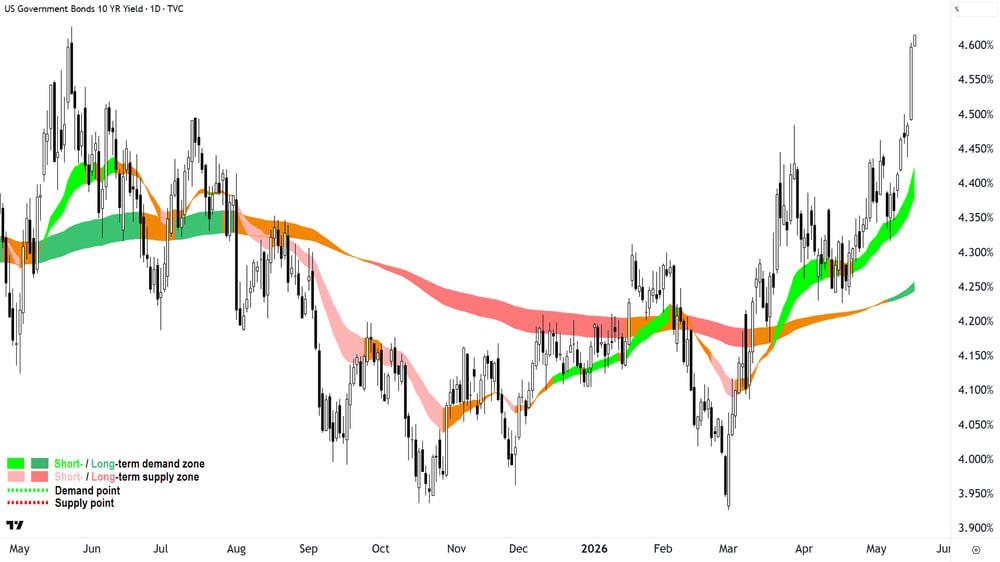
US 10-year T-Bond Yield chart 18 May 2026
Real Estate (XPJ) (-2.8%) and Utilities (XUJ) (-1.3%) were both casualties of the same bond yield surge — as bond-proxy sectors, their stable income streams become less attractive when risk-free returns rise. Goodman Group (GMG) (-4.0%), Stockland (SGP) (-3.5%), and Charter Hall (CHC) (-3.5%) bore the steepest real estate losses. APA Group (APA) (-2.7%) and AGL Energy (AGL) (-1.0%) were lower within Utilities.
Materials (XMJ) (-2.8%) were hit by a sharp reversal in base metals prices — a stronger US dollar, driven by higher US yields attracting global capital, made dollar-priced commodities more expensive for non-US buyers and compressed demand. LME aluminium fell 3.5%, copper 3.1%, and nickel 2.8% on Friday, with COMEX copper futures extending those losses a further 0.5% to US$6.265/lb in Asian trade. Rio Tinto (RIO) (-3.6%), BHP (BHP) (-2.8%), Sandfire Resources (SFR) (-4.2%), Capstone Copper (CSC) (-3.3%), Alcoa (AAI) (-3.3%), and Nickel Industries (NIC) (-2.4%) were all weaker.
Today's best gainers in the ASX 300
Company | Last Price | Change $ | Change % | 1mo % | 1yr % |
|---|---|---|---|---|---|
Lynas Rare Earths (LYC) | $18.93 | +$0.98 | +5.5% | -8.6% | +147.1% |
Elevra Lithium (ELV) | $11.54 | +$0.53 | +4.8% | +25.2% | +380.8% |
Service Stream (SSM) | $2.23 | +$0.09 | +4.2% | +12.1% | +17.1% |
Vulcan Steel (VSL) | $5.83 | +$0.21 | +3.7% | +12.5% | -20.2% |
Computershare (CPU) | $32.09 | +$1.02 | +3.3% | +4.2% | -22.3% |
OOH!Media (OML) | $1.390 | +$0.04 | +3.0% | +46.3% | -15.0% |
Healius (HLS) | $0.355 | +$0.01 | +2.9% | -34.3% | -66.7% |
Woodside Energy (WDS) | $32.15 | +$0.9 | +2.9% | -1.8% | +48.9% |
Pro Medicus (PME) | $125.52 | +$3.41 | +2.8% | -15.6% | -54.9% |
Beach Energy (BPT) | $1.135 | +$0.03 | +2.7% | -5.4% | -13.4% |
Santos (STO) | $8.09 | +$0.21 | +2.7% | +5.8% | +27.8% |
Stanmore Resources (SMR) | $2.36 | +$0.05 | +2.2% | +1.3% | +22.6% |
Bravura Solutions (BVS) | $2.26 | +$0.04 | +1.8% | +5.1% | +14.7% |
New Hope Corp. (NHC) | $5.32 | +$0.09 | +1.7% | +0.8% | +45.8% |
Immutep (IMM) | $0.061 | +$0.001 | +1.7% | -11.6% | -79.0% |
REA (REA) | $164.60 | +$2.59 | +1.6% | -5.8% | -34.8% |
Amplitude Energy (AEL) | $1.705 | +$0.025 | +1.5% | -2.3% | -14.9% |
Ampol (ALD) | $35.57 | +$0.52 | +1.5% | +8.0% | +34.7% |
McMillan Shakespeare (MMS) | $17.83 | +$0.24 | +1.4% | +13.4% | +12.6% |
Viva Energy (VEA) | $2.31 | +$0.03 | +1.3% | -8.7% | +23.2% |
Today's worst losers in the ASX 300
Company | Last Price | Change $ | Change % | 1mo % | 1yr % |
|---|---|---|---|---|---|
Tuas (TUA) | $2.27 | -$3.83 | -62.8% | -62.5% | -60.9% |
Elders (ELD) | $5.55 | -$1.65 | -22.9% | -26.1% | -14.9% |
Brambles (BXB) | $17.63 | -$4.47 | -20.2% | -21.3% | -18.8% |
Polynovo (PNV) | $1.060 | -$0.135 | -11.3% | +5.0% | -28.9% |
Clarity Pharmaceuticals (CU6) | $2.60 | -$0.3 | -10.3% | -16.9% | +19.3% |
Firefly Metals (FFM) | $1.910 | -$0.18 | -8.6% | -6.8% | +119.8% |
Turaco Gold (TCG) | $0.540 | -$0.05 | -8.5% | -13.6% | +35.0% |
Lotus Resources (LOT) | $0.620 | -$0.055 | -8.1% | -61.0% | -70.9% |
Catalyst Metals (CYL) | $5.46 | -$0.47 | -7.9% | -15.1% | -17.4% |
Meeka Metals (MEK) | $0.120 | -$0.01 | -7.7% | -22.6% | -4.0% |
L1 (L1G) | $1.100 | -$0.09 | -7.6% | +0.5% | +88.0% |
PMET Resources (PMT) | $0.660 | -$0.05 | -7.0% | 0% | +187.0% |
Pantoro Gold (PNR) | $3.11 | -$0.22 | -6.6% | -16.6% | -4.0% |
Alpha HPA (A4N) | $0.640 | -$0.045 | -6.6% | -4.5% | -37.3% |
Bapcor (BAP) | $0.370 | -$0.025 | -6.3% | -42.6% | -90.2% |
Eagers Automotive (APE) | $22.31 | -$1.5 | -6.3% | -5.7% | +30.0% |
Southern Cross Gold (SX2) | $10.32 | -$0.68 | -6.2% | -6.2% | +80.4% |
Chalice Mining (CHN) | $1.450 | -$0.095 | -6.1% | -12.4% | +34.3% |
West African Resources (WAF) | $3.07 | -$0.2 | -6.1% | -11.3% | +78.5% |
ChartWatch
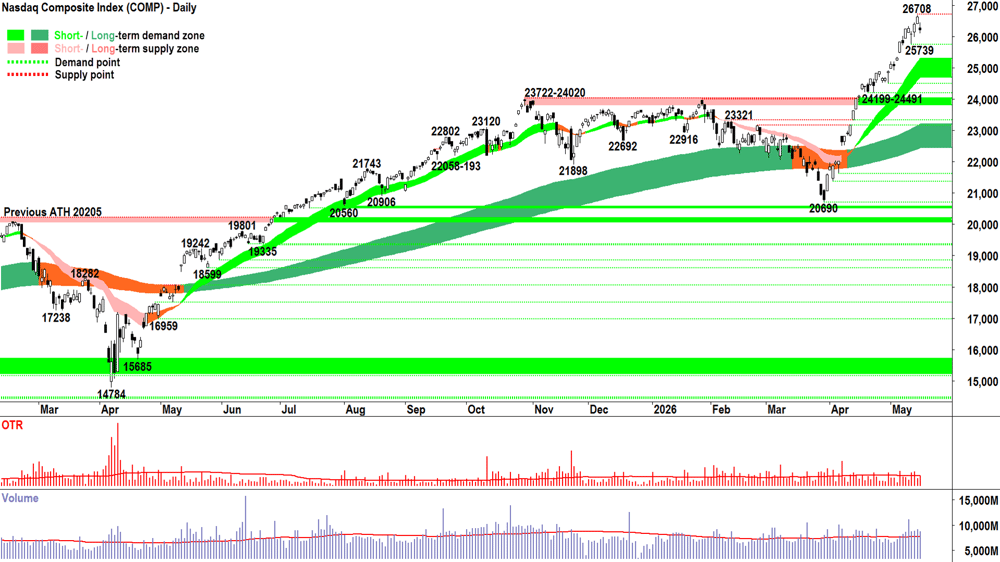
Nasdaq Composite Index
Analysis
We found supply. There it is, at 26708. 🎯 Now we must see how motivated the supply side is (consider: black body and/or upward pointing shadow longer length = more motivated; vs shorter length = less motivated) and how much ammunition they have (consider: larger volume = larger ammunition; lesser volume = lesser ammunition).
Likewise, we want to see how the demand side responds. White bodied candles are dead giveaways, as are in particular, the BTD showing downward pointing shadows. Again, the long the better. These types of candles will signal greater ongoing resolve in the face of the newly found supply...
Which party wins!? 🤔
The candles, price action and volume will tell all from here. They always do! 💪
View
Sure there's some supply on the Comp — but is it sufficient in terms of motivation and firepower to warrant amending my present FRP setting? Not yet. Next candle, next reassessment. Them's the rules! (RP = Risk Position — it reflects my personal allowable capital allocation limit for my investments in US stocks. So 1/2RP is 50%, 2/3RP is 67% and FRP is 100% 🪣).
Key levels
26708 is the key point of suppl. 25739 is the closest point of demand, then there's the short term uptrend ribbon (presently 24473-25052). If the price closes back below this range, the supply-side is very likely back in control of the Comp's price.
S&P/ASX 200 (XJO)
%20chart_18%20May.png)
Analysis
Imagine if you had 50% of your share-focussed capital in cash right now. It would be pretty handy, right? 🤔
Consider that my cash at call account is getting 4.75% p.a. (I prefer not to name the provider, but it starts with the letter 'M' — think 🍩!).
That's substantially more than the average dividend yield for the S&P/ASX 200 = not terrible at all!
The best bit about cash, is that its value can only be eroded by one thing — and its not President Trump's Shenanigans (i.e., PTS Syndrome! 😉).
It's inflation.
Aha! But alas, there's another existential threat to cash ownership: stock prices going up... i.e., missing out.
Being in cash isn't doing nothing.
I know, that's a double negative, so let me try: Being in cash is doing something. It's an active and conscious risk management decision.
'Cash is King' is just a dumb phrase bandied about by those who have insufficient respect for the ability of stock prices to rise in a such a way as to render cash an absolute pauper.
Cash is king when stock prices are falling — because the capital you hold in cash at this time is increasing in buying power. Cash is also handy if stock prices are stagnating and one can earn a higher return in cash than in stocks (i.e., like now!?).
The trick is to understand when cash is king and when cash is a pauper (consider: cash is a pauper when stocks are king! 👑)
We're told by the "experts" that there's no point trying to time the market. We're better off buying a "diversified" portfolio of stocks, like banks, resources, consumer, industrial, IT, healthcare, etc. etc.
But I must challenge: 🧐
Where has this diversification got you over the last 12 months? It's got you into WTC, CSL, JBH, etc. etc. i.e, it's forced you to hold a bunch of really terrible performers all the way down. 📉💥
The penalties of holding through a stagnant or falling market can also be severe
I accept most experts claim the second point because they don't believe mums and dads have the ability to move between cash and risk in a reliable manner. They're probably right. On the first item, though, I am certain the experts continue to believe that diversification — through thick and thin — remains the right approach.
I continue to respectfully disagree on both points. Diversification isn't safety when the big fund managers are rotating between sectors — causing some to soar while other crater. Often one sectors meteoric rise comes at the cratering sector's expense. Diversification only works when all stocks rise in unison — and that doesn't tend to be the norm here on the OTP!
On timing the market, if I've taught you anything in the short or long time you've been suffering acutely through my rantings here and in my webinars, it's this: Nobody can predict the future. There is no perfect approach for moving between cash an risk. But that doesn't mean one shouldn't seek and adopt an approach that achieves this goal MOTN.
Mine is just one model, that hopefully you agree, satisfies the MOTN criteria. I encourage you to investigate others and adopt the approach and belief system that suits you best.
But whatever you do, please refuse to believe that not managing risk — i.e., sitting on one's hands and hoping for the best — is a sensible approach!
Modern markets have rendered the BHP Technique obsolete! (i.e., Buy, Hold/Hope, Pray!!! 🙏)
View
I better do some technical Analysis here...
ST Trend = ⬇️ + price is below ST trend ribbon + ST trend ribbon acting as zone of dynamic demand ❌
LT Trend = ➡️ + price is below ST trend ribbon + ST trend ribbon acting as zone of dynamic demand ❌
Price action = 📉 ❌
Candles = ⬛ + ⬆️shadows ❌
❌❌❌❌ = 👎
Moving to 1/3RP 🪣 on the OTP (i.e., my personal allowable capital allocation limit for my investments in Australian stocks is 33%). Doesn't have to happen all at once = as needed basis versus individual charts in my portfolio. But I will be ruthless in pruning any dead wood to achieve my new RP limit! 🪓
Key levels
The short- and long-term downtrend ribbons (presently 8686-8750) combine to represent the key zone of supply. Beyond that, it's the not so lucky 8888 level! Demand is the 8262-8379 zone. Below that... 😱!
(Glossary of acronyms! Old Tin Pot (OTP): S&P/ASX 200 | MOTN: More Often Than Not | FOMO: Fear Of Missing Out | HOFU: Holding On For Upside | BTD: Buy The Dip | STR: Sell The Rally | RP: Risk Position)
ChartWatch *LIVE* Webinar
ChartWatch *LIVE* Webinars – WEEKLY Wednesday's @ 12pm AEDT
Learn more about technical analysis and trend following through real case studies on ASX stocks. Australia's premier technical analyst, Carl Capolingua, shares his unique insights on stocks as requested by viewers. Ask about a company in your portfolio or anything related to trading and investing and get Carl's expert opinion.
Places are limited so >REGISTER NOW!<
Economy
Today
CHN April 'Data Dump'
New Home Prices: -0.19% m/m vs +0.21% m/m previous (down, worse than expected ❌)
Fixed Asset Investment: -1.6% ytd/y actual vs +1.7% ytd/y forecast and +1.7% ytd/y in March (i.e., down, worse than expected ❌)
Industrial Production: +4.1% p.a. vs +6.0% p.a. forecast and +5.7% p.a. previous (down, worse than expected ❌)
Retail Sales: +0.2% p.a. vs +2.0% p.a. forecast and +1.7% p.a. previous (down, worse than expected ❌)
Unemployment Rate: 5.2% vs 5.3% forecast and 5.4% in March (down, better than expected ✅)
Later this week
Tuesday
08:30 Westpac Consumer Sentiment (-12.5% previous)
09:30 Monetary Policy Meeting Minutes
22:00 USA April Pending Home Sales (+1.2% m/m forecast vs +1.5% in March)
Wednesday
09:00 CHN Peoples Bank of China (PBOC) Official Interest Rates Decision
1-y Loan Prime Rate: no change at +3.0% p.a. forecast
5-y Loan Prime Rate: no change at +3.5% p.a. forecast
Thursday
02:00 US Federal Reserve May FOMC meeting minutes
AUS April Employment Data
Employment Change: +15,700 vs +17,900 in March
Unemployment Rate: unchanged at 4.3% forecast
21:45 USA Flash May Purchasing Managers Index (PMI)
Manufacturing: 53.6 forecast vs 54.5 in April
Services: 51.1 forecast vs 51.0 in April
Friday
No major economic data are scheduled for release this day
Latest News
Interesting Movers
Trading higher
+102.5% KTEK Aerosystems (KTK) - debuted on the ASX after an oversubscribed $10 million IPO; the defence-focused UAV technology company positions itself as a tier-2 supplier of composite airframes and electromechanical assemblies, operating an asset-light outsourced manufacturing model with design and quality assurance retained in-house.
+2.8% Pro Medicus (PME) - signed a seven-year, $90 million contract with US healthcare group Beth Israel Lahey Health to deploy its Visage 7 enterprise imaging platform, expected to contribute approximately $12.8 million in annualised revenue once live in the first quarter of calendar 2027.
+2.7% Santos (STO) - achieved first oil from the Pikka Phase 1 development on Alaska's North Slope.
Trading lower
-62.8% Tuas (TUA) - Singapore regulator IMDA suspended its review of the proposed Simba-M1 merger amid an investigation into possible unauthorised use of radio frequency bands, adding material uncertainty to a transaction already approaching its May 21 long-stop date.
-22.9% Elders (ELD) - first-half underlying EBIT of $77 million missed consensus by 13%, with a "surprising" increase in costs — particularly when adjusted for the Killara feedlot acquisition — overshadowing a 27% jump in gross profit; analysts also flagged higher leverage following the Delta acquisition and dry conditions across parts of the east coast.
-20.2% Brambles (BXB) - slashed FY26 underlying profit growth guidance to 3–5% from 8–11% previously, with Citi describing the update as a "surprise" driven by subcontractor turnover and labour shortages creating capacity constraints.
-4.2% Northern Minerals (NTU) - Treasurer Jim Chalmers ordered six investors to divest their shareholdings in the rare earths miner over concerns about Chinese influence over the taxpayer-backed critical minerals prospect, the second time FIRB has flagged concerns over the company.
-1.7% ALS Limited (ALQ) - a slight beat on its $384 million profit was offset by a conservative outlook for the new fiscal year.
Broker Moves
The a2 Milk Company (A2M)
Downgraded to sell from neutral at Citi; Price Target: $5.85 from $8.40
AGL Energy (AGL)
Downgraded to hold from buy at Ord Minnett; Price Target: $11.75 from $13.25
ALS (ALQ)
Retained at buy at UBS; Price Target: $26.00
Autosports Group (ASG)
Retained at outperform at Macquarie; Price Target: $3.25 from $5.19
Abacus Storage King (ASK)
Retained at neutral at Citi; Price Target: $1.60
AVITA Medical, Inc. (AVH)
Retained at hold at Bell Potter; Price Target: $1.20
Retained at speculative buy at Morgans; Price Target: $1.35
Bapcor (BAP)
Retained at hold at Canaccord Genuity; Price Target: $0.45 from $0.87
Retained at underweight at Morgan Stanley; Price Target: $0.25
Retained at trim at Morgans; Price Target: $0.41 from $0.61
Brambles (BXB)
Retained at buy at Citi; Price Target: $27.55
Retained at neutral at Macquarie; Price Target: $23.15
Civmec (CVL)
Retained at buy at Bell Potter; Price Target: $1.90
Elders (ELD)
Retained at buy at Citi; Price Target: $8.45
Retained at outperform at Macquarie; Price Target: $8.50
Retained at neutral at UBS; Price Target: $7.30
Electro Optic Systems Holdings (EOS)
Retained at speculative buy at Ord Minnett; Price Target: $14.00 from $12.95
Iluka Resources (ILU)
Upgraded to buy from hold at Ord Minnett; Price Target: $9.00 from $8.00
Mirvac Group (MGR)
Retained at equal-weight at Morgan Stanley; Price Target: $2.05 from $2.10
Metals X (MLX)
Retained at buy at Ord Minnett; Price Target: $2.00 from $1.60
MyState (MYS)
Retained at buy at Ord Minnett; Price Target: $5.29
Origin Energy (ORG)
Downgraded to lighten from hold at Ord Minnett; Price Target: $10.40 from $11.00
QBE Insurance Group (QBE)
Retained at outperform at Macquarie; Price Target: $24.60
Regis Resources (RRL)
Retained at outperform at Macquarie; Price Target: $9.50
Stockland (SGP)
Retained at equal-weight at Morgan Stanley; Price Target: $4.90 from $5.05
SHAPE Australia Corporation (SHA)
Initiated at accumulate at Morgans; Price Target: $8.62
Saluda Medical, Inc. (SLD)
Retained at speculative buy at Bell Potter; Price Target: $2.00
SPC Global Holdings (SPG)
Downgraded to hold from buy at Ord Minnett; Price Target: $0.17 from $0.75
Technology One (TNE)
Retained at buy at Bell Potter; Price Target: $32.25 from $31.75
Torque Metals (TOR)
Retained at speculative buy at Canaccord Genuity; Price Target: $0.55
Temple & Webster Group (TPW)
Retained at overweight at Morgan Stanley; Price Target: $8.00
Tuas (TUA)
Retained at buy at Citi; Price Target: $9.95
Treasury Wine Estates (TWE)
Retained at neutral at Citi; Price Target: $4.25
Vault Minerals (VAU)
Retained at outperform at Macquarie; Price Target: $7.70
Vicinity Centres (VCX)
Retained at neutral at Citi; Price Target: $2.70
Retained at hold at Ord Minnett; Price Target: $2.50
Woodside Energy Group (WDS)
Retained at neutral at Macquarie; Price Target: $33.00
Xero (XRO)
Retained at buy at Citi; Price Target: $113.60
Scans
Top Gainers
Code | Company | Last | % Chg |
|---|---|---|---|
| KTK | Ktek Aerosystems Ltd | $0.405 | +102.50% |
| RR1 | Reach Resources Ltd | $0.013 | +30.00% |
| VHL | Vitasora Health Ltd | $0.014 | +27.27% |
| ASV | Asset Vision Co Ltd | $0.033 | +26.92% |
| BBL | Brisbane Broncos Ltd | $1.71 | +23.47% |
Top Fallers
Code | Company | Last | % Chg |
|---|---|---|---|
| TUA | Tuas Ltd | $2.27 | -62.79% |
| ARD | Argent Minerals Ltd | $0.03 | -28.57% |
| ATV | Activeport Group Ltd | $0.015 | -25.00% |
| FUL | Fulcrum Lithium Ltd | $0.10 | -23.08% |
| ELD | Elders Ltd | $5.55 | -22.92% |
52 Week Highs
Code | Company | Last | % Chg |
|---|---|---|---|
| KTK | Ktek Aerosystems Ltd | $0.405 | +102.50% |
| AA2 | Ariana Resources Plc | $0.435 | +22.54% |
| PEB | Pacific Edge Ltd | $0.235 | +11.91% |
| PE1 | Pengana Private Equity Trust | $1.87 | +6.86% |
| BBFD | Betashares Geared Short US TR Bond CH Complex ETF | $20.84 | +3.53% |
52 Week Lows
Code | Company | Last | % Chg |
|---|---|---|---|
| TUA | Tuas Ltd | $2.27 | -62.79% |
| ELD | Elders Ltd | $5.55 | -22.92% |
| TGH | Terragen Holdings Ltd | $0.014 | -22.22% |
| BXB | Brambles Ltd | $17.63 | -20.23% |
| UM1 | Unity Metals Ltd | $0.105 | -19.23% |
Near Highs
Code | Company | Last | % Chg |
|---|---|---|---|
| CNEW | Vaneck China New Economy ETF | $8.24 | -0.24% |
| KOV | Korvest Ltd | $16.29 | -1.63% |
| GXAI | Global X Artificial Intelligence ETF | $16.40 | +0.18% |
| HGBL | Betashares Global Shares Currency Hedged ETF | $82.38 | -1.18% |
| MQGPG | Macquarie Group Ltd | $103.63 | +0.13% |
Relative Strength Index (RSI) Oversold
Code | Company | Last | % Chg |
|---|---|---|---|
| STK | Strickland Metals Ltd | $0.11 | -18.52% |
| TUA | Tuas Ltd | $2.27 | -62.79% |
| IUSG | iShares U.S. Treasury Bond (Aud Hedged) ETF | $98.60 | -0.66% |
| DGL | DGL Group Ltd | $0.37 | 0.00% |
| IRE | Iress Ltd | $5.70 | -2.40% |
