News | Market Wraps
Evening Wrap: ASX 200 down on big hit to mining stocks, BHP and RIO suffer as copper price tumbles
The S&P/ASX 200 closed 9.9 points lower, down 0.12%.

Mentioned
The S&P/ASX 200 closed 9.9 points lower, down 0.12%.
The ASX 200 dipped as profit-taking hit miners after the price of copper pulled back and as the gold price slumped on renewed US inflation concerns. Technology and financials recovered recent lost ground to make up for the weakness in their mining counterparts.
Be sure to click/scroll through for the usual reporting of the major sector and stock-specific moves, the broker responses to them, as well as all the key economic data in tonight's Evening Wrap. Also, I have detailed technical analysis on the Nasdaq Composite and the S&P/ASX 200 in today's ChartWatch.
Let's dive in!
Today in Review
Fri 15 May 26, 4:55pm (AEST)
Name | Value | % Chg |
|---|---|---|
Major Indices | ||
| ASX 200 | 8,630.8 | -0.12% |
| All Ords | 8,870.6 | -0.16% |
| Small Ords | 3,457.0 | -0.27% |
| All Tech | 2,782.8 | +2.25% |
| Emerging Companies | 3,084.8 | -1.92% |
Currency | ||
| AUD/USD | 0.7164 | -0.78% |
US Futures | ||
| S&P 500 | 7,479.25 | -0.61% |
| Dow Jones | 49,982.0 | -0.34% |
| Nasdaq | 29,378.5 | -1.04% |
Name | Value | % Chg |
|---|---|---|
Sector | ||
| Information Technology | 1,748.8 | +3.20% |
| Energy | 10,495.5 | +2.18% |
| Communication Services | 1,733.6 | +1.01% |
| Financials | 9,102.6 | +1.00% |
| Industrials | 8,185.6 | +0.97% |
| Consumer Staples | 11,435.3 | +0.82% |
| Health Care | 22,648.5 | +0.76% |
| Real Estate | 3,591.8 | +0.40% |
| Consumer Discretionary | 3,367.7 | +0.30% |
| Utilities | 10,167.1 | -1.43% |
| Materials | 24,584.9 | -2.85% |
Markets
%20intraday%20chart_15%20May.png)
ASX 200 Session Chart
The S&P/ASX 200 (XJO) finished 9.9 points lower at 8,630.8, 0.71% from its session high and just 0.24% from its low. Despite the dip in the benchmark, in the broader-based S&P/ASX 300 (XKO) advancers edged out decliners by 177 to 112. For the week, the XJO finished down 114 points or 1.3% lower, 1.3% from its intraweek high and 0.5% from its intraweek low.
It was opposite day today. You know how mining stocks have been powering higher and bank and tech stocks have been sagging? (So the net result for the S&P/ASX 200, aka The Old Tin Pot is give-or-take flat!)
Well, today bank and tech stocks powered higher and mining stocks sagged. Net result? You guessed it — the OTP was give-or-take flat! 🤦
So, why the 180 degree reversal? Well, that's not blatantly clear... There wasn't any major news among the big miners. Certainly, though, base metals prices were generally lower overnight on the London Metals Exchange (aluminium +1.0%, copper -0.8%, nickel -0.6%) — but hardly dramatically so.
Something that is worth noting here is copper prices are down a decent whack in Asian trade, with benchmark COMEX high-grade copper futures 3.2% lower at the time of writing. Benchmark iron ore futures are 1.1% lower. There's also that...
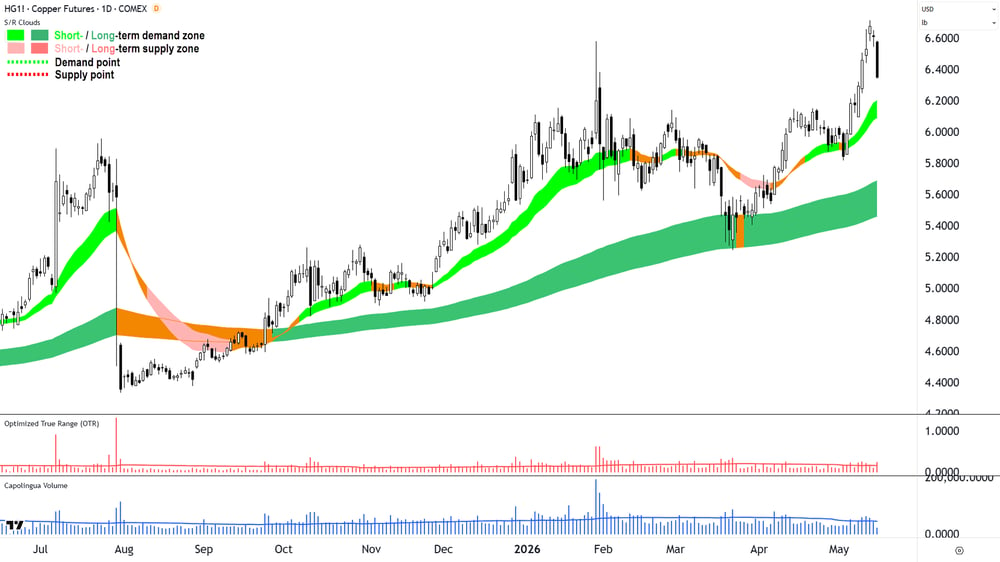
COMEX High-Grade Copper Futures benchmark contract chart
And gold futures are 1.6% lower, with silver futures tumbling a rather nasty 4.7%. So there's also that also...
But I suggest it's a little more than just commodity price moves. We all know President Trump is in China, and there's been some headlines about strained relations and slow going on trade breakthroughs. Chinese stocks fell sharply yesterday and got off to a rocky start this morning before steading by this update. China remains the primary destination for our minerals and the strong rise in its share market over the last week has no doubt help power our Materials (XMJ) (-2.8%) sector.
%20chart%2015,%20May%202026.png)
Shanghai Composite Index (SSEC) chart 15
Then there's the proper scary move in the bond market. Bond prices tanked overnight, as both demand and supply factors for US Treasuries created a perfect negative storm for these critical risk-free assets.
US risk-frees set the price of money, and the price of money sets the price of all other assets. If the yields on risk-free assets are rising, that's usually bad news for risky assets like stocks — particularly long duration, high P/E stocks and bond proxies (bond proxies produce short duration, bond-like returns... e.g., Real Estate (XPJ) (-2.2%) and Utilities (-1.4%), and many Financials (XFJ) (+1.0%) like our big banks, to some degree...)
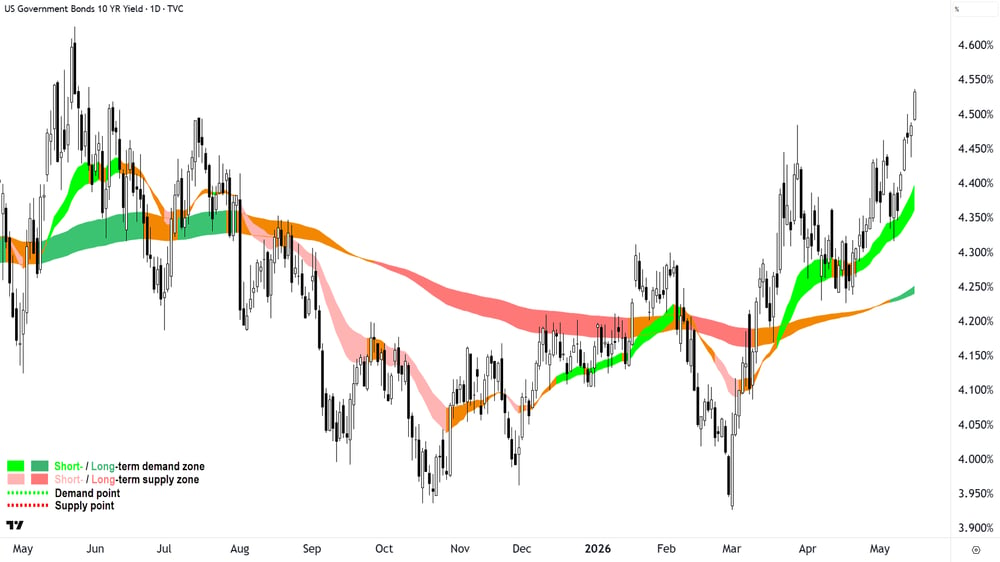
US 10-Year Government Bond Yields chart
On the demand side, a poorly patronised US 30-year bond auction showed appetite for US IOU's are waning. On the supply side, interest rate hike expectations spiked this week on the back of a blowout in wholesale inflation data and strong retail sales. Together, these items compounded to send the yield on US 10-year T-Bonds to over 4.5%, and the 30's yield to over 5%.
One might automatically say: well it didn't hurt tech stocks in the US or here, Carl, so what's your point? And I would say, "Yep, you got me on that one!" 🤷
But, higher market yields are rarely good for global economic growth. It strangles growth-generating borrowing and ratchets up the hurdle rate for investment (because new investments are compared to the higher return for doing risk-free nothing!).
So my point (yes there is one!), is that when you put together commodities price moves, the reversal in Chinese stocks, and bond yields... There's reasonable evidence to support a weaker mining sector thesis today.
Certainly, for gold, its blatantly obvious: gold doesn't have a yield... indeed one must engage the services of someone who is both surly and burly to sit on one's pile of gold with a shotgun to take care of it. Bottom line, owning gold entails an opportunity cost — and that opportunity cost rises as the return from doing risk-free nothing rises. It's why gold, silver, and the Gold Sub-Index (XGD) (-3.6%) got belted today.
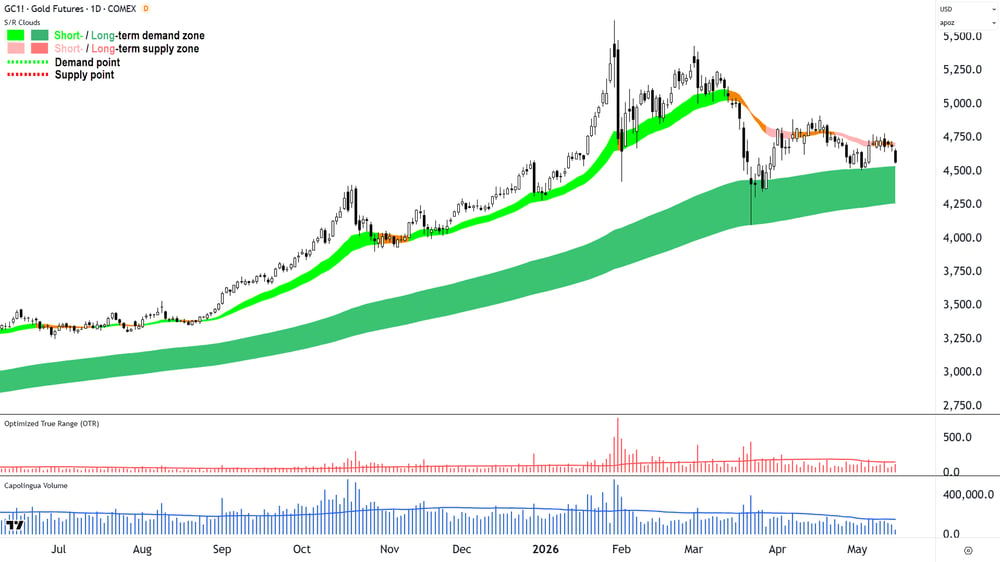
COMEX Gold Futures benchmark contract chart
As for why Information Technology (XIJ) (+3.2%) and banks went up today... Well we've established for tech: It officially beats me! Perhaps aping strength in the Comp... probably Xero (XRO)-centric (+8.1%).
And for banks — well you know — mining stocks were down. If you're a big fund manager, what else are you going to buy with the cash you raised from taking some profits on your mining stocks? This is the Old Tin Pot remember! 🤦
Today's best gainers in the ASX 300
Company | Last Price | Change $ | Change % | 1mo % | 1yr % |
|---|---|---|---|---|---|
Weebit Nano (WBT) | $6.80 | +$0.72 | +11.8% | +68.3% | +274.7% |
4DMEDICAL (4DX) | $4.17 | +$0.34 | +8.9% | -34.8% | +1313.6% |
Xero (XRO) | $79.67 | +$5.99 | +8.1% | -2.7% | -56.2% |
Tyro Payments (TYR) | $0.745 | +$0.055 | +8.0% | -5.1% | -17.2% |
Immutep (IMM) | $0.060 | +$0.004 | +7.1% | -20.0% | -79.3% |
Gentrack (GTK) | $3.49 | +$0.23 | +7.1% | -30.2% | -68.7% |
EVT (EVT) | $11.99 | +$0.65 | +5.7% | -11.3% | -21.4% |
Tuas (TUA) | $6.10 | +$0.31 | +5.4% | +0.7% | +9.5% |
Fletcher Building (FBU) | $2.48 | +$0.11 | +4.6% | +2.5% | -20.3% |
Australian Ethical (AEF) | $4.10 | +$0.18 | +4.6% | -18.3% | -32.2% |
IDP Education (IEL) | $2.76 | +$0.12 | +4.5% | -27.2% | -70.4% |
Fleetpartners (FPR) | $2.83 | +$0.12 | +4.4% | +16.0% | -5.0% |
Service Stream (SSM) | $2.14 | +$0.09 | +4.4% | +9.2% | +12.3% |
Elsight (ELS) | $6.25 | +$0.26 | +4.3% | -8.1% | +1046.8% |
Yancoal Australia (YAL) | $6.71 | +$0.27 | +4.2% | -3.0% | +30.5% |
Electro Optic Systems (EOS) | $8.82 | +$0.35 | +4.1% | -17.6% | +600.0% |
Nanosonics (NAN) | $3.47 | +$0.13 | +3.9% | -1.4% | -27.6% |
New Hope Corp. (NHC) | $5.23 | +$0.19 | +3.8% | -4.6% | +33.1% |
Wisetech Global (WTC) | $38.01 | +$1.34 | +3.7% | -15.3% | -62.6% |
Viva Energy (VEA) | $2.28 | +$0.08 | +3.6% | -14.0% | +20.3% |
Today's worst losers in the ASX 300
Company | Last Price | Change $ | Change % | 1mo % | 1yr % |
|---|---|---|---|---|---|
Kingsgate Consolidated (KCN) | $6.11 | -$0.71 | -10.4% | +4.4% | +214.9% |
PMET Resources (PMT) | $0.710 | -$0.08 | -10.1% | +19.3% | +184.0% |
Iperionx (IPX) | $5.21 | -$0.52 | -9.1% | +11.8% | +52.8% |
Elevra Lithium (ELV) | $11.01 | -$1.06 | -8.8% | +22.9% | +358.8% |
Minerals 260 (MI6) | $0.835 | -$0.075 | -8.2% | +5.0% | +542.3% |
Mineral Resources (MIN) | $64.77 | -$5.39 | -7.7% | +9.2% | +145.3% |
Predictive Discovery (PDI) | $0.930 | -$0.075 | -7.5% | +1.1% | +144.7% |
Metals X (MLX) | $1.540 | -$0.12 | -7.2% | +4.8% | +185.2% |
Healius (HLS) | $0.345 | -$0.025 | -6.8% | -37.3% | -68.1% |
WA1 Resources (WA1) | $15.15 | -$1.02 | -6.3% | +2.8% | +21.6% |
Redox (RDX) | $3.03 | -$0.2 | -6.2% | -9.6% | 0% |
Liontown (LTR) | $2.35 | -$0.15 | -6.0% | +13.5% | +197.5% |
Arafura Rare Earths (ARU) | $0.315 | -$0.02 | -6.0% | -1.6% | +85.3% |
Bapcor (BAP) | $0.395 | -$0.025 | -6.0% | -39.7% | -89.1% |
Resolute Mining (RSG) | $1.315 | -$0.083 | -5.9% | -8.0% | +126.7% |
DPM Metals (DPM) | $46.28 | -$2.85 | -5.8% | -14.3% | 0% |
PLS Group (PLS) | $6.01 | -$0.37 | -5.8% | +5.3% | +285.3% |
Lotus Resources (LOT) | $0.675 | -$0.04 | -5.6% | -56.0% | -68.3% |
Evolution Mining (EVN) | $12.50 | -$0.73 | -5.5% | -9.7% | +58.8% |
ChartWatch
Nasdaq Composite Index
Analysis
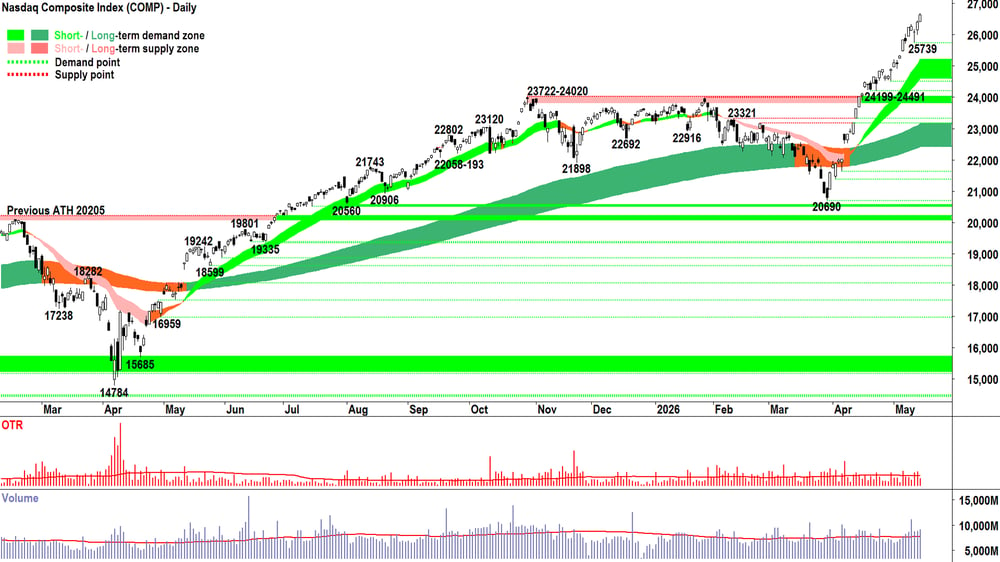
Really not a great deal to add here. Thursday’s candle is exactly what we would have expected from the candles, price action and trends that preceded it.
This is trend following at its finest. 💪
Volume remains modestly above average — there’s a decent whack of engagement from both the demand and supply sides here.
The above average volume of buyers on Wednesday were clearly motivated (white bodied candle with close near session’s high, good progress from Tuesday’s close). FOMO? Hey, it wasn’t crazy, but its still there, bubbling away and supporting this amazing rally. ✅
The above average volume of sellers were clearly less motivated… Happy to step back, and back, in the expectation they’d get better prices by waiting. HOFU? Yes, I would say so. ✅
Importantly, Tuesday’s dip was viewed as a buying opportunity and not the start of something bigger. BTD? Definitely. ✅
The only word of caution, at is very mild at this stage — something that I'm alert about but am far from alarmed about — is the above average volume occurring here: after a massive run.
Volume is buying and selling. Above average volume into new highs, as an already fantastic uptrend extends speaks of continued high interest among the demand side, but also willing engagement by the supply side.
That in itself suggests less than a perfect consensus in the demand supply environment. I.e., that those with cash should be in stocks and those already in stocks should remain there.
Monitoring it. 🧐 No change to my risk settings!*
(*No, you are not crazy, and yes you are in Friday's — not Thursday's — Evening Wrap! I copied and pasted the above text from yesterday's Comp analysis. Please tell me, given the new candle: what different I should have written here!? To quote some guy who was boinked on the head by an apple: This object is in motion. It will remain in motion — both in terms of its speed and direction — indefinitely unless a force acts upon it. That force is supply = black-bodied candles and or upward pointing shadows... And we ain't seeing any of those yet!!! 📈)
22 April Candle = FRP:
Accept = I have no idea what's going to happen next. 🤷 Simply, the evidence supports my view the Comp's price should rise MOTN. In light of this: there are no impediments to my moving to FRP.
14 April Candle = 2/3RP:
I have no choice but to respect the prevailing strong demand-side price action and take steps to increase my RP back towards FRP — hence my decision to officially move from 1/2RP to 2/3RP from tonight.
8 April Candle = 1/2RP:
Act = Clearly running at a 1/3RP portfolio risk limit is too conservative given the shifting odds, but going “all in” here is also probably substantially premature. Given the balanced nature of the technicals a balanced portfolio risk approach is best, which for me means 1/2RP. ⚖️
Those are the three candles that triggered my +R actions from the 1/3RP setting I was running during the Middle East conflict correction. Note each accompanying commentary.
Where's the:
I know what's going to happen next... !
This rally is stupid it will end in tears!
But what about the risks!?
But what about the valuations!?
This can't possibly go on...
It's the most expensive / crazy / overbought / speculative etc. market since 2007, 2000, 1987, 1929...
My long suffering ChartWatch readers: I used to think like that. A long time ago. Now, I understand that it doesn't make a lick of difference what I think about the market: Zero. Zip. Zilch. Nothing. Nada. Nix. Bupkis.
I predict nothing. Yet, more often than not, it seems I am right!
Trend following is a state of mind. Interestingly, despite you and I knowing its the best way — it is not the norm. People will always want to believe that they're smarter than the market! 🤦
View
FRP (RP = Risk Position — it reflects my personal allowable capital allocation limit for my investments in US stocks. So 1/2RP is 50%, 2/3RP is 67% and FRP is 100% 🪣). I don't know what's going to happen next, only that right now, the chart above remains a picture of excess demand.
Key levels
There are no key supply zones to contend with. The old all-time high supply zone of 23722-24020 will likely act as a short term zone of demand, however the short-term trend ribbon (presently 24473-25052) is now the key zone of demand. If the price closes back below this range, the supply-side is very likely back in control of the Comp's price.
S&P/ASX 200 (XJO)
%20chart_15%20May.png)
Analysis
As pathetically innocuous as today's candle probably will turn out to be — it does mark the first upward pointing shadow of note in the last six candles.
Hey, it is a very small candle = a very small signal. Little motivation shown from either the demand or supply sides.
Unfortunately, it's that kind of market at the moment — and as you've probably gathered from my recent commentaries — I have little motivation to even look at this chart!
What a pathetic state of affairs for trend followers!
But, with today's candle potentially showing that the long term trend ribbon is beginning to behave as a nagging zone of supply, and with the short term trend down, and with some rather supply side dominated price action (i.e., falling peaks and falling troughs) and candles (i.e., black-bodied and today's upward pointing shadow), then one could be forgiven for concluding the supply side is indeed in control of the OTP's price. ⚠️
View
I remain 1/2RP 🪣 on the OTP (i.e., my personal allowable capital allocation limit for my investments in Australian stocks is 50%).
Key levels
9022 is the key point of supply. Beyond that, it's the 9201, the all time high. The OTP is below the long-term downtrend ribbon (presently 8688-8754) — definitely not a good look! A close below 8590-8621 could trigger a retracement back to the 8262-8379 lows.
(Glossary of acronyms! Old Tin Pot (OTP): S&P/ASX 200 | MOTN: More Often Than Not | FOMO: Fear Of Missing Out | HOFU: Holding On For Upside | BTD: Buy The Dip | STR: Sell The Rally | RP: Risk Position)
ChartWatch *LIVE* Webinar
ChartWatch *LIVE* Webinars – WEEKLY Wednesday's @ 12pm AEDT
Learn more about technical analysis and trend following through real case studies on ASX stocks. Australia's premier technical analyst, Carl Capolingua, shares his unique insights on stocks as requested by viewers. Ask about a company in your portfolio or anything related to trading and investing and get Carl's expert opinion.
Places are limited so >REGISTER NOW!<
Economy
Today
There weren't any major economic data releases in our time zone today
Later this week
Friday
21:15 USA April Capacity Utilization Rate (75.8% forecast vs 75.7% in March)
21:15 USA April Industrial Production (+0.2% m/m forecast vs -0.5% m/m in March)
Latest News
Interesting Movers
Trading higher
+11.8% Weebit Nano (WBT) - completed a Share Purchase Plan raising approximately $15 million from existing shareholders, bringing total funds raised to approximately $102 million inclusive of a recently completed $87 million institutional placement, with proceeds earmarked to accelerate commercialisation of its ReRAM technology and fast-track AI-related offerings.
+4.1% Electro Optic Systems (EOS) - updated the terms of its MARSS acquisition, increasing the maximum earn-out cap to €140 million from €100 million to reflect strong recent order flow; MARSS secured €102 million in new orders this month from an existing Middle East customer, lifting its total order book to €135 million.
+2.2% Ventia Services Group (VNT) - renewed its maintenance services contract with Yarra Valley Water in a $405 million, nine-year deal covering sewerage, water network reactive maintenance and mechanical and electrical services across the south region, commencing October 2026.
+1.9% Treasury Wine Estates (TWE) - French billionaire Olivier Goudet lifted his stake in the company from 8.14% to 9.04%, spending approximately $31 million via on-market purchases through his investment vehicle Platin.
+1.6% Vicinity Centres (VCX) - agreed to acquire the Eastern Creek Quarter retail precinct in western Sydney from Frasers Property for $400 million, with settlement set for June 30.
Trading lower
-7.7% Mineral Resources (MIN) - managing director Chris Ellison sold 1.75 million shares worth $122.5 million in his first on-market disposal since December 2017, with the company stating the sale was undertaken for personal financial planning purposes including the establishment of a family office.
-6.0% Bapcor (BAP) - Citi downgraded to Sell and slashed earnings forecasts by as much as 83%, warning the turnaround is being undermined by weakening consumer demand, mounting cost pressures, and a balance sheet still reliant on temporarily relaxed banking covenants through calendar 2026.
-3.0% GrainCorp (GNC) - CLSA downgraded to Underperform from Outperform with a price target cut to $4.50 from $8.40, and Morgans downgraded to Hold from Accumulate with a target cut to $5.62 from $6.76, both following yesterday's first-half profit result.
Broker Moves
Atlantic Lithium (A11)
Retained at neutral at Macquarie; Price Target: $0.32
Atlas Arteria (ALX)
Retained at neutral at Citi; Price Target: $4.80
AUB Group (AUB)
Retained at outperform at Macquarie; Price Target: $35.81
Accent Group (AX1)
Retained at neutral at Citi; Price Target: $0.60 from $0.57
Retained at buy at Morgans; Price Target: $0.75
Bapcor (BAP)
Downgraded to sell from neutral at Citi; Price Target: $0.40 from $0.76
Retained at neutral at Macquarie; Price Target: $0.44 from $0.61
Retained at hold at Ord Minnett; Price Target: $0.55 from $0.75
BlinkLab (BB1)
Initiated at speculative buy at Morgans; Price Target: $1.76
BHP Group (BHP)
Retained at overweight at Morgan Stanley; Price Target: $67.50 from $57.50
Catapult Sports (CAT)
Retained at buy at Bell Potter; Price Target: $4.50 from $4.75
COG Financial Services (COG)
Retained at buy at Shaw and Partners; Price Target: $2.45
Coles Group (COL)
Retained at accumulate at Ord Minnett; Price Target: $23.00
Endeavour Group (EDV)
Retained at lighten at Ord Minnett; Price Target: $2.90
Flight Centre Travel Group (FLT)
Retained at outperform at Macquarie; Price Target: $15.54 from $17.95
Global Lithium Resources (GL1)
Retained at outperform at Macquarie; Price Target: $0.80
Graincorp (GNC)
Retained at hold at Bell Potter; Price Target: $5.90 from $6.80
Downgraded to underperform from outperform at CLSA; Price Target: $4.50 from $8.40
Retained at neutral at Macquarie; Price Target: $5.90 from $6.75
Downgraded to hold from accumulate at Morgans; Price Target: $5.62 from $6.76
Retained at accumulate at Ord Minnett; Price Target: $7.25
GWA Group (GWA)
Retained at neutral at Macquarie; Price Target: $2.15
IGO (IGO)
Retained at outperform at Macquarie; Price Target: $9.50
Imugene (IMU)
Retained at speculative buy at Bell Potter; Price Target: $0.25
James Hardie Industries Plc (JHX)
Retained at outperform at Macquarie; Price Target: $41.10
Liontown (LTR)
Retained at neutral at Macquarie; Price Target: $2.20
Minerals 260 (MI6)
Retained at speculative buy at Bell Potter; Price Target: $1.35
Megaport (MP1)
Retained at positive at E&P; Price Target: $25.08 from $23.58
Retained at buy at Jefferies; Price Target: $18.40 from $16.30
Retained at overweight at JPMorgan; Price Target: $16.00 from $14.00
Retained at outperform at Macquarie; Price Target: $26.30 from $23.30
Retained at equal-weight at Morgan Stanley; Price Target: $12.50 from $9.00
Retained at accumulate at Ord Minnett; Price Target: $14.50 from $12.00
Oohmedia (OML)
Retained at overweight at Morgan Stanley; Price Target: $1.55
PLS Group (PLS)
Retained at outperform at Macquarie; Price Target: $6.20
PMET Resources Inc (PMT)
Retained at outperform at Macquarie; Price Target: $0.65
REA Group (REA)
Retained at neutral at Macquarie; Price Target: $190.00
Reece (REH)
Retained at neutral at Macquarie; Price Target: $14.90
Reliance Worldwide Corporation (RWC)
Retained at outperform at Macquarie; Price Target: $4.50
SGH (SGH)
Retained at outperform at Macquarie; Price Target: $50.40
Sunstone Metals (STM)
Retained at buy at Shaw and Partners; Price Target: $2.10
Treasury Wine Estates (TWE)
Upgraded to buy from hold at Morgans; Price Target: $5.30
WA1 Resources (WA1)
Retained at speculative buy at Bell Potter; Price Target: $24.80
Worley (WOR)
Retained at buy at Citi; Price Target: $13.60 from $14.00
Retained at outperform at Macquarie; Price Target: $13.70
Retained at hold at Morgans; Price Target: $11.80 from $11.60
Retained at accumulate at Ord Minnett; Price Target: $13.10
Wisr (WZR)
Retained at buy at Shaw and Partners; Price Target: $0.07
Xero (XRO)
Retained at outperform at CLSA; Price Target: $170.00
Retained at hold at Jefferies; Price Target: $77.00 from $84.80
Retained at overweight at JPMorgan; Price Target: $150.00
Retained at outperform at Macquarie; Price Target: $235.80 from $223.60
Retained at overweight at Morgan Stanley; Price Target: $130.00
Retained at buy at Morgans; Price Target: $111.00
Retained at buy at Ord Minnett; Price Target: $110.00 from $150.00
Retained at outperform at RBC Capital Markets; Price Target: $130.00 from $155.00
Scans
Top Gainers
Code | Company | Last | % Chg |
|---|---|---|---|
| EXL | Elixinol Wellness Ltd | $0.015 | +114.29% |
| PEB | Pacific Edge Ltd | $0.21 | +44.83% |
| ARD | Argent Minerals Ltd | $0.042 | +31.25% |
| ACM | Australian Critical Minerals Ltd | $0.055 | +27.91% |
| LMS | Litchfield Minerals Ltd | $0.575 | +26.37% |
Top Fallers
Code | Company | Last | % Chg |
|---|---|---|---|
| VTA | Vita Resources NL | $0.032 | -20.00% |
| SPG | SPC Global Holdings Ltd | $0.115 | -17.86% |
| AI1 | Adisyn Ltd | $0.22 | -15.39% |
| SLB | Stelar Metals Ltd | $0.115 | -14.82% |
| EMA | Eminence Minerals Ltd | $0.056 | -13.85% |
52 Week Highs
Code | Company | Last | % Chg |
|---|---|---|---|
| PEB | Pacific Edge Ltd | $0.21 | +44.83% |
| RMI | Resource Minerals International Ltd | $0.069 | +15.00% |
| WBT | Weebit Nano Ltd | $6.80 | +11.84% |
| AVR | Anteris Technologies Global Corp | $9.95 | +11.30% |
| HHR | Hartshead Resources NL | $0.014 | +7.69% |
52 Week Lows
Code | Company | Last | % Chg |
|---|---|---|---|
| VTA | Vita Resources NL | $0.032 | -20.00% |
| SPG | SPC Global Holdings Ltd | $0.115 | -17.86% |
| UM1 | Unity Metals Ltd | $0.13 | -13.33% |
| HRE | Heavy Rare EARTHS Ltd | $0.024 | -11.11% |
| 5GG | Pentanet Ltd | $0.017 | -10.53% |
Near Highs
Code | Company | Last | % Chg |
|---|---|---|---|
| IHD | iShares S&P/ASX DIV Opportunities Esg Screened ETF | $17.26 | +0.12% |
| CNEW | Vaneck China New Economy ETF | $8.17 | -0.97% |
| FFM | Firefly Metals Ltd | $2.19 | +2.34% |
| KOV | Korvest Ltd | $16.30 | +1.56% |
| MI6 | Minerals 260 Ltd | $0.91 | +7.06% |
Relative Strength Index (RSI) Oversold
Code | Company | Last | % Chg |
|---|---|---|---|
| DGL | DGL Group Ltd | $0.375 | -1.32% |
| IRE | Iress Ltd | $5.86 | -2.98% |
| UNI | Universal Store Holdings Ltd | $6.50 | +0.62% |
| LOT | Lotus Resources Ltd | $0.715 | -2.72% |
| LDX | Lumos Diagnostics Holdings Ltd | $0.13 | -7.14% |
