
News | Market Wraps
Evening Wrap: ASX 200 rips 190 points — Time to buy? Depends on whether you believe the President of the United States
The S&P/ASX 200 closed 190 points higher, up 2.24%.

Mentioned
The S&P/ASX 200 closed 190 points higher, up 2.24%.
The ASX 200 surged as markets latched onto fresh signals the US may soon step back from the Iran conflict, sparking a sharp risk-on rotation across oversold sectors. Easing bond yields and optimism around a potential end to the inflation shock drove a powerful rebound, led by gold stocks and major miners.
In stock specific news:
Eagers Automotive (APE) (+9.5%) — surged after announcing acquisitions of two Audi dealerships and a 49% stake in Grand Motors Group.
Star Entertainment (SGR) (+8.7%) — rallied after partners took full control of the Queen’s Wharf precinct in Brisbane.
Pro Medicus (PME) (+6.0%) — jumped after announcing a 10.4 million-share buyback.
Perenti (PRN) (+4.1%) — gained after appointing a new chief executive as part of a planned leadership transition.
ARN Media (A1N) (-18.9%) — plunged after legal action was launched seeking more than $82 million in damages.
Be sure to click/scroll through for the usual reporting of the major sector and stock-specific moves, the broker responses to them, as well as all the key economic data in tonight's Evening Wrap.
Also, I have detailed technical analysis on the Nasdaq Composite and the S&P/ASX 200 in today's ChartWatch.
Let's dive in!
Today in Review
Wed 01 Apr 26, 5:09pm (AEST)
Name | Value | % Chg |
|---|---|---|
Major Indices | ||
| ASX 200 | 8,671.8 | +2.24% |
| All Ords | 8,885.6 | +2.32% |
| Small Ords | 3,416.9 | +2.76% |
| All Tech | 2,630.2 | +3.33% |
| Emerging Companies | 3,046.0 | +3.32% |
Currency | ||
| AUD/USD | 0.6913 | +0.19% |
US Futures | ||
| S&P 500 | 6,596.0 | +0.38% |
| Dow Jones | 46,711.0 | +0.28% |
| Nasdaq | 24,058.0 | +0.60% |
Name | Value | % Chg |
|---|---|---|
Sector | ||
| Materials | 22,827.4 | +4.86% |
| Information Technology | 1,610.9 | +3.48% |
| Financials | 9,455.9 | +1.79% |
| Consumer Discretionary | 3,424.8 | +1.75% |
| Health Care | 28,152.4 | +1.54% |
| Industrials | 7,957.8 | +1.10% |
| Communication Services | 1,707.0 | +0.87% |
| Real Estate | 3,288.9 | +0.51% |
| Energy | 11,424.5 | +0.51% |
| Consumer Staples | 12,566.8 | +0.20% |
| Utilities | 10,452.9 | -0.23% |
Markets
%20intraday%20chart_1%20Apr.png)
ASX 200 Session Chart
The S&P/ASX 200 (XJO) finished 190 points higher at 8,671.8, 2.2% from its session low and smack–bang on its session high. Reinforcing just how widespread today’s risk-on move was, in the broader-based S&P/ASX 300 (XKO) advancers beat decliners by a very tidy 228 to 59.
Dripping in GOLD! 🥇 Gold is supposed to be a hedge against global uncertainty and geopolitical risk… And yet this time, it has performed the EXACT OPPOSITE.
That's because this geopolitical risk event put a rocket under inflation expectations, driving market yields higher — and because gold doesn’t have a yield — it hobbled gold prices and the stocks that produce it in the process.
So, when we get some good news on the Middle East conflict, it’s also good news for gold. Bond yields continued to pull back on hopes that a major inflationary pulse can be avoided if President Trump’s promises of an imminent end to the conflict with Iran come to fruition. Hey — why wouldn’t markets believe what the President of the United States has to say!? 🤷
Other risk-on and interest rate sensitive sectors also rallied today, with Resources (XJR) (+4.1%) aided by the gold sector's strength, but also by strong gains in majors BHP (BHP) (+4.3%) and Rio Tinto (RIO) (+3.5%) as investors sought big-beautiful-and-liquid risk-on exposure.
Tech bounced on renewed risk appetite, and that correction in benchmark market yields. Catapult Sports (CAT) (+6.8%), Siteminder (SDR) (+6.3%) and Life360 (360) (+5.9%) were best there, while not-strictly tech-but-might-as-well be Pro Medicus (PME) (+6.0%) was also notable.
Interestingly — the sector that had the most to lose today, Energy — was UP! Woodside Energy Group (WDS) (+0.11%) and Santos Ltd (STO) (+0.1%) snuck away with slivers of gains after a tough start to the session. Who would have thunk it! 🤔
Fund flows: A blipping interesting close!
Just look at that intraday chart… note the blip-up at the far right. That blip — some 18 points — is important.
It’s the difference between the closing price at the end of the 6-hours where the big fund managers had time to trade with each other in an open and transparent environment, aka, the regular trading session — and the conclusion of the mysterious closing price auction.
The CPA is where the big boys and girls get to square their books for the day. They pump in the rest of “that big buy order which absolutely must be executed today” versus for others, “that big sell order which absolutely must be executed today”.
Those orders go up against each other at the prices the fund managers hope they’ll be able to entice enough flow the other way to get the job done.
At 4.10pm, give or take, everything gets weighted-averaged-out, and our official end of day closing prices are set.
That final blip-up today shows you there was more weight on the demand-side at the end of today's trade than there was on the supply-side.
Put another way: the demand-side couldn’t engage sufficiently with a supply-side during regular trading — because let’s face it — the supply simply wasn’t there… So, in order to get the job done — to get their requisite risk into the market — they were forced to bid up prices in the CPA to tease out supply.
We can’t ask the big fundies what they’re doing — even if we could — they wouldn’t tell us plebs anyway!
But the good thing is, if you know where to look, e.g., in the trends, the price action, the candles, volume — and yes, in the occasionally instructive CPA — then at least we can see what they’re doing.
It’s about as good as we’re going to get (as plebs!) when it comes to understanding which way the big funds are flowing! 🌊
Today's best blue chip gainers
Company | Last Price | Change $ | Change % | 1mo % | 1yr % |
|---|---|---|---|---|---|
Greatland Resources (GGP) | $13.03 | +$1.69 | +14.9% | -5.2% | 0% |
Eagers Automotive (APE) | $24.63 | +$2.13 | +9.5% | +11.5% | +63.1% |
Northern Star (NST) | $22.10 | +$1.74 | +8.5% | -28.0% | +20.3% |
Evolution Mining (EVN) | $13.65 | +$1.03 | +8.2% | -19.1% | +88.8% |
James Hardie (JHX) | $28.14 | +$2.04 | +7.8% | -13.8% | -23.9% |
Regis Resources (RRL) | $7.13 | +$0.48 | +7.2% | -25.3% | +81.0% |
Westgold Resources (WGX) | $6.29 | +$0.4 | +6.8% | -21.2% | +124.6% |
Capricorn Metals (CMM) | $11.70 | +$0.7 | +6.4% | -23.2% | +43.9% |
Genesis Minerals (GMD) | $6.25 | +$0.36 | +6.1% | -23.1% | +66.7% |
Pro Medicus (PME) | $123.97 | +$7.07 | +6.0% | +8.5% | -37.8% |
Life360 (360) | $19.87 | +$1.1 | +5.9% | -2.4% | -1.2% |
Ramelius Resources (RMS) | $3.88 | +$0.21 | +5.7% | -14.0% | +62.3% |
Sandfire Resources (SFR) | $16.93 | +$0.9 | +5.6% | -13.0% | +62.6% |
Light & Wonder (LNW) | $125.63 | +$6.62 | +5.6% | -2.8% | -10.0% |
Perseus Mining (PRU) | $5.43 | +$0.28 | +5.4% | -10.5% | +61.1% |
Mineral Resources (MIN) | $56.39 | +$2.78 | +5.2% | +0.6% | +137.1% |
South32 (S32) | $4.48 | +$0.21 | +4.9% | -2.0% | +39.6% |
Newmont (NEM) | $158.42 | +$6.87 | +4.5% | -13.6% | +103.3% |
BHP (BHP) | $52.56 | +$2.17 | +4.3% | -8.9% | +35.2% |
Block, (XYZ) | $88.11 | +$3.6 | +4.3% | -1.7% | +2.1% |
Today's worst blue chip losers
Company | Last Price | Change $ | Change % | 1mo % | 1yr % |
|---|---|---|---|---|---|
Telix Pharmaceuticals (TLX) | $13.20 | -$0.46 | -3.4% | +33.7% | -49.9% |
A2 Milk Company (A2M) | $9.34 | -$0.23 | -2.4% | -4.3% | +18.4% |
Mirvac (MGR) | $1.730 | -$0.04 | -2.3% | -12.6% | -18.8% |
Stockland (SGP) | $4.24 | -$0.07 | -1.6% | -13.3% | -15.4% |
APA (APA) | $9.80 | -$0.15 | -1.5% | +5.5% | +23.3% |
Transurban (TCL) | $13.84 | -$0.17 | -1.2% | -4.4% | +2.7% |
GPT (GPT) | $4.48 | -$0.05 | -1.1% | -7.8% | +0.7% |
Endeavour (EDV) | $3.23 | -$0.03 | -0.9% | -18.8% | -16.3% |
Suncorp (SUN) | $16.01 | -$0.14 | -0.9% | +11.3% | -17.4% |
Insurance Australia (IAG) | $7.30 | -$0.04 | -0.5% | +10.4% | -6.0% |
Dexus (DXS) | $5.89 | -$0.03 | -0.5% | -10.5% | -18.4% |
Sonic Healthcare (SHL) | $20.37 | -$0.08 | -0.4% | -13.8% | -21.4% |
The Lottery Corp. (TLC) | $5.36 | -$0.02 | -0.4% | -1.7% | +11.4% |
Charter Hall (CHC) | $18.57 | -$0.06 | -0.3% | -13.5% | +10.7% |
Ampol (ALD) | $33.60 | -$0.08 | -0.2% | +12.1% | +43.6% |
Atlas Arteria (ALX) | $4.27 | -$0.01 | -0.2% | -10.3% | -11.2% |
Whitehaven Coal (WHC) | $9.24 | -$0.01 | -0.1% | +12.8% | +72.1% |
Steadfast (SDF) | $4.25 | $0 | 0% | 0% | -27.0% |
Woodside Energy (WDS) | $35.09 | +$0.04 | +0.1% | +15.1% | +49.3% |
ChartWatch
Nasdaq Composite Index
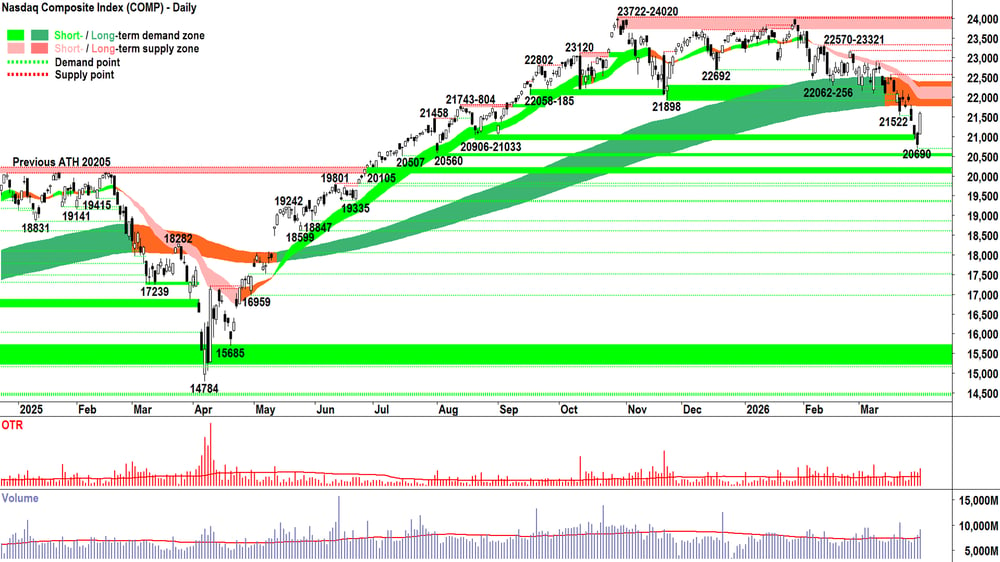
Analysis
When markets are falling due to perceived risks to the global economy, we can summarise the risks facing the big fund managers as such:
Hedge funds / Shorts
Goal: Profit from falling prices
Risk: Prices don’t fall (i.e., because of time erosion and opportunity cost) or prices rise (= demand if prices are rising!)
Active Underweights (Actively managed long-only funds strategically holding large cash balances, deliberately “underweight” the benchmark index)
Goal: Put cash stockpiles to work at better value prices / after a crash
Risk: Prices rise (= demand if benchmark is rising!)
Passives
Goal: Track index
Risk: Not tracking the index! (= demand if prices are rising!)
Always Long & Always Buying (Pension funds who must allocate net flows, i.e., inflows minus redemptions — but particularly in Aus with Superannuation Guarantee = ALWAYS BUYING!)
Goal: In theory, could be Active or Passive strategies, but generally Passive
Risk: Can’t get money in fast enough… they must buy every dip and every rip anyway (= demand all the time)
Whether markets believe what President Trump has to say or not, we just saw:
✅ The Shorts knock off some risk
✅ Active Underweights knock off some risk
✅ Passives forced to add risk
✅ Always Long & Always Buying add risk anyway!
+R +R +R +R = Lots of demand
So, where’s the supply in this equation? 🤔
Well, it’s not coming from the Shorts — they likely don’t want a bar of it given the wall of demand coming their way… no supply coming here...
Nor is going to come from the Active Underweights. If you think the Shorts are scared of rising prices — well this group is the one who fears markets rising the most, because one can’t earn one’s bonus if one doesn’t beat the index!
The Passives have zero reason to supply, by default, when prices are rising.
The Always Long & Always Buying — well, you know their deal!
So, very suddenly, you go from an environment of excess supply to very strong excess demand.
This isn’t a new phenomenon. It’s been happening as long as markets have been printing candles — i.e., a very long time!
There’s nothing particularly special about this one either — and as trend followers, we must do the Analysis, Accept the outcome, and Act accordingly with our risk.
But we should keep in mind, that trend followers are incapable of picking the bottom — whether we just saw it… or not!
View
Yes, that's a proper demand-side candle. Decent in terms of:
Disconnect with prior candle's close (sudden and significant shift in demand-supply environment towards excess demand).
Close near high (sustained excess demand, unfulfilled demand).
Length — well-above average OTR (motivated demand = FOMO, lack of supply = HOFU).
Volume — well above-average volume suggests demand-side commitment, plus supply removal heading into tricky potential supply zones of 21522 and trend ribbons.
But! There's still all the other stuff... I won't do the checklist, we only just did it yesterday, it hasn't changed except for exactly one candle! 🕯️
And that means that while Tuesday's candle was a cracker for the demand-side, it remains insufficient for me to change my risk settings.
Yet.
Confirmation that the demand-side is back in control of the Comp's price is required. That will be in the form of more strong demand-side candles, a higher trough, a close at least in the trend ribbons (at least, and then the rest!) = There's still some stuff to do!
So, there's only one way I can presently Act = 1/3RP 🪣 — i.e., my personal allowable capital allocation limit for my investments in US stocks is 33% (1/2RP is 50%, 2/3RP is 67% and FRP is 100%).
However, what I can do within my existing 1/3RP setup — is very closely scrutinise my short-side exposure, let it roll off or lock in profits more aggressively, as well as be more open to adding risk to longs that are demonstrating very strong demand-side control.
Key levels
The short- and long term downtrends remain intact. Both trend ribbons appear to be acting as a zone of dynamic excess supply (downtrend ribbon combination (presently 21775-22391). We must see a long white-bodied candle closing at least above the short term trend ribbon to indicate the demand-side is any chance of being back in control of the Comp's price.
20690 is the key point of demand. As long as it holds, this new rally is intact. Below it, hello bear market! 🐻
S&P/ASX 200 (XJO)
%20chart_1%20Apr.png)
Analysis
Will we all look back at today in the “two to three weeks” the conflict in the Middle East is supposed to be over in, and think: Yep, I was an April Fool to believe that! 🤦
Possibly.
Probably! 😉
But let’s for this April 1, 2026 — call a spade a spade.
Or rather, a BIG WHITE CANDLE WITH CLOSE AT ITS HIGH a… well… you know…
A bloody big showing of total demand-side motivation versus a total lack of engagement from the supply-side.
Demand-side motivation? That would be the massive white candle — the biggest smear of white since the last time market had TACO for dinner back on April 10 (April 9 for US markets — the backing down of DT’s so-called “reciprocal” tariffs). ✅
Supply-side lack of engagement? I put to you, the only roughly average volume today was simply because the demand-side couldn’t find targets on the market breadth. The closing price auction discussed in Fund Flows above, suggests this. ✅
Add to today’s candle the confirmation of a higher peak, which adds to the higher trough at 8379 formed yesterday — plus the blowing away of nearly all the short term trend ribbon and about half the long term trend ribbon, and: SPADE!
It’s the sort of move that has me thinking about moving back to 1/2RP. I believe we can entertain this. It doesn't have to happen overnight… but I am, officially, happy to begin to move in that direction — if and only if, I can find the quality uptrends required to snag new +R.
Yes… the confidence is just dripping off that last statement! 🤣
As the saying goes ladies and gentlemen… if you don’t laugh, you’ll cry… and somehow, we’ll no doubt end up doing both before the next “two to three weeks” are up!
View
Chop, chop, chop 🪓 Here we go! A tentative exploration of what +R is available to begin moving to my new 1/2RP portfolio risk limit 🪣 (i.e., my personal allowable capital allocation limit for my investments in Australian stocks is 50%). No rush to get there + still happy to entertain some RP in shorts for cover. Steady as she goes... and still respecting the fact that at 50% cash — my model has me very insulated from any resumption of the downturn.
Key levels
This is very simple now, 8262-8379 is the key zone of demand. As long as it holds, this new rally is intact. Below it, hello bear market! 🐻
The ASX 200 must at least close back above the short- and long term uptrend ribbons (presently 8616-8735) to really confirm its newfound semblance of demand-side control.
**NEW VIDEO DROPPED — IS IT TIME TO BUY THE DIP IN ASX SHARES?**
ChartWatch *LIVE* Webinar
ChartWatch *LIVE* Webinars – WEEKLY Wednesday's @ 12pm AEDT
Learn more about technical analysis and trend following through real case studies on ASX stocks. Australia's premier technical analyst, Carl Capolingua, shares his unique insights on stocks as requested by viewers. Ask about a company in your portfolio or anything related to trading and investing and get Carl's expert opinion.
Places are limited so >REGISTER NOW!<
Economy
Today
AUS February Building Approvals
Result: +29.7% m/m vs +6.1% m/m forecast and -7.2% in January
Takeaway: Some volatility in the data for apartments and townhouses vs big dip in Jan. Wouldn't read too much into this typically erratic data series!
Later this week
Wednesday
23:30 USA February Core Retail Sales (+0.3% m/m forecast vs 0.0% in January)
Thursday
01:00 ISM March Manufacturing PMI (52.3 forecast vs 52.4 in February)
Friday
AUS Non-trading day
23:30 USA March Non-farm Payroll Data
Employment change: +56,000 forecast vs -92,000 in February
Average hourly earnings: +0.3% m/m forecast vs +0.4% m/m in February
Unemployment rate: 4.4% forecast vs 4.4% in February
Latest News
Interesting Movers
Trading higher
+16.2% HMC Capital (HMC) – Continued positive response to 31-Mar Victorian Big Battery Site Visit Presentation.
+14.9% Greatland Resources (GGP) – No news, general strength across the broader Precious Metals sector today.
+12.7% Electro Optic Systems (EOS) – No news.
+11.8% Lotus Resources (LOT) – Kayelekera Uranium Accepted by Orano Conversion Facility.
+11.7% Chalice Mining (CHN) – No news, general strength across the broader Critical Minerals sector today.
+10.7% Develop Global (DVP) – No news, general strength across the broader Critical Minerals sector today.
+10.2% Pantoro Gold (PNR) – Change in substantial holding, general strength across the broader Precious Metals sector today, (UBS 6.4% from 5.2%).
+10.1% WA1 Resources (WA1) – No news, general strength across the broader Critical Minerals sector today.
+10.1% Predictive Discovery (PDI) – No news, general strength across the broader Precious Metals sector today.
+9.5% Eagers Automotive (APE) – Update on Growth Initiatives and CanadaOne Auto Completion.
Trading lower
-14.7% (PXA) – Response to ASX Price Query and ARNECC's Statement regarding Interoperability Program.
-5.5% Dateline Resources (DTR) – $96m Cash Position to Accelerate Colosseum Development.
-3.4% Collins Foods (CKF) – Continued negative response to 31-Mar Taco Bell Transition Arrangement, fall is consistent with prevailing short and long term downtrends, a regular in ChartWatch ASX Scans Downtrends list 🔎📉
-3.4% Karoon Energy (KAR) – No news, general weakness across the broader Energy sector today.
Broker Moves
AML3D (AL3)
Retained at speculative buy at Bell Potter; Price Target: $0.40
Aristocrat Leisure (ALL)
Retained at outperform at Macquarie; Price Target: $63.00
Cuscal (CCL)
Retained at buy at Bell Potter; Price Target: $5.10
Retained at buy at Ord Minnett; Price Target: $5.13
Collins Foods (CKF)
Retained at overweight at Morgan Stanley; Price Target: $11.20
Retained at buy at UBS; Price Target: $13.50
Clarity Pharmaceuticals (CU6)
Retained at speculative buy at Bell Potter; Price Target: $6.50 from $6.40
Deep Yellow (DYL)
Upgraded to hold from underperform at Jefferies; Price Target: $1.90 from $2.20
Elders (ELD)
Retained at outperform at Macquarie; Price Target: $8.60
Greatland Resources (GGP)
Retained at buy at Ord Minnett; Price Target: $19.00 from $18.50
HMC Capital (HMC)
Retained at buy at UBS; Price Target: $3.70
James Hardie Industries Plc (JHX)
Retained at buy at Citi; Price Target: $42.60
Meteoric Resources NL (MEI)
Retained at speculative buy at Ord Minnett; Price Target: $0.25 from $0.40
Minerals 260 (MI6)
Retained at speculative buy at Bell Potter; Price Target: $0.90
Macquarie Group (MQG)
Retained at buy at Ord Minnett; Price Target: $255.00
Nine Entertainment Co. Holdings (NEC)
Initiated at outperform at Macquarie; Price Target: $1.15
New Murchison Gold (NMG)
Upgraded to speculative buy from hold at Argonaut Securities; Price Target: $0.06 from $0.07
PEXA Group (PXA)
Retained at outperform at CLSA; Price Target: $17.70
Retained at outperform at Macquarie; Price Target: $19.60
Downgraded to neutral from buy at UBS; Price Target: $15.70 from $17.50
Qantas Airways (QAN)
Retained at buy at UBS; Price Target: $11.60
Reece (REH)
Retained at neutral at Citi; Price Target: $16.70
Reliance Worldwide Corporation (RWC)
Retained at neutral at Citi; Price Target: $3.90
Treasury Wine Estates (TWE)
Retained at sell at Citi; Price Target: $4.25
Virgin Australia Holdings (VGN)
Retained at buy at UBS; Price Target: $4.25
Viridis Mining and Minerals (VMM)
Initiated at speculative buy at Ord Minnett; Price Target: $3.60 from $4.70
West African Resources (WAF)
Retained at buy at Argonaut Securities; Price Target: $6.50 from $6.30
Retained at speculative buy at Euroz Hartleys; Price Target: $5.70 from $5.65
Retained at outperform at Macquarie; Price Target: $4.50
Woodside Energy Group (WDS)
Downgraded to sell from lighten at Ord Minnett; Price Target: $24.75
Scans
Top Gainers
Code | Company | Last | % Chg |
|---|---|---|---|
| FTI | Fortifai Ltd | $0.545 | +36.25% |
| CMD | Cassius Mining Ltd | $0.034 | +36.00% |
| CXU | Cauldron Energy Ltd | $0.041 | +32.26% |
| SHO | Sportshero Ltd | $0.115 | +32.18% |
| JNO | Juno Minerals Ltd | $0.029 | +31.82% |
Top Fallers
Code | Company | Last | % Chg |
|---|---|---|---|
| ETM | Energy Transition Minerals Ltd | $0.054 | -41.94% |
| ERG | Eneco Refresh Ltd | $0.014 | -36.36% |
| ECL | Excelsior Capital Ltd | $0.985 | -30.39% |
| BRU | Buru Energy Ltd | $0.017 | -26.09% |
| 14D | 1414 Degrees Ltd | $0.02 | -25.93% |
52 Week Highs
Code | Company | Last | % Chg |
|---|---|---|---|
| FTI | Fortifai Ltd | $0.545 | +36.25% |
| CMD | Cassius Mining Ltd | $0.034 | +36.00% |
| CXU | Cauldron Energy Ltd | $0.041 | +32.26% |
| GBE | Globe Metals & Mining Ltd | $0.11 | +22.22% |
| 49M | 49 Metals Ltd | $0.195 | +18.18% |
52 Week Lows
Code | Company | Last | % Chg |
|---|---|---|---|
| ECL | Excelsior Capital Ltd | $0.985 | -30.39% |
| M3M | M3 Mining Ltd | $0.02 | -16.67% |
| NX1 | Nexalis Therapeutics Ltd | $0.017 | -15.00% |
| INV | Investsmart Group Ltd | $0.091 | -13.33% |
| ATA | Atturra Ltd | $0.47 | -12.96% |
Near Highs
Code | Company | Last | % Chg |
|---|---|---|---|
| BILL | iShares Core Cash ETF | $100.71 | 0.00% |
| DGVA | Dimensional Global Value Trust - Active ETF | $27.75 | +0.58% |
| AZJ | Aurizon Holdings Ltd | $4.02 | +1.26% |
| ILC | iShares S&P/ASX 20 ETF | $34.31 | +1.99% |
| TLS | Telstra Group Ltd | $5.34 | +0.19% |
Relative Strength Index (RSI) Oversold
Code | Company | Last | % Chg |
|---|---|---|---|
| HCRD | Betashares Interest Rate Hedged Aus Corp Bond ETF | $25.18 | -0.47% |
| SGP | Stockland | $4.24 | -1.62% |
| SPK | Spark New Zealand Ltd | $1.715 | -0.58% |
| HVN | Harvey Norman Holdings Ltd | $4.87 | -1.22% |
| VSL | Vulcan Steel Ltd | $5.27 | 0.00% |
