News | Market Wraps
Evening Wrap: ASX 200 rises despite weaker banks as China rare earths export restrictions tighten — LYC soars
The S&P/ASX 200 closed 12.8 points higher, up 0.15%.

Mentioned
The S&P/ASX 200 closed 12.8 points higher, up 0.15%.
It appears on the surface that it was only a modest day of trading on the ASX today. However, scratch beneath the surface of the paltry 13-odd point gain, and there were roughly 3 stocks gaining for each loser — arguably a convincing show of strength.
Rare earths and critical minerals stocks continued their charge, today bolstered by news that China is looking to apply even greater restrictions on exports of certain rare earth elements critical to the production of computer chips and defence applications.
Be sure to click/scroll through for the usual reporting of the major sector and stock-specific moves, the broker responses to them, as well as all the key economic data in tonight's Evening Wrap.
Also, I have detailed technical analysis on the Nasdaq Composite Index and the S&P/ASX 200 in today's ChartWatch.
Let's dive in!
Today in Review
Wed 07 Jan 26, 4:57pm (AEST)
Name | Value | % Chg |
|---|---|---|
Major Indices | ||
| ASX 200 | 8,695.6 | +0.15% |
| All Ords | 9,018.0 | +0.23% |
| Small Ords | 3,842.6 | +0.74% |
| All Tech | 3,356.7 | +1.01% |
| Emerging Companies | 3,263.3 | +1.28% |
Currency | ||
| AUD/USD | 0.6756 | +0.27% |
US Futures | ||
| S&P 500 | 6,892.25 | -0.00% |
| Dow Jones | 48,559.0 | +0.46% |
| Nasdaq | 25,372.25 | -0.33% |
Name | Value | % Chg |
|---|---|---|
Sector | ||
| Information Technology | 2,116.1 | +1.53% |
| Materials | 22,328.6 | +1.32% |
| Consumer Staples | 11,465.7 | +1.18% |
| Health Care | 33,410.1 | +0.91% |
| Industrials | 8,427.1 | +0.77% |
| Real Estate | 3,901.9 | +0.47% |
| Consumer Discretionary | 3,893.3 | +0.29% |
| Utilities | 9,456.2 | +0.28% |
| Communication Services | 1,715.1 | -0.02% |
| Financials | 9,063.9 | -1.02% |
| Energy | 8,278.5 | -2.34% |
Markets
%20intraday%20chart_7%20Jan.png)
ASX 200 Session Chart
The S&P/ASX 200 (XJO) finished 12.8 points higher at 8,695.6, 0.45% from its session high and just 0.15% from its low. Despite the benchmark closing off its highs, in the broader-based S&P/ASX 300 (XKO) advancers beat decliners by a surprisingly decisive 211 to 70.
Fund flows: Better than it looked
Banks. That's where the lag was today. Otherwise, that market breadth suggests it was actually a half decent day. Even the laggards Information Technology (XIJ) (+1.5%) and Health Care (XHJ) (+0.9%) rebounded.
But it was Financials (XFJ) (-1.0%), dragged down by the Big 4: National Australia Bank (NAB) (-2.0%), Westpac Banking Corp. (WBC) (-1.8%), Commonwealth Bank of Australia (CBA) (-1.7%), and ANZ Group Holdings (ANZ) (-1.5%) — which caused the fumble at an index level.
Resources (XJR) (+0.8%) were decent — but that's par for the course...
Just to catch you up on what's proving to be one of the most dichotomous markets I've seen in over 30-years of watching markets, check out the charts below. They speak for themselves... and they make one ponder how the benchmark can possibly break out of its present malaise and blast confidently to a new high. Certainly, the "loser" sectors must revert and join the "winner" sector in Resources!? 🤔
"LOSER" SECTORS — BIG FUND MANAGERS ARE ROTATING OUT!
%20chart_7%20Jan.png)
%20chart_7%20Jan.png)
%20chart_7%20Jan.png)
"WINNER" SECTOR — BIG FUND MANAGERS ARE ROTATING IN!
%20chart_7%20Jan.png)
"SWING" SECTOR — THE BANKS (THROUGH THEIR SHEER WEIGHT) HOLD THE KEY!
%20chart_7%20Jan.png)
Stock Specific: Rare earths — increasingly common theme...
China has imposed export controls on certain dual-use items to Japan, and only where materials are intended for military use. Dual-use items are goods with both civilian and defence applications, including rare earth inputs used in drones, radar systems and advanced semiconductors. The measures cover select rare earth elements critical to high-performance magnets and electronics, reinforcing China’s willingness to use its dominance in processing as a strategic lever.
While narrow, the move highlights how competition for critical minerals is increasingly geopolitical. It strengthens the investment case for non-Chinese supply chains, potentially benefiting ASX-listed rare earth producers such as Lynas Rare Earths (+14.5%), Arafura Rare Earths (ARU) (+5.2%), Calix (CXL) (+7.0%), Vital Metals (VML) (+11.8%), Meteoric Resources NL (MEI) (+8.1%), and American Rare Earths (ARR) (+14.3%) as buyers seek diversified, secure sources.
Today's best blue chip gainers
Company | Last Price | Change $ | Change % | 1mo % | 1yr % |
|---|---|---|---|---|---|
Lynas Rare Earths (LYC) | $15.06 | +$1.91 | +14.5% | +7.6% | +130.6% |
Dyno Nobel (DNL) | $3.39 | +$0.1 | +3.0% | +3.0% | +14.1% |
GPT Group (GPT) | $5.51 | +$0.15 | +2.8% | -0.9% | +23.3% |
Vicinity Centres (VCX) | $2.61 | +$0.07 | +2.8% | +7.4% | +20.8% |
Newmont Corp. (NEM) | $158.50 | +$4.24 | +2.7% | +18.0% | +155.0% |
Wisetech Global (WTC) | $66.80 | +$1.3 | +2.0% | -9.5% | -44.8% |
Orica (ORI) | $25.88 | +$0.5 | +2.0% | +7.8% | +55.9% |
James Hardie Industries (JHX) | $31.95 | +$0.6 | +1.9% | +5.4% | -35.8% |
Hub24 (HUB) | $93.64 | +$1.73 | +1.9% | -5.8% | +34.6% |
Fisher & Paykel Healthcare Corp. (FPH) | $33.13 | +$0.61 | +1.9% | +0.3% | -3.1% |
Capricorn Metals (CMM) | $14.84 | +$0.27 | +1.9% | +6.4% | +129.4% |
Netwealth Group (NWL) | $25.62 | +$0.46 | +1.8% | -5.4% | -10.6% |
Life360 (360) | $31.55 | +$0.55 | +1.8% | -16.7% | +40.3% |
Qantas Airways (QAN) | $10.48 | +$0.18 | +1.7% | +7.6% | +17.6% |
Woolworths Group (WOW) | $29.33 | +$0.49 | +1.7% | -0.2% | -4.5% |
Rio Tinto (RIO) | $154.73 | +$2.46 | +1.6% | +10.1% | +31.7% |
South32 (S32) | $3.84 | +$0.06 | +1.6% | +9.4% | +11.0% |
Medibank Private (MPL) | $4.75 | +$0.07 | +1.5% | +4.6% | +24.3% |
Atlas Arteria (ALX) | $4.86 | +$0.07 | +1.5% | -1.6% | +1.3% |
Block (XYZ) | $103.06 | +$1.48 | +1.5% | +11.3% | -26.4% |
Today's worst blue chip losers
Company | Last Price | Change $ | Change % | 1mo % | 1yr % |
|---|---|---|---|---|---|
Santos (STO) | $5.92 | -$0.18 | -3.0% | -10.7% | -14.0% |
Woodside Energy Group (WDS) | $22.86 | -$0.66 | -2.8% | -10.5% | -9.3% |
Ampol (ALD) | $30.48 | -$0.73 | -2.3% | -5.3% | +4.3% |
National Australia Bank (NAB) | $40.69 | -$0.84 | -2.0% | +0.4% | +8.4% |
Westpac Banking Corp. (WBC) | $37.52 | -$0.67 | -1.8% | -0.4% | +15.0% |
JB HI-FI (JBH) | $92.40 | -$1.59 | -1.7% | -3.8% | -1.9% |
Commonwealth Bank of Australia (CBA) | $153.23 | -$2.62 | -1.7% | +0.0% | -1.2% |
ANZ Group Holdings (ANZ) | $35.43 | -$0.54 | -1.5% | +0.3% | +22.8% |
Stockland (SGP) | $5.53 | -$0.06 | -1.1% | -5.0% | +12.9% |
Ramelius Resources (RMS) | $4.26 | -$0.04 | -0.9% | +20.0% | +101.9% |
Mineral Resources (MIN) | $57.26 | -$0.51 | -0.9% | +19.4% | +67.3% |
Car Group (CAR) | $29.56 | -$0.24 | -0.8% | -10.0% | -19.9% |
Bank of Queensland (BOQ) | $6.41 | -$0.04 | -0.6% | +0.3% | -4.2% |
Whitehaven Coal (WHC) | $7.79 | -$0.03 | -0.4% | +5.8% | +24.8% |
Goodman Group (GMG) | $30.32 | -$0.1 | -0.3% | +3.3% | -15.8% |
Worley (WOR) | $13.07 | -$0.04 | -0.3% | -0.8% | -6.4% |
Telstra Group (TLS) | $4.81 | -$0.01 | -0.2% | -1.6% | +18.2% |
PLS Group (PLS) | $4.83 | -$0.01 | -0.2% | +29.5% | +121.6% |
Fortescue (FMG) | $22.80 | -$0.04 | -0.2% | +5.4% | +23.8% |
REA Group (REA) | $180.04 | -$0.31 | -0.2% | -6.1% | -23.7% |
ChartWatch
Nasdaq Composite Index
Analysis
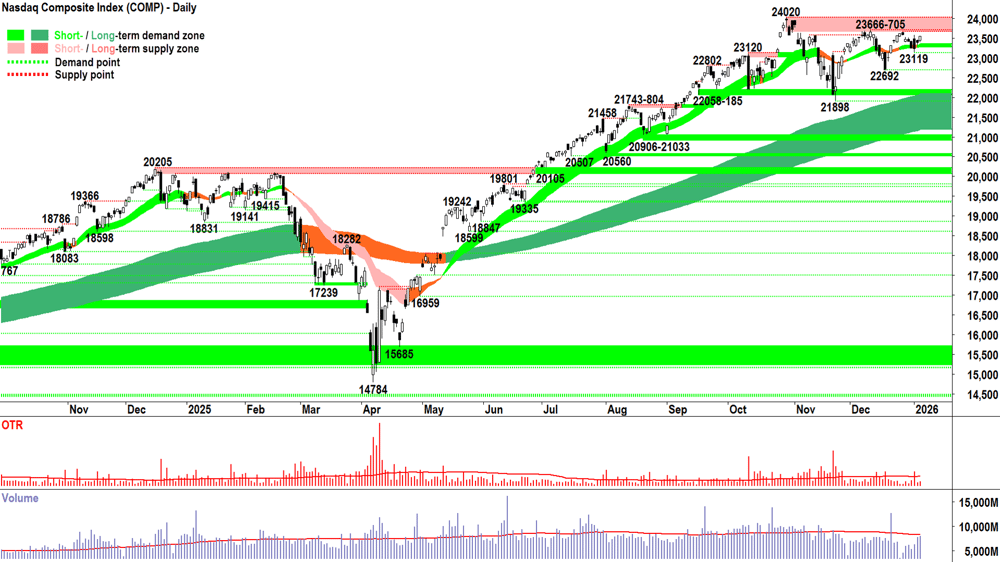
It’s been a few weeks since our last catch up on the Comp (ChartWatch Markets will resume soon!), but not a great deal has changed in the techincals — there’s a relative balance between the demand and supply sides of the market.
There were a couple of looks at a Santa Claus Rally that petered out almost as quickly as they appeared, and volume has been consistent with the typical end of year malaise — even if the last couple of sessions have boosted back towards average.
Importantly though, despite the relatively tame December by usual seasonal standards — we can see a marked improvement in the last three key points of demand in 21898 vs 22692 vs 23119. Demand is slowly but surely building.
Supply appears equally resolute for now — albeit less motivated to move price. 23666-24020 is the key zone of supply above, and it must be consumed if the usual seasonal strength in Jan-Feb is to play out in 2026.
The short term trend ribbon appears to be largely doing its job, there’s no question about the signalling from the long term trend ribbon.
As mentioned above, price action appears demand-side control oriented, and finally, candles are mixed — but perhaps if one squints — landing on demand-side control also.
In short there’s nothing sinister in this chart which has me feeling that one cannot continue to back the broader uptrend. 23119 is the closest point of demand, ideally the Comp doesn’t close back below there… but probably, 22696 is of greater importance.
Tuesday’s candle was a decent demand-side showing (white-bodied, close at the session’s high), and this bodes well for a test of 23666-24020 tonight. A close in that zone would be a strong signal there’s actually very little supply in there at all — and it would facilitate building one’s risk position back toward FRP (Full Risk Position).
Alternatively, if we start to see convincing supply-side showings in the supply zone (i.e., long black-bodied and or long upward pointing shadows), it will speak to the motivation of the supply-side to continue to sell into strength in that area — a substantial warning signal!
View
In my last update on 23-Dec, I said that I believed "somewhere between 1/2RP to 2/3RP is the right place to be". RP = Risk Position — it reflects my personal allowable capital allocation limit for my investments in US stocks. So 1/2RP is 50%, 2/3RP is 67% and FRP is 100%.
Given the modest improvement since that update, I'm happy to officially move to a 2/3RP portfolio risk limit.
Key levels
The trough at 23119 is the closest point of demand — a close below it would signal the demand-side is under pressure again — but I propose that it's not until a close below the next, lower point of demand at 22692 that we can assume they've lost control of the Comp's price. On a close below 21898 the short term trend is unequivocally down and the long term uptrend is likely under significant pressure = ⚠️. 23666-24020 is the nearest critical zone of supply — the Comp must close within this zone with a strong demand-side candle to confirm the demand-side is unequivocally back in control of the Comp's price.
S&P/ASX 200 (XJO)
%20chart_7%20Jan.png)
Analysis
As the technical picture is very modestly firming in the USA, it remains just as dicey as it was before the break here. In that same 23-Dec update, I noted I would restart my move from 1/3RP to 1/2RP for my Australian risk exposure.
If I was actually trading any ASX 200 stocks, this might actually be relevant.
But I know that you know. 😉
You know what my ChartWatch ASX Scans Uptrends Lists have been flagging as possible buys each day for months: Resources ✅
Okay, it’s more like: Resources ✅ Resources ✅ Resources ✅
On the other hand, my Downtrends Scan List is chock-full of Consumer Discretionary, Information Technology, and Healthcare names — as it has been for months, also…
Given the charts I showed you in the Markets section above — how could it be a case of anything else? 🤷
So, when I say something like "1/2RP" — we both know where that RP is going and where it’s not...
How can an ASX 200 — which is firing on what, all of one cylinder — achieve anything but the utter miserable mediocrity you see in the chart before you? 🤦
OLD
TIN
POT!
Yesterday’s candle, with its black body and upward pointing shadow, ranging outside the prior two sessions, suggests the supply-side remains dangerous here. It also saw about average volume — adding further credibility.
Today’s upward pointing shadow confirms this suspicion.
I could revert to 1/3RP, or I could halt the move to 1/2RP — but I ask you: why would one reduce risk when there are so many fantastic trends in Resources?
View
The Old Tin Pot is broken 😭. Despite this, I'll stick with 1/2RP 🪣 — but we all know that RP pretty much picks itself (i.e., my personal allowable capital allocation limit (Risk Position) for my investments in Australian stocks is 50%).
Key levels
8547-8562 is the new closest zone of demand. A close below this zone would confirm the supply side is back in control of the ASX 200's price. In theory though, the short term and long term trend ribbons now begin to act as a zone of dynamic demand (presently 8565-8682). After 8806 is the next key point of supply. A close above it would confirm the demand-side is in control of the price — but it would take a miracle in the "dud" sectors to make this happen!
ChartWatch *LIVE* Webinar
ChartWatch *LIVE* Webinars – WEEKLY Wednesday's @ 12pm AEDT
Learn more about technical analysis and trend following through real case studies on ASX stocks. Australia's premier technical analyst, Carl Capolingua, shares his unique insights on stocks as requested by viewers. Ask about a company in your portfolio or anything related to trading and investing and get Carl's expert opinion.
Places are limited so >REGISTER NOW!<
Economy
Today
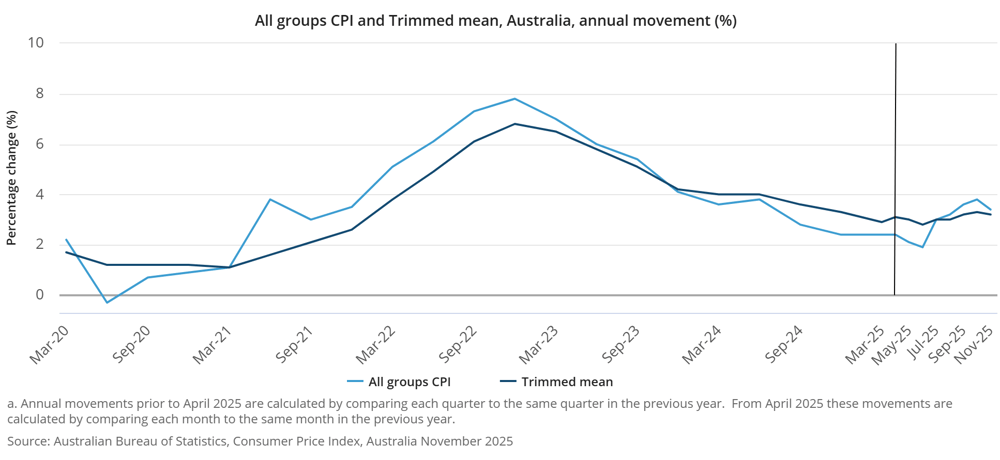
AUS November Consumer Price Index ("CPI")
Headline: +0.0% m/m vs +0.2% forecast and +3.4% p.a. vs +3.6% p.a. forecast and +3.8% p.a. in October
Trimmed Mean: +0.3% m/m vs +0.2% p.a. forecast and +3.2% p.a. vs +3.3% p.a. in October
Economists have welcomed the moderation in both headline and trimmed-mean inflation, but note that the broader re-acceleration in the second half of 2025 leaves little doubt the RBA remains more likely to raise its official cash rate this year than to cut it.
Later this week
Thursday
02:00 USA December ISM Services Purchasing Managers Index ("PMI") (52.2 forecast vs 52.6 in November)
02:00 USA December JOLTS Job Openings (7.61 million forecast vs 7.67 million)
Friday
12:30 CHN December CPI & Producer Price Index ("PPI")
CPI: +0.8% p.a. forecast vs +0.7% p.a. in November
PPI: -2.0% p.a. forecast vs -2.2% p.a. in November
Saturday
00:30 USA December Non-Farm Employment Report
Change: 66,000 forecast vs 64,000 in November
Rate: 4.5% forecast vs 4.6% in November
Average Hourly Earnings: +0.3% m/m vs +0.1% m/m in November
02:00 USA Preliminary UoM Consumer Sentiment (53.5 forecast vs 52.9 in December)
Latest News
Interesting Movers
Trading higher
+45.0% Energy Transition Minerals (ETM) – No news, general strength across the broader Rare Earths & Critical Minerals sector today, rise is consistent with prevailing short and long term uptrends 🔎📈
+31.8% Manuka Resources (MKR) – On Track to Commence Gold and Silver Production Q2 2026, general strength across the broader Precious Metals sector today, rise is consistent with prevailing short and long term uptrends, a regular in ChartWatch ASX Scans Uptrends list 🔎📈
+30.6% European Lithium (EUR) – No news, general strength across the broader Rare Earths & Critical Minerals sector today, rise is consistent with prevailing long term uptrend 🔎📈
+21.7% Dateline Resources (DTR) – No news, general strength across the broader Rare Earths & Critical Minerals sector today.
+15.0% Nyrada (NYR) – No news, rise is consistent with prevailing short and long term uptrends, a regular in ChartWatch ASX Scans Uptrends list 🔎📈
+14.5% Lynas Rare Earths (LYC) – No news, general strength across the broader Rare Earths & Critical Minerals sector today.
+12.9% 3D Energi (TDO) – Charlemont-1 Intersects Gas in Waarre Reservoirs, rise is consistent with prevailing long term uptrend 🔎📈
+11.9% 4DMEDICAL (4DX) – UC San Diego Health adopts CTVQ, rise is consistent with prevailing short and long term uptrends, a regular in ChartWatch ASX Scans Uptrends list 🔎📈
+10.1% Elevra Lithium (ELV) – No news, general strength across the broader Rare Earths & Critical Minerals sector today.
+10.0% St George Mining (SGQ) – No news since 06-Jan More Thick Mineralisation from Surface at Araxa, general strength across the broader Rare Earths & Critical Minerals sector today.
+8.9% Silex Systems (SLX) – No news, rebounded after yesterday's sharp sell-off due to DOE Funding Awards Outcomes.
+8.8% Orezone Gold Corp. (ORE) – No news, general strength across the broader Precious Metals sector today, rise is consistent with prevailing short and long term uptrends, a regular in ChartWatch ASX Scans Uptrends list 🔎📈
+8.1% Meteoric Resources (MEI) – Letter of Support for up to US$50M Received from EFA, general strength across the broader Rare Earths & Critical Minerals sector today, rise is consistent with prevailing short and long term uptrends 🔎📈
+7.6% Iperionx (IPX) – No news, general strength across the broader Rare Earths & Critical Minerals sector today.
+7.6% Australian Strategic Materials (ASM) – No news, general strength across the broader Rare Earths & Critical Minerals sector today.
+7.0% Calix (CXL) – No news, general strength across the broader Rare Earths & Critical Minerals sector today, rise is consistent with prevailing short and long term uptrends, a recent regular in ChartWatch ASX Scans Uptrends list 🔎📈
Trading lower
-6.4% Bellevue Gold (BGL) – SX2 Drills 12.2m @ 32.4 g/t Gold at Golden Dyke.
-5.2% Aeris Resources (AIS) – Change in substantial holding from SOL (Washington H. Soul Pattinson (SOL) 24.1% from 25.4%).
-4.8% Beach Energy (BPT) – No news, general weakness across the broader Energy sector today, fall is consistent with prevailing short and long term downtrends, a regular in ChartWatch ASX Scans Downtrends list 🔎📉
-4.0% Karoon Energy (KAR) – No news, general weakness across the broader Energy sector today, fall is consistent with prevailing short and long term downtrends, a regular in ChartWatch ASX Scans Downtrends list 🔎📉
-3.0% Santos (STO) – No news, general weakness across the broader Energy sector today, fall is consistent with prevailing short and long term downtrends, a regular in ChartWatch ASX Scans Downtrends list 🔎📉
-2.8% Woodside Energy Group (WDS) – No news, general weakness across the broader Energy sector today, fall is consistent with prevailing short and long term downtrends, a regular in ChartWatch ASX Scans Downtrends list 🔎📉
Broker Moves
Aurum Resource (AUE)
Retained at speculative buy at Canaccord Genuity; Price Target: $1.50
Bapcor (BAP)
Downgraded to sector perform from outperform at RBC Capital Markets; Price Target: $2.50 from $3.70
Bendigo and Adelaide Bank (BEN)
Upgraded to buy from neutral at Goldman Sachs; Price Target: $11.32 from $13.06
Bellevue Gold (BGL)
Retained at outperform at RBC Capital Markets; Price Target: $2.00
BlueScope Steel (BSL)
Upgraded to outperform from underperform at CLSA; Price Target: $30.00 from $20.50
Retained at neutral at Jarden; Price Target: $30.00 from $24.90
Retained at buy at Jefferies; Price Target: $37.00 from $28.00
Retained at outperform at Macquarie; Price Target: $25.50
Metallium (MTM)
Retained at speculative buy at Canaccord Genuity; Price Target: $1.60
Regis Resources (RRL)
Retained at outperform at RBC Capital Markets; Price Target: $9.60
Rox Resources (RXL)
Retained at speculative buy at Canaccord Genuity; Price Target: $1.10
Silex Systems (SLX)
Retained at speculative buy at Canaccord Genuity; Price Target: $9.42
Santos (STO)
Upgraded to outperform from market-perform at Bernstein; Price Target: $7.30 from $6.30
Turaco Gold (TCG)
Retained at speculative buy at Canaccord Genuity; Price Target: $1.35
Unico Silver (USL)
Retained at speculative buy at Canaccord Genuity; Price Target: $1.30
Scans
Top Gainers
Code | Company | Last | % Chg |
|---|---|---|---|
| ETM | Energy Transition Minerals Ltd | $0.145 | +45.00% |
| MKR | Manuka Resources Ltd | $0.145 | +31.82% |
| EUR | European Lithium Ltd | $0.235 | +30.56% |
| XPN | Xpon Technologies Group Ltd | $0.014 | +27.27% |
| GTI | Gratifii Ltd | $0.092 | +22.67% |
Top Fallers
Code | Company | Last | % Chg |
|---|---|---|---|
| RHY | RHYTHM Biosciences Ltd | $0.10 | -16.67% |
| ENX | Enegex Ltd | $0.235 | -16.07% |
| APL | Associate Global Partners Ltd | $0.17 | -15.00% |
| ROC | Rocketboots Ltd | $0.34 | -13.92% |
| 8CO | 8COMMON Ltd | $0.032 | -13.51% |
52 Week Highs
Code | Company | Last | % Chg |
|---|---|---|---|
| ETM | Energy Transition Minerals Ltd | $0.145 | +45.00% |
| MKR | Manuka Resources Ltd | $0.145 | +31.82% |
| HWK | Hawk Resources Ltd | $0.045 | +21.62% |
| GRL | Godolphin Resources Ltd | $0.029 | +16.00% |
| NYR | Nyrada Inc | $1.38 | +15.00% |
52 Week Lows
Code | Company | Last | % Chg |
|---|---|---|---|
| VGL | Vista Group International Ltd | $2.07 | -10.00% |
| SPA | Spacetalk Ltd | $0.10 | -9.09% |
| NOR | Norwood Systems Ltd | $0.012 | -7.69% |
| AHF | Australian Dairy Nutritionals Ltd | $0.033 | -5.71% |
| ENL | Enlitic Inc | $0.017 | -5.56% |
Near Highs
Code | Company | Last | % Chg |
|---|---|---|---|
| SMLL | Betashares Australian Small Companies Select ETF | $4.73 | +0.42% |
| DYM | Dynamic Metals Ltd | $0.48 | +2.13% |
| GLPR | iShares Ftse GBL Property Ex Aus (Aud Hedged) ETF | $26.49 | -0.53% |
| DFND | Vaneck Global Defence ETF | $40.07 | +0.18% |
| WVOL | iShares MSCI World Ex Aust Minimum Volatility ETF | $44.69 | -0.27% |
Relative Strength Index (RSI) Oversold
Code | Company | Last | % Chg |
|---|---|---|---|
| ASX | ASX Ltd | $51.12 | +1.17% |
| SGP | Stockland | $5.53 | -1.07% |
| WPR | Waypoint REIT | $2.50 | 0.00% |
| GAME | Betashares Video Games and Esports ETF | $18.09 | -3.16% |
| HVN | Harvey Norman Holdings Ltd | $6.56 | -4.93% |
