
News | Market Wraps
Evening Wrap: ASX 200 logs third straight gain on earnings beats, NAB +4%, TNE +8%, and NWL +14%
The S&P/ASX 200 closed 48.1 points higher, up 0.54%.

Mentioned
The S&P/ASX 200 closed 48.1 points higher, up 0.54%.
ASX 200 notched a third straight gain, with ten out of the eleven major sectors higher as technology-related stocks led the advance. In economics news, Australian wages rose 0.8% quarter-on-quarter and 3.4% year-on-year, broadly in line with expectations.
Information Technology (XIJ) (+2.2%) led as Technology One (TNE) (+8.2%) surged on an FY26 guidance upgrade and Hansen Technologies (HSN) (+16.3%) similarly jumped on its result.
Miners lagged on profit-taking, and a softer iron ore price in Asia today certainly didn't help. The worst stock in the sole losing sector was Capstone Copper Corp (CSC) (-14%), which fell on on weak FY26 earnings guidance. BHP Group (BHP) (-0.8%) was also a drag, as those weaker iron ore prices continued to ebb away at Tuesday’s record high.
In stock specific news, National Australia Bank (NAB) (+3.9%) hit a record high on a December quarter cash earnings beat. Superloop (SLC) (+18.8%) rocketed on a strong half and the acquisition of Lynham Networks for $165 million.
In commodities, uranium stocks are back to one-week highs, but remain 10-20% lower than their late-January peak. The spot uranium eased 0.8% to US$88.8/lb overnight, but this didn't prevent Paladin Energy (PDN) (5.5%) and Deep Yellow (DYL) (+4.3%) from logging solid gains.
Be sure to click/scroll through for the usual reporting of the major sector and stock-specific moves, the broker responses to them, as well as all the key economic data in tonight's Evening Wrap.
Also, I have detailed technical analysis on the Nasdaq Composite and the S&P/ASX 200 in today's ChartWatch.
Let's dive in!
Today in Review
Wed 18 Feb 26, 5:11pm (AEST)
Name | Value | % Chg |
|---|---|---|
Major Indices | ||
| ASX 200 | 9,007.0 | +0.54% |
| All Ords | 9,238.7 | +0.61% |
| Small Ords | 3,691.7 | +1.39% |
| All Tech | 2,777.5 | +1.63% |
| Emerging Companies | 3,133.8 | +1.89% |
Currency | ||
| AUD/USD | 0.7068 | -0.26% |
US Futures | ||
| S&P 500 | 6,874.25 | +0.20% |
| Dow Jones | 49,654.0 | +0.08% |
| Nasdaq | 24,829.25 | +0.25% |
Name | Value | % Chg |
|---|---|---|
Sector | ||
| Information Technology | 1,759.0 | +2.27% |
| Real Estate | 3,823.7 | +1.49% |
| Consumer Discretionary | 3,995.8 | +1.17% |
| Utilities | 10,128.9 | +0.97% |
| Communication Services | 1,660.0 | +0.66% |
| Financials | 9,867.4 | +0.64% |
| Industrials | 8,449.5 | +0.62% |
| Energy | 9,151.1 | +0.61% |
| Health Care | 29,877.0 | +0.49% |
| Consumer Staples | 12,133.3 | +0.22% |
| Materials | 23,445.6 | -0.18% |
Markets
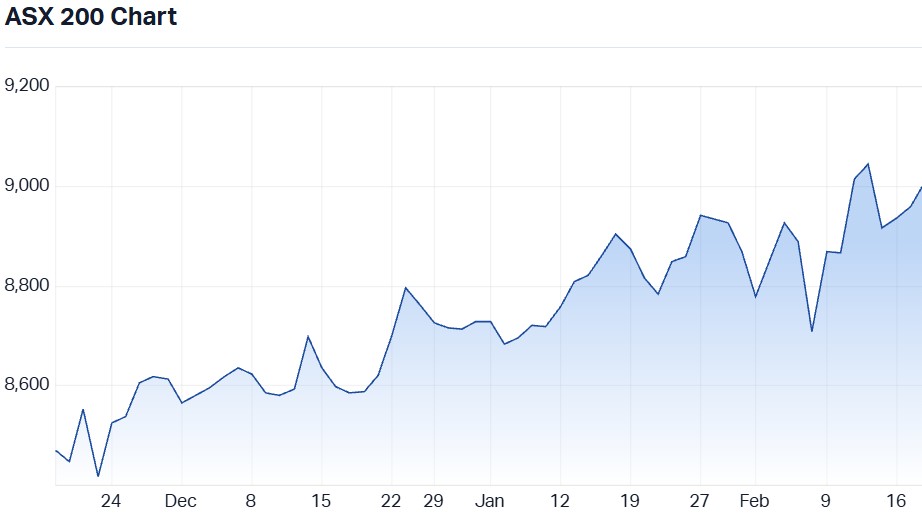
ASX 200 Session Chart
The S&P/ASX 200 (XJO) finished 48.1 points higher at 9007, 0.54% from its session low and just 0.02% from its high. In the broader-based S&P/ASX 300 (XKO) advancers beat decliners by an emphatic 201 to 71.
Fund flows: Come on OTP… You can do it… It’s your time to shine! 🤞
Come on Old Tin Pot… Come on… You can do it… It’s your time to shine! 🤞
Alas, much like your footy team (mine in particular = West Coast Eagles 🟦🟨!) no amount of urging your favourite stock or index up is going to make a lick of difference to the outcome!
But the technical picture is improving for the ASX 200, aka the Old Tin Pot — so much so, that in ChartWatch below, I describe today's candle as flagging the best opportunity to blast to a new record since October last year.
On a related note, did we just see our second consecutive day of a return to “normal”? I.e., it's two days now where sectors aren't melting up or melting down… and where stocks within those sectors aren't up/down 10, 20, 30% in the session?
I sure hope so!
We definitely saw a little push back on the rotation into Resources (XJR) (-0.1%) and Gold Sub-Index (XGD) (-0.9%) with high P/E / long duration generally prospering. There's plenty of talk in the media about the "value" to be found in the likes of Information Technology (XIJ) (+2.3%), Consumer Discretionary (XDJ) (+1.2%) and Communication Services (XTJ) (+0.7%).
It's all a bit moot for the benchmark, though, given that Financials (XFJ) (+0.6%) — as it usually does — holds the key to whether we do print that new record high or not. It was good, but as you'll see in the chart below, it couldn't sustain positive investor sentiment into the close.
The charts for the XJR, XIJ, and XFJ are instructive! 🧐
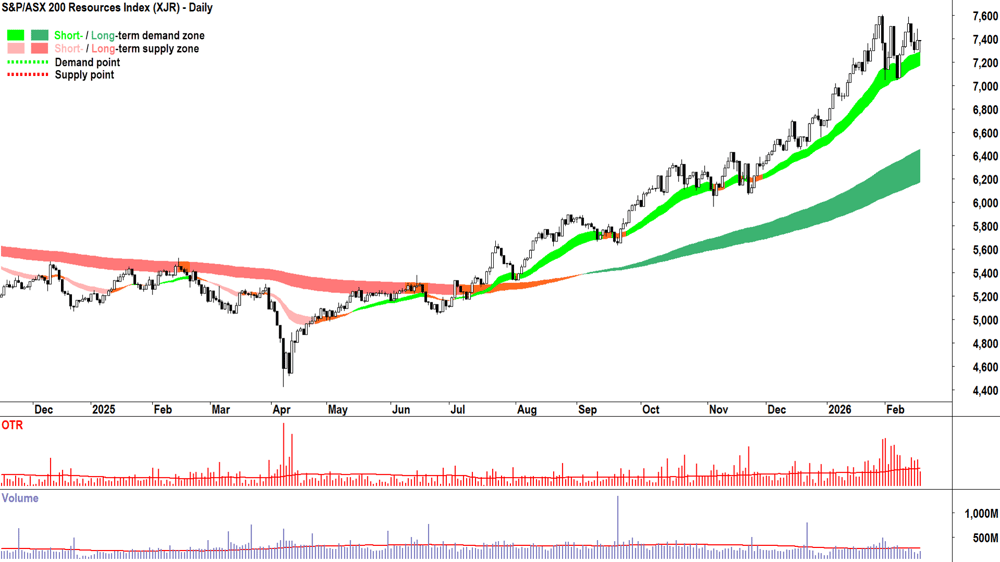
S&P-ASX 200 Resources Index chart
XJR was down, but it closed well off its session lows — amidst a still credible broader short and long term uptrend setup. As a trend follower, I remain comfortable backing this one. Certainly, it will be handy to have it during our assault on 9110-9116.
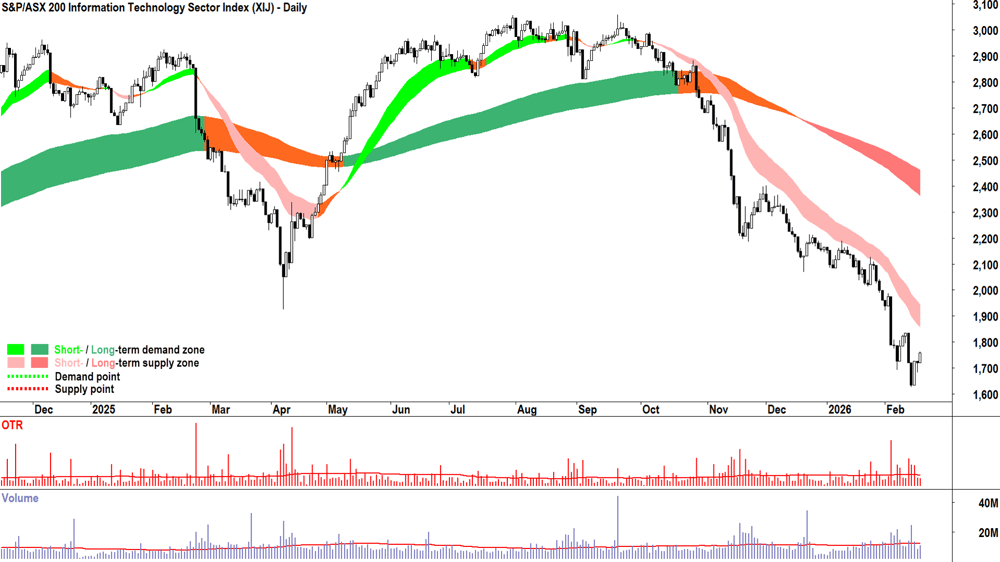
S&P-ASX 200 Information Technology Sector Index chart
The XIJ was solid today — and even a trend follower like me must concede demand has exceeded supply for three sessions now. But when can we be confident that this is a rally and not just a bounce? 🤔
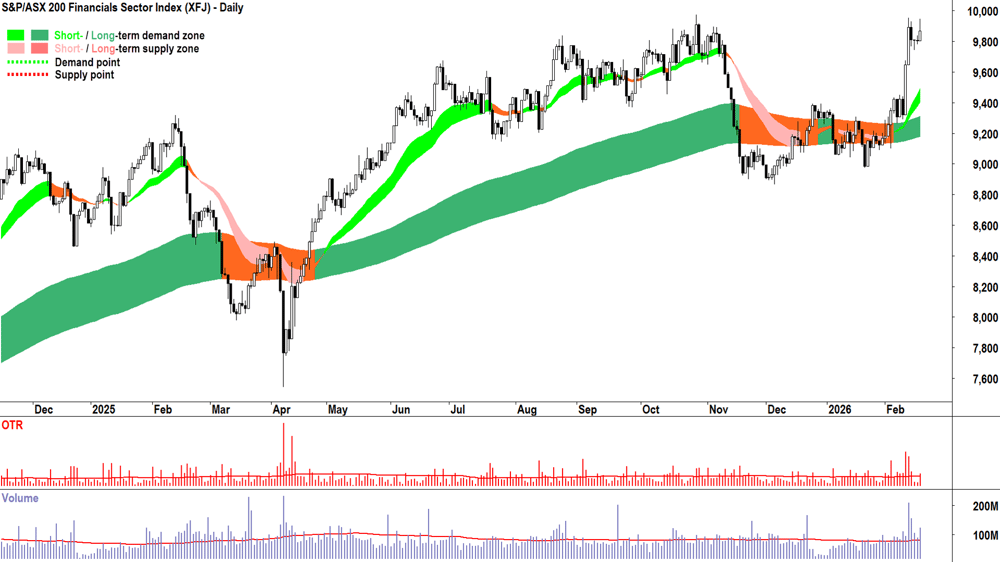
S&P-ASX 200 Financials Sector Index chart
The same could not be said for the XFJ, which failed to hold its highs today... but it's still knocking on an all-time high... So, some trepidation is probably not unexpected. I very much like how it got here, though. 🧐
Today's best blue chip gainers
Company | Last Price | Change $ | Change % | 1mo % | 1yr % |
|---|---|---|---|---|---|
Netwealth Group (NWL) | $25.35 | +$3.03 | +13.6% | +0.4% | -20.2% |
Challenger (CGF) | $8.90 | +$0.68 | +8.3% | -2.8% | +59.5% |
Technology One (TNE) | $23.50 | +$1.78 | +8.2% | -12.5% | -26.8% |
The Lottery Corp. (TLC) | $5.52 | +$0.36 | +7.0% | +8.2% | +12.2% |
Dexus (DXS) | $6.74 | +$0.43 | +6.8% | -2.7% | -13.1% |
Medibank Private (MPL) | $4.79 | +$0.27 | +6.0% | +2.6% | +21.3% |
Mirvac Group (MGR) | $2.04 | +$0.11 | +5.7% | 0% | -6.4% |
Hub24 (HUB) | $86.24 | +$4.41 | +5.4% | -12.2% | +2.2% |
National Australia Bank (NAB) | $47.14 | +$1.8 | +4.0% | +11.7% | +19.3% |
Pinnacle Investment Management (PNI) | $16.72 | +$0.62 | +3.9% | -7.6% | -34.1% |
Charter Hall Group (CHC) | $23.57 | +$0.77 | +3.4% | -2.5% | +43.1% |
Mineral Resources (MIN) | $53.75 | +$1.73 | +3.3% | -10.4% | +76.2% |
Lynas Rare Earths (LYC) | $15.51 | +$0.46 | +3.1% | -4.7% | +123.8% |
Bluescope Steel (BSL) | $28.74 | +$0.74 | +2.6% | -6.2% | +17.5% |
Ansell (ANN) | $32.95 | +$0.82 | +2.6% | -3.2% | -8.8% |
Resmed Inc (RMD) | $35.96 | +$0.89 | +2.5% | -6.4% | -2.0% |
Block (XYZ) | $72.13 | +$1.66 | +2.4% | -25.1% | -45.6% |
PLS Group (PLS) | $4.42 | +$0.1 | +2.3% | -5.6% | +110.5% |
Aristocrat Leisure (ALL) | $50.66 | +$1.13 | +2.3% | -10.9% | -34.8% |
Eagers Automotive (APE) | $25.60 | +$0.54 | +2.2% | -6.3% | +102.9% |
Today's worst blue chip losers
Company | Last Price | Change $ | Change % | 1mo % | 1yr % |
|---|---|---|---|---|---|
Suncorp Group (SUN) | $15.28 | -$0.7 | -4.4% | -8.8% | -19.4% |
Genesis Minerals (GMD) | $6.96 | -$0.21 | -2.9% | -8.1% | +118.2% |
Seek (SEK) | $16.10 | -$0.44 | -2.7% | -29.0% | -34.7% |
Ramelius Resources (RMS) | $4.40 | -$0.11 | -2.4% | -4.1% | +68.6% |
Pro Medicus (PME) | $123.00 | -$2.96 | -2.4% | -35.0% | -56.1% |
Evolution Mining (EVN) | $14.59 | -$0.32 | -2.1% | +7.8% | +136.9% |
Perseus Mining (PRU) | $5.52 | -$0.1 | -1.8% | -8.6% | +98.6% |
JB HI-FI (JBH) | $87.69 | -$1.41 | -1.6% | -2.0% | -10.0% |
James Hardie Industries (JHX) | $35.45 | -$0.54 | -1.5% | +3.2% | -29.6% |
South32 (S32) | $4.39 | -$0.05 | -1.1% | +4.0% | +19.6% |
Sigma Healthcare (SIG) | $2.99 | -$0.03 | -1.0% | +4.2% | -3.2% |
Worley (WOR) | $13.04 | -$0.13 | -1.0% | -0.5% | -10.7% |
Cochlear (COH) | $197.86 | -$1.95 | -1.0% | -26.4% | -27.8% |
Sonic Healthcare (SHL) | $21.24 | -$0.19 | -0.9% | -7.9% | -25.1% |
BHP Group (BHP) | $52.29 | -$0.45 | -0.9% | +7.3% | +27.6% |
Whitehaven Coal (WHC) | $8.44 | -$0.07 | -0.8% | -4.1% | +58.1% |
Vicinity Centres (VCX) | $2.55 | -$0.02 | -0.8% | 0% | +12.8% |
Northern Star Resources (NST) | $28.02 | -$0.21 | -0.7% | +1.2% | +59.5% |
Amcor PLC (AMC) | $69.98 | -$0.51 | -0.7% | +9.2% | -12.6% |
Commonwealth Bank of Australia (CBA) | $176.88 | -$1.15 | -0.6% | +15.4% | +8.8% |
ChartWatch
Nasdaq Composite Index
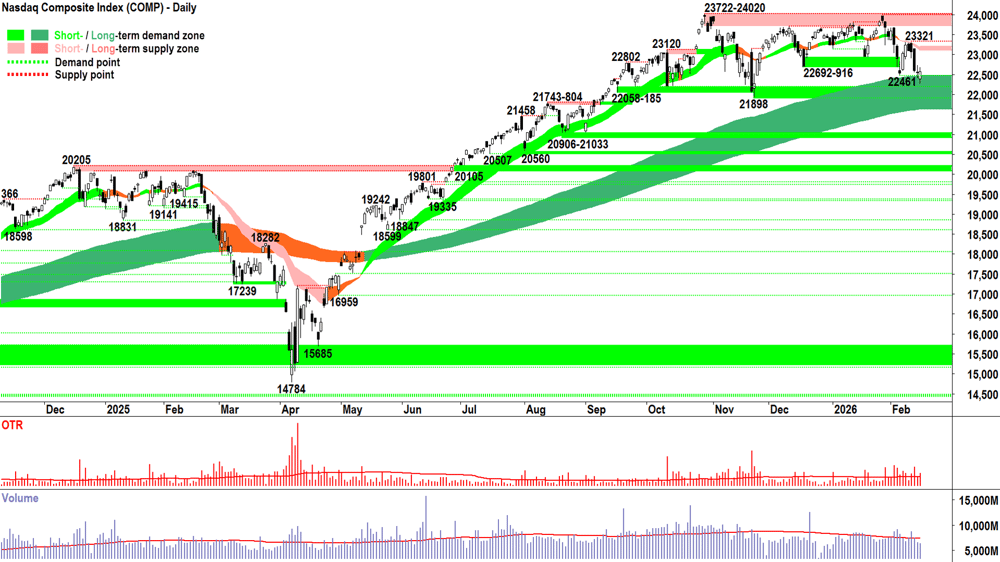
Analysis
The long term trend ribbon is doing its thing! Acting as a zone of dynamic demand… an area where longer term, positional investors see value in the market. Their demand tends to exceed the supply of those shorter term traders who drove the price of the asset down to the ribbon in the first place, causing the price to rally.
Well, that’s the way I think of it. Why the price of any security the long term uptrend ribbon is plotted ever appears to act a zone of excess demand (think “support” in typical technical analysis parlance!) — is pure coincidence. It just is. And that’s good enough for me!
A decent little candle on Tuesday — the first since Friday due to Monday’s holiday.
But it is little — which means that although it’s white-bodied — it was hardly an emphatic demonstration of demand-side control. Add to this, the fact that is also has a smidge of an upward pointing shadow = lack of demand-side confidence into the close / supply-side still flexing its muscles… And add to that, a lack of convincing volume — indicating little interest in buying the dip, just as much as the general malaise in the market to do much of anything!
Here’s the bottom line: Is Tuesday’s candle the beginning of the next stonking explosion higher of the current Comp bull market? Or, is it a harbinger that the demand-side remains unengaged and the supply-side remains peskily vigilant?
The kicker is: Could be! Either, or both!
We don’t know. We can’t, because we can’t tell the future! 🔮
The best we can do is use our experience of this setup, seen over many years, to try to associate with it a set of probabilities vs outcomes.
More specifically, as trend followers, we want to determine which outcome is likely to occur MOTN (More Often Than Not). Here, I'll let you make up your own mind by looking at the chart above… and by using what I’ve taught you about D vs S = P.
Can I offer my probability outcome matrix (and I’d love to know your thoughts!!!):
25% Probability = Tuesday’s candle suggests the long term uptrend is doing its job, and therefore it marks the beginning of the next stonking explosion higher of the current Comp bull market! 💪💪
25% Probability = Tuesday’s candle is a harbinger that the demand-side remains unengaged, and supply remains peskily vigilant at least, the long term uptrend ribbon won’t hold up… the bull market’s days are numbered! ⚠️🚨
50% Probability = Tuesday’s candle likely doesn’t mean much about anything really, the Comp will probably bumble around, roughly sideways, at the long term uptrend ribbon — until we get a clear demand- or supply-side signal that tells us otherwise! ⚖️
View
Given my view on the above scenarios vs probabilities... How can I possibly be anywhere else but 1/2RP with respect to my US portfolio risk limit!? (RP = Risk Position — it reflects my personal allowable capital allocation limit for my investments in US stocks. So 1/2RP is 50%, 2/3RP is 67% and FRP is 100% 🪣).
Key levels
22461 is the critical point of demand — look at last night's candle — it's JUST hanging on!!! Let's now defer to 21898 as the key local go-no-go zone for the Comp. A close below 21898 implies the supply-side is control of the Comp's short term price. A close below the low of the long term uptrend ribbon (presently 21630-22465), implies the long term uptrend is likely under significant pressure = ⚠️. 23321 is the nearest critical static point supply, but the short term downtrend ribbon (presently 23155-23225) may also impede upside price action.
S&P/ASX 200 (XJO)
%20chart_18%20Feb.png)
Analysis
That’s a very decent candle. 🧐
It’s not huge… volume about average… still yet to recoup the damage inflicted by the clear supply-side showing of 13-Feb… but it’s decent.
As in, decent demand-side intent… plus a little urgency (high close, average volume)… and most importantly… it’s occurred in a place where it builds upon a growing picture of demand-side control (i.e., long term uptrend, short term uptrend ribbon intact, rising peaks and rising troughs, candles starting to swing predominantly more demand-side in nature).
I, for one, am taking today’s candle and the improving broader technical picture for the OTP seriously. I’d even go so far as to say: we’re on the brink of a new high here. I can feel it!
The 9110-9116 major point of supply has been tested once… no doubt some of the excess supply there was shaken loose in that 12-Feb push…
Surely then… there must be less of it to impede any subsequent push.
This could be our best chance since October to blast through — to do something meaningful… 🤞
But then you juxtapose the ASX 200’s, aka, the Old Tin Pot’s chart against the Comp’s less than ideal technicals (hey — it’s not like the OTP’s chart is perfect, either)… and one starts to feel far less assured…
So, can I go with quiet confidence here? Not hope. No — I’d never use the “H” word!!! 🙏
View
I am 2/3 RP 🪣 (i.e., my personal allowable capital allocation limit for my investments in Australian stocks is 67%). I am happy to move towards that level if I can find the risk among individual stocks to add.
Key levels
The short term uptrend ribbon (presently 8859-8897) is the closest zone of demand, a close below it would neutralise the present short term uptrend. 9110-9116 is the key zone of supply. Celebrations are on hold until the demand-side can consume the highly motivated supply that appears to be residing there.
***NEW VIDEO DROPPED —TOUR DE TECH-WRECK!!! 💥📺****
ChartWatch *LIVE* Webinar
ChartWatch *LIVE* Webinars – WEEKLY Wednesday's @ 12pm AEDT
Learn more about technical analysis and trend following through real case studies on ASX stocks. Australia's premier technical analyst, Carl Capolingua, shares his unique insights on stocks as requested by viewers. Ask about a company in your portfolio or anything related to trading and investing and get Carl's expert opinion.
Places are limited so >REGISTER NOW!<
Economy
Today
10:30 AUS February MI Leading Index
Result: -0.1% m/m vs +0.1% m/m in January
11:30 AUS December Quarter Wage Price Index
Result: +0.8% q/q vs +0.8% q/q forecast and +0.8% q/q in November
Later this week
Thursday
11:30 AUS February Employment Change (+20.1k m/m forecast vs +65.2k m/m in January)
11:30 AUS February Unemployment Rate (+4.2% forecast vs +4.1% in January)
Friday
12:30 USA Unemployment Claims (+229k w/w forecast vs +227k w/w previous)
Saturday
12:30 USA Advance GDP q/q (+2.8% p.a forecast vs +4.4% p.a. previous)
Latest News
Interesting Movers
Trading higher
+18.2% Superloop (SLC) – HY26 Results Presentation and Superloop Acquires Lightning Broadband.
+16.4% Hansen Technologies (HSN) – 1H26 Results Presentation, general strength across the broader Information Technology sector today.
+14.7% Southern Cross Electrical Engineering (SXE) – Investor Presentation - H1 FY26 Results, rise is consistent with prevailing short and long term uptrends, a regular in ChartWatch ASX Scans Uptrends list 🔎📈
+13.6% Netwealth Group (NWL) – 1H26 Results Presentation.
+13.5% Macmahon Holdings (MAH) – Continued positive response to 17-Feb Investor Presentation Half Year Results, rise is consistent with prevailing short and long term uptrends, a regular in ChartWatch ASX Scans Uptrends list 🔎📈
+12.2% Magellan Financial Group (MFG) – 2026 Interim Results Briefing.
+9.7% Appen (APX) – No news, general strength across the broader Information Technology sector today.
+9.5% Sunrise Energy Metals (SRL) – No news, general strength across the broader Critical Minerals sector today.
+9.0% Metallium (MTM) – No news, general strength across the broader Critical Minerals sector today.
+8.3% Peninsula Energy (PEN) – No news, general strength across the broader Uranium sector today.
+8.2% Technology One (TNE) – Guidance Upgrade-AI driving TNEs confidence in the future, general strength across the broader Information Technology sector today.
+7.7% Core Lithium (CXO) – No news, general strength across the broader Critical Minerals sector today.
+7.3% Catapult Sports (CAT) – No news, general strength across the broader Information Technology sector today.
+7.1% Silex Systems (SLX) – No news, general strength across the broader Uranium sector today.
+7.0% The Lottery Corp. (TLC) – Half Year Results Investor Presentation.
+6.8% Dexus (DXS) – HY26 Results presentation and On-market securities buyback, general strength across the broader Real Estate sector today.
+6.2% Liontown (LTR) – No news, general strength across the broader Critical Minerals sector today.
+6.2% Sims (SGM) – No news17-Feb 1H FY26 Results Presentation, rebounded after yesterday's sharp sell-off due to 1H FY26 Results Presentation.
+6.1% Nuix (NXL) – No news, general strength across the broader Information Technology sector today.
+6.0% Medibank Private (MPL) – No news, general strength across the broader Information Technology sector today.
+5.7% Nickel Industries (NIC) – No news, rise is consistent with prevailing short and long term uptrends, a regular in ChartWatch ASX Scans Uptrends list 🔎📈
+5.7% Mirvac Group (MGR) – MGR 1H26 Results Presentation, general strength across the broader Real Estate sector today.
+5.6% Paladin Energy (PDN) – No news, general strength across the broader Uranium sector today.
+5.4% Hub24 (HUB) – No news, general strength across the broader Information Technology sector today.
Trading lower
-14.0% (CSC) – Capstone Copper Announces 2026 Guidance, general weakness across the broader Base Metals sector today.
-6.7% Healius (HLS) – Half Year 2026 Results Presentation.
-6.4% Alkane Resources (ALK) – No news, general weakness across the broader Gold sector today, pulled back in the wake of recent sharp rally.
-4.4% Suncorp Group (SUN) – HY26 Results Presentation, fall is consistent with prevailing short and long term downtrends, a regular in ChartWatch ASX Scans Downtrends list 🔎📉
-3.4% Reliance Worldwide Corp. (RWC) – Continued negative response to 17-Feb RWC Interim Results Presentation, fall is consistent with prevailing short and long term downtrends, a regular in ChartWatch ASX Scans Downtrends list 🔎📉
-2.7% Seek (SEK) – Continued negative response to 17-Feb FY2026 Half Year Results Presentation and Ceasing to be a substantial holder (Blackrock Group), fall is consistent with prevailing short and long term downtrends, a regular in ChartWatch ASX Scans Downtrends list 🔎📉
Broker Moves
The a2 Milk Company (A2M)
Retained at buy at Citi; Price Target: $10.55 from $10.40
Australian Clinical Labs (ACL)
Retained at neutral at Macquarie; Price Target: $2.30 from $2.90
Abacus Storage King (ASK)
Retained at neutral at Citi; Price Target: $1.60 from $1.50
Retained at hold at Shaw and Partners; Price Target: $1.65
Baby Bunting Group (BBN)
Retained at buy at Citi; Price Target: $4.20 from $3.52
Upgraded to outperform from neutral at Macquarie; Price Target: $3.30 from $3.15
Retained at overweight at Morgan Stanley; Price Target: $3.60
Retained at hold at Morgans; Price Target: $2.60 from $2.70
Upgraded to accumulate from hold at Ord Minnett; Price Target: $2.80 from $2.95
Retained at sector perform at RBC Capital Markets; Price Target: $2.60
Bendigo and Adelaide Bank (BEN)
Retained at sell at Citi; Price Target: $10.50 from $10.25
Bellevue Gold (BGL)
Retained at outperform at Macquarie; Price Target: $2.10
BHP Group (BHP)
Retained at neutral at Barrenjoey; Price Target: $54.00 from $51.00
Retained at outperform at CLSA; Price Target: $56.00 from $52.50
Retained at overweight at JPMorgan; Price Target: $58.00 from $56.00
Retained at neutral at Macquarie; Price Target: $52.00 from $51.00
Retained at overweight at Morgan Stanley; Price Target: $55.50
Retained at accumulate at Ord Minnett; Price Target: $54.00 from $51.00
Retained at sector perform at RBC Capital Markets; Price Target: $55.00 from $51.00
Retained at neutral at UBS; Price Target: $52.00 from $47.00
Challenger (CGF)
Retained at outperform at CLSA; Price Target: $8.85 from $9.00
Retained at buy at Goldman Sachs; Price Target: $9.00
Retained at overweight at JPMorgan; Price Target: $10.00
Retained at outperform at Macquarie; Price Target: $10.00
Retained at equal-weight at Morgan Stanley; Price Target: $8.70
Deterra Royalties (DRR)
Retained at neutral at Barrenjoey; Price Target: $4.70 from $4.60
Retained at outperform at Macquarie; Price Target: $4.70
Dexus (DXS)
Retained at neutral at UBS; Price Target: $7.34
Golden Horse Minerals (GHM)
Retained at buy at Shaw and Partners; Price Target: $1.50
GPT Group (GPT)
Retained at accumulate at Ord Minnett; Price Target: $5.35
HealthCo Healthcare and Wellness REIT (HCW)
Retained at buy at Bell Potter; Price Target: $0.95 from $1.00
Retained at neutral at Macquarie; Price Target: $0.77 from $0.79
Retained at underweight at Morgan Stanley; Price Target: $0.73 from $0.89
Upgraded to speculative buy from hold at Morgans; Price Target: $1.05 from $0.75
Hansen Technologies (HSN)
Retained at buy at UBS; Price Target: $7.50
Judo Capital Holdings (JDO)
Retained at buy at Goldman Sachs; Price Target: $2.18 from $2.14
Retained at buy at Jefferies; Price Target: $2.33 from $2.29
Retained at overweight at JPMorgan; Price Target: $2.25
Retained at outperform at Macquarie; Price Target: $2.05 from $2.00
Retained at overweight at Morgan Stanley; Price Target: $2.20
Downgraded to accumulate from buy at Morgans; Price Target: $2.09 from $2.02
Retained at buy at Ord Minnett; Price Target: $2.40 from $2.20
Retained at buy at UBS; Price Target: $2.25 from $2.20
Kinatico (KYP)
Retained at buy at Bell Potter; Price Target: $0.40 from $0.45
Retained at buy at Shaw and Partners; Price Target: $0.46
Lotus Resources (LOT)
Initiated at outperform at Macquarie; Price Target: $3.00 from $3.22
Mirvac Group (MGR)
Retained at neutral at UBS; Price Target: $2.15
Medibank Private (MPL)
Retained at neutral at Macquarie; Price Target: $4.90
National Australia Bank (NAB)
Retained at buy at UBS; Price Target: $47.00
NIB Holdings (NHF)
Retained at underperform at Macquarie; Price Target: $6.10
Netwealth Group (NWL)
Retained at neutral at UBS; Price Target: $28.50
Qualitas (QAL)
Retained at outperform at Macquarie; Price Target: $4.16 from $4.04
Reliance Worldwide Corporation (RWC)
Retained at neutral at Citi; Price Target: $3.90 from $4.25
Retained at outperform at CLSA; Price Target: $4.70 from $5.30
Retained at positive at E&P; Price Target: $4.90 from $5.40
Downgraded to neutral from overweight at Jarden; Price Target: $3.80 from $4.47
Retained at neutral at JPMorgan; Price Target: $3.75 from $4.10
Retained at outperform at Macquarie; Price Target: $4.75 from $5.20
Retained at hold at Ord Minnett; Price Target: $4.00 from $4.55
Retained at neutral at UBS; Price Target: $3.90 from $4.15
South32 (S32)
Retained at overweight at Barrenjoey; Price Target: $5.10
SEEK (SEK)
Retained at outperform at CLSA; Price Target: $27.00
Retained at buy at Jarden; Price Target: $25.00 from $29.80
Retained at outperform at Macquarie; Price Target: $19.50 from $32.50
Retained at overweight at Morgan Stanley; Price Target: $28.00 from $32.50
Upgraded to buy from accumulate at Morgans; Price Target: $27.50
Retained at buy at UBS; Price Target: $24.30 from $27.20
Sims (SGM)
Retained at neutral at E&P; Price Target: $21.56 from $19.80
Retained at underweight at Jarden; Price Target: $19.50 from $18.50
Retained at overweight at JPMorgan; Price Target: $24.00 from $22.00
Retained at outperform at Macquarie; Price Target: $22.80 from $18.10
Retained at sector perform at RBC Capital Markets; Price Target: $23.00 from $20.50
Retained at buy at UBS; Price Target: $26.50 from $25.00
Stockland (SGP)
Retained at neutral at UBS; Price Target: $5.79 from $5.82
Select Harvests (SHV)
Retained at buy at Bell Potter; Price Target: $5.30 from $5.80
Superloop (SLC)
Retained at buy at UBS; Price Target: $3.40
Smart Parking (SPZ)
Retained at buy at Shaw and Partners; Price Target: $1.55 from $1.50
SRG Global (SRG)
Retained at buy at Bell Potter; Price Target: $3.15 from $3.00
Retained at buy at Shaw and Partners; Price Target: $3.15
Suncorp Group (SUN)
Retained at buy at UBS; Price Target: $20.55
Technology One (TNE)
Retained at buy at UBS; Price Target: $38.70
Vicinity Centres (VCX)
Retained at buy at UBS; Price Target: $2.80
Woodside Energy Group (WDS)
Retained at neutral at Citi; Price Target: $26.50 from $25.50
Retained at hold at Ord Minnett; Price Target: $24.00 from $23.25
Scans
Top Gainers
Code | Company | Last | % Chg |
|---|---|---|---|
| 4DS | 4DS Memory Ltd | $0.012 | +33.33% |
| PKY | Pathkey.Ai Ltd | $0.03 | +30.44% |
| IDT | IDT Australia Ltd | $0.054 | +25.58% |
| CZN | Corazon Mining Ltd | $0.185 | +23.33% |
| FTI | Fortifai Ltd | $0.41 | +22.39% |
Top Fallers
Code | Company | Last | % Chg |
|---|---|---|---|
| T88 | Taiton Resources Ltd | $0.093 | -22.50% |
| PL3 | Patagonia Lithium Ltd | $0.145 | -17.14% |
| DME | Dome Gold Mines Ltd | $0.075 | -16.67% |
| EWC | Energy World Corporation Ltd | $0.031 | -16.22% |
| GSN | Great Southern Mining Ltd | $0.031 | -16.22% |
52 Week Highs
Code | Company | Last | % Chg |
|---|---|---|---|
| SBR | Sabre Resources Ltd | $0.015 | +15.39% |
| SXE | Southern Cross Electrical Engineering Ltd | $3.28 | +14.69% |
| KRR | King River Resources Ltd | $0.033 | +13.79% |
| MAH | Macmahon Holdings Ltd | $0.755 | +13.53% |
| SHA | Shape Australia Corporation Ltd | $7.34 | +12.58% |
52 Week Lows
Code | Company | Last | % Chg |
|---|---|---|---|
| DME | Dome Gold Mines Ltd | $0.075 | -16.67% |
| JGH | Jade Gas Holdings Ltd | $0.022 | -15.39% |
| WZR | Wisr Ltd | $0.023 | -14.82% |
| AXP | AXP Energy Ltd | $0.012 | -14.29% |
| 3PL | 3P Learning Ltd | $0.48 | -12.73% |
Near Highs
Code | Company | Last | % Chg |
|---|---|---|---|
| WVOL | iShares MSCI World Ex Aust Minimum Volatility ETF | $44.82 | -0.18% |
| IAGPF | Insurance Australia Group Ltd | $105.70 | +0.05% |
| GCI | Gryphon Capital Income Trust | $2.07 | -0.48% |
| VVLU | Vanguard Global Value Equity Active ETF | $81.60 | +0.29% |
| IHD | iShares S&P/ASX DIV Opportunities Esg Screened ETF | $17.06 | +0.65% |
Relative Strength Index (RSI) Oversold
Code | Company | Last | % Chg |
|---|---|---|---|
| IRE | Iress Ltd | $7.11 | +0.71% |
| HUGE | ETFs Magnificent 7+ ETF | $11.42 | +0.62% |
| CGFPC | Challenger Ltd | $100.70 | -0.25% |
| NDO | Nido Education Ltd | $0.425 | -2.30% |
| GAME | Betashares Video Games and Esports ETF | $14.99 | +0.60% |
