
News | Market Wraps
Evening Wrap: ASX 200 up as BHP hits record on profit beat, JB Hi-Fi adds 8.1% on broker upgrades, PME bounces 7.7%

Mentioned
The S&P/ASX 200 closed 21.8 points higher, up 0.24%.
The ASX 200 eked out a small gain after retreating from mid-day highs, as stronger results from BHP were offset by weakness across seven of the major sectors. Volumes were subdued with Wall Street closed for Presidents’ Day and Chinese markets shut for Lunar New Year.
BHP Group (BHP) (+4.7%) surged to a record high after a half-year profit beat, driven by strong copper earnings, and a 44% lift in its interim dividend to US$0.73. In contrast, Sims (SGM) (-4.0%) became the latest reporting season casualty after swinging to a half-year loss.
Information Technology (XIJ) (-0.3%) gave back some of Monday’s gains amid ongoing AI disruption jitters, led lower by WiseTech Global (WTC) (-1.6%) and NextDC (NXT) (-0.4%).
In stock specific news:
JB Hi-Fi (JBH) (+8.1%) extended its post-result rebound after broker upgrades.
Baby Bunting (BBN) (+8.6%) improved on tightened profit guidance.
Reliance Worldwide (RWC) (-9%) slid on a weaker first half and Seek (SEK) (-3.2%) flagged weaker volumes.
In Asian trade, Gold eased about 2% to US$4,878/oz, weighing on gold miners, as Northern Star Resources (NST) (-0.8%) and Evolution Mining (EVN) (-1.8%) retreated.
Be sure to click/scroll through for the usual reporting of the major sector and stock-specific moves, the broker responses to them, as well as all the key economic data in tonight's Evening Wrap.
Also, I have detailed technical analysis on the Nasdaq Composite and the S&P/ASX 200 in today's ChartWatch.
Let's dive in!
Today in Review
Tue 17 Feb 26, 5:05pm (AEST)
Name | Value | % Chg |
|---|---|---|
Major Indices | ||
| ASX 200 | 8,958.9 | +0.24% |
| All Ords | 9,182.5 | +0.20% |
| Small Ords | 3,641.1 | -0.38% |
| All Tech | 2,732.9 | -0.23% |
| Emerging Companies | 3,075.8 | -0.17% |
Currency | ||
| AUD/USD | 0.706 | -0.17% |
US Futures | ||
| S&P 500 | 6,818.5 | -0.47% |
| Dow Jones | 49,403.0 | -0.33% |
| Nasdaq | 24,605.5 | -0.80% |
Name | Value | % Chg |
|---|---|---|
Sector | ||
| Materials | 23,488.9 | +1.28% |
| Consumer Discretionary | 3,949.7 | +0.55% |
| Consumer Staples | 12,106.6 | +0.30% |
| Health Care | 29,731.1 | +0.07% |
| Financials | 9,804.5 | -0.01% |
| Utilities | 10,031.7 | -0.11% |
| Communication Services | 1,649.1 | -0.27% |
| Industrials | 8,397.4 | -0.36% |
| Information Technology | 1,720.0 | -0.37% |
| Energy | 9,095.4 | -0.41% |
| Real Estate | 3,767.6 | -0.99% |
Markets
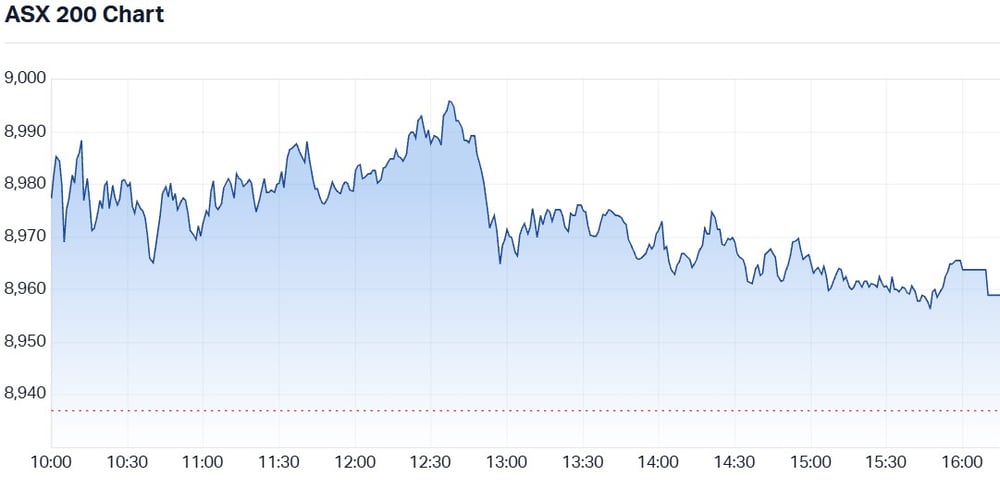
ASX 200 Session Chart
The S&P/ASX 200 (XJO) finished 21.8 points higher at 8,937.1, 0.24% from its session low and 0.42% from its high. In the broader-based S&P/ASX 300 (XKO) decliners beat advancers by 149 to 130.
Fund flows: Long live noise. Long live uncertainty! 😱
As much as it was a snoozefest, I reckon today is the first “normal” day we’ve had in about 10 — that is, without several of the major sectors logging a +5% move!
I’ve been doing this for a very long time. I cannot remember a period, outside of when there have been clear existential threats to markets like during COVID or the GFC, where there have been so many massive up / down moves in individual stocks — day after day — for weeks now.
I’m seeing moves of +/- 10, 20, 30% as standard in the top-half-dozen of the best / worst tables in the “Interesting Moves” section below.
It’s not normal. Okay… obviously, yep, those are pretty big moves… so, to say, “that’s not normal”, well, this is a given.
But seriously, in the absence of a “one clear thing that’s threatening to blow markets to pieces” — ladies and gentlemen — it’s just not normal!
So, my question is this: Is there a "one clear thing that’s threatening to blow markets to pieces — that we’re just not aware of yet?" But, that the biggest, smartest fund managers are aware of? 🤔
Well, we’re getting massive moves up and down… so if that was the case, then those driving the up-moves clearly aren’t aware of any looming existential threat… Right?
And if there isn’t a “looming existential threat” that’s about to rear its ugly head, then is the madness of the markets over the last few weeks “just the new normal”? It is a function of the fact that markets move purely on fund flows, i.e., weight of money, and not on the real, underlying fundamentals? 🤷
So, we see pushes in a particular direction, until, eventually, something snaps a market back to reality (think gold and silver… or any of the commodities recently, tech/software vs AI, banks etc.). Leverage, algorithms, sentiment, social media… flooding a particular narrative with liquidity… resulting in exacerbated price moves… and then after a catalyst that triggers an unwind, the same markets are dominated by forced liquidation.
It’s what I’m seeing. It’s my hunch. But it’s also reassuring.
Fund flows create trends. Wonderful... powerful... followable... trends! 😍
Thank the maker that I’m a technical analyst. More specifically: one that only ever follows the trend, and one that has a total and utter focus on risk management. 🙏
The rest is noise. Long live noise. Long live uncertainty. Long live markets! 💪
Stock Specific: Ugly chart, but kudos to you BHP! 👏
%20monthly%20chart%20a%20at%2017%20Feb%202026.png)
BHP Group (BHP) monthly chart. Observation: Where's all the volume gone!? 🤔
BHP monthly chart above. It ain’t pretty… but it’s a record, nonetheless! 🥳
What this chart shows is just how volatile a so-called “blue chip” like BHP is, and how there are periods of many years when it’s either not doing very much, or it’s plain going down. 📉
This chart doesn’t have dividends, and if we were to add those back, we would likely see a steadier performance.
Still, we would also likely see that there remain substantial periods of good times and not so good times to be invested in what has usually been the ASX’s biggest stock.
Today's best blue chip gainers
Company | Last Price | Change $ | Change % | 1mo % | 1yr % |
|---|---|---|---|---|---|
JB HI-FI (JBH) | $89.10 | +$6.7 | +8.1% | -0.9% | -11.7% |
Pro Medicus (PME) | $125.96 | +$8.99 | +7.7% | -37.9% | -55.4% |
The A2 Milk Company (A2M) | $9.67 | +$0.57 | +6.3% | +2.9% | +35.8% |
BHP Group (BHP) | $52.74 | +$2.38 | +4.7% | +7.7% | +29.3% |
Aurizon Holdings (AZJ) | $3.94 | +$0.1 | +2.6% | +9.1% | +24.3% |
Telix Pharmaceuticals (TLX) | $8.84 | +$0.21 | +2.4% | -23.0% | -67.7% |
Steadfast Group (SDF) | $4.36 | +$0.1 | +2.3% | -17.6% | -22.7% |
Hub24 (HUB) | $81.83 | +$1.75 | +2.2% | -16.9% | +0.6% |
Technology One (TNE) | $21.72 | +$0.42 | +2.0% | -20.3% | -32.0% |
Bendigo and Adelaide Bank (BEN) | $11.37 | +$0.17 | +1.5% | +5.0% | 0% |
Qantas Airways (QAN) | $10.56 | +$0.14 | +1.3% | +1.7% | +17.0% |
QBE Insurance Group (QBE) | $19.82 | +$0.25 | +1.3% | -0.2% | -1.4% |
Dyno Nobel (DNL) | $3.31 | +$0.04 | +1.2% | -3.5% | +16.1% |
Pinnacle Investment Management (PNI) | $16.10 | +$0.15 | +0.9% | -11.2% | -37.0% |
Mineral Resources (MIN) | $52.02 | +$0.42 | +0.8% | -13.0% | +60.2% |
AMP (AMP) | $1.395 | +$0.01 | +0.7% | -23.4% | -1.8% |
Orica (ORI) | $25.89 | +$0.18 | +0.7% | -0.6% | +51.0% |
South32 (S32) | $4.44 | +$0.03 | +0.7% | +6.7% | +20.3% |
Netwealth Group (NWL) | $22.32 | +$0.15 | +0.7% | -13.0% | -28.6% |
Macquarie Group (MQG) | $218.36 | +$1.35 | +0.6% | +3.1% | -7.9% |
Today's worst blue chip losers
Company | Last Price | Change $ | Change % | 1mo % | 1yr % |
|---|---|---|---|---|---|
Lynas Rare Earths (LYC) | $15.05 | -$0.88 | -5.5% | -2.8% | +120.4% |
Treasury Wine Estates (TWE) | $4.74 | -$0.23 | -4.6% | -13.7% | -54.9% |
Computershare (CPU) | $30.59 | -$1.1 | -3.5% | -13.5% | -28.8% |
Seek (SEK) | $16.54 | -$0.56 | -3.3% | -27.6% | -31.7% |
Stockland (SGP) | $5.12 | -$0.17 | -3.2% | -6.6% | -5.4% |
Genesis Minerals (GMD) | $7.17 | -$0.21 | -2.8% | -1.8% | +124.8% |
Challenger (CGF) | $8.22 | -$0.2 | -2.4% | -10.1% | +34.1% |
Light & Wonder (LNW) | $140.19 | -$2.81 | -2.0% | -22.3% | -8.5% |
Evolution Mining (EVN) | $14.91 | -$0.28 | -1.8% | +13.6% | +140.1% |
Perseus Mining (PRU) | $5.62 | -$0.1 | -1.7% | -3.6% | +102.2% |
Ramelius Resources (RMS) | $4.51 | -$0.08 | -1.7% | -0.7% | +71.5% |
Fisher & Paykel Healthcare Corp. (FPH) | $30.57 | -$0.53 | -1.7% | -8.6% | -5.0% |
Wisetech Global (WTC) | $47.34 | -$0.77 | -1.6% | -29.4% | -61.7% |
IGO (IGO) | $8.15 | -$0.12 | -1.5% | -8.2% | +69.1% |
Goodman Group (GMG) | $30.76 | -$0.44 | -1.4% | -2.7% | -13.6% |
Bluescope Steel (BSL) | $28.00 | -$0.37 | -1.3% | -6.8% | +14.5% |
Ampol (ALD) | $28.34 | -$0.32 | -1.1% | -3.3% | +0.7% |
Ansell (ANN) | $32.13 | -$0.35 | -1.1% | -5.6% | -10.5% |
Insurance Australia Group (IAG) | $6.86 | -$0.07 | -1.0% | -10.0% | -9.6% |
Whitehaven Coal (WHC) | $8.51 | -$0.08 | -0.9% | -4.2% | +51.4% |
ChartWatch
Nasdaq Composite Index
Analysis
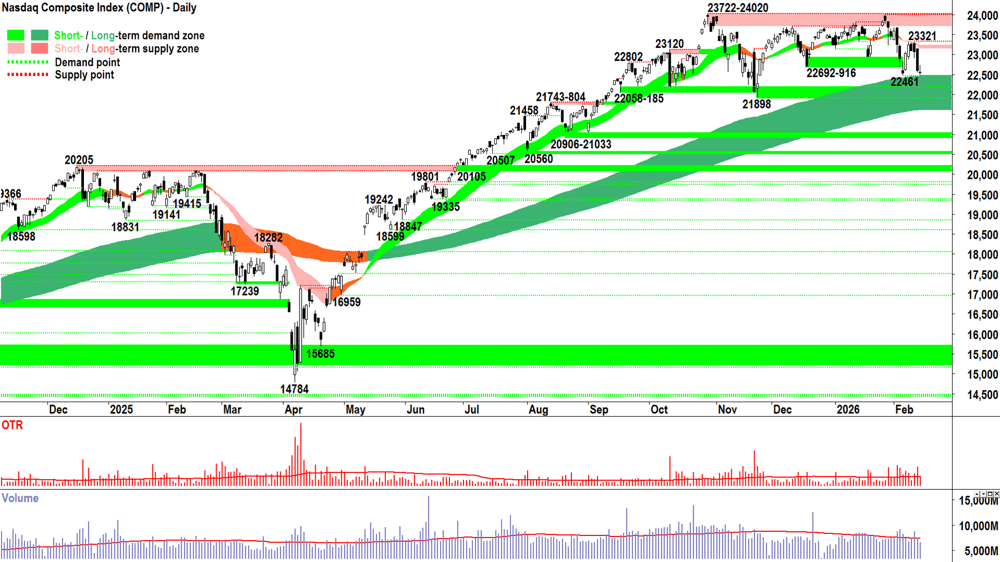
No change from yesterday's analysis due to the Presidents Day holiday in the US on Monday, February 16.
Trivia note: Presidents Day was established to honor the birthday of the nation's first president, George Washington. It's no doubt soon to be moved to June 14 and renamed "The Best President in the World, Probably in the History of Mankind Day" in honour of you know who! 😉
We are ditto as per previous analysis:
The demand-side looks very timid = ⚠️
The supply-side looks far more motivated and organised = ⚠️
22461 is a critical point of demand — on a close below it there can be no confusion about which side is in control of the Comp's short term price = ⚠️⚠️
21898 / the low of the long term uptrend ribbon (presently 21625-22465) is the critical point of no return for the long term uptrend = close below 21625 and the current bull market is very likely OVER = ⚠️⚠️⚠️
View
Still on the fence here… but rather comfortable with my position! I am at 1/2RP portfolio risk limit 🪣 (RP = Risk Position — it reflects my personal allowable capital allocation limit for my investments in US stocks. So 1/2RP is 50%, 2/3RP is 67% and FRP is 100%).
Key levels
22461 is the critical point of demand. If the Comp closes below that price, we can assume the supply side is very much in control. On a close below 21898 / the low of the long term uptrend ribbon (presently 21625-22465), the long term uptrend is likely under significant pressure = ⚠️. 23321 is the nearest critical static point supply, but the short term downtrend ribbon (presently 23155-23225) may also impede upside price action.
S&P/ASX 200 (XJO)
%20chart_17%20Feb.png)
Analysis
No Chinese funds (CNY holidays). No US funds (Presidents Day holiday). Arguably, that’s about as much as the Old Tin Pot was ever going to do today = little more than (another) blip! 👎
That means there's little more in terms of information conveyed to us about the balance / imbalance between demand and supply = appetite for risk vs appetite for cash. ⚖️
The status quo is:
Short term uptrend intact = rising peaks and rising troughs (i.e., supply removal and demand reinforcement); short term uptrend ribbon (i.e., light green, price is above ribbon, ribbon — if one squints very hard — is acting as a zone of dynamic demand); predominance of demand-side candles (i.e., white-bodied and or downward pointing shadows) — mainly on the back of monster candles of 9 & 11-Feb (but heeding some credible supply-side-dominant activity in candles of 12 & 13-Feb).
Long term uptrend intact = long term uptrend ribbon (i.e., dark green, price is above ribbon, ribbon is indeed doing a solid job of acting as a zone of dynamic demand).
Volatility = elevated over the last few weeks as prices have whip-sawed higher = grudging consensus! There remains a sub-set of the market that is highly sceptical about present valuations, and have been shown to supply with substantial motivation — just as much as there remains a dedicated demand-side cohort, that for now, appears ready to soak up that supply…
Volume = benign… nothing looks too species ending one way or the other there…
Let’s review tomorrow when we have something more solid to go on, i.e., when we see what US markets have done, and therefore we have a template to follow!
View
I am 2/3 RP 🪣 (i.e., my personal allowable capital allocation limit for my investments in Australian stocks is 67%). I think, however, that we can cool it on the addition of any new long-side risk until the ASX 200's technical picture is decidedly more demand-side controlled in nature.
Key levels
The short term uptrend ribbon (presently 8843-8878) is the closest zone of demand, a close below it would neutralise the present short term uptrend. 9110-9116 is the key zone of supply. Celebrations are on hold until the demand-side can consumer the highly motivated supply that appears to be residing there.
ChartWatch *LIVE* Webinar
ChartWatch *LIVE* Webinars – WEEKLY Wednesday's @ 12pm AEDT
Learn more about technical analysis and trend following through real case studies on ASX stocks. Australia's premier technical analyst, Carl Capolingua, shares his unique insights on stocks as requested by viewers. Ask about a company in your portfolio or anything related to trading and investing and get Carl's expert opinion.
Places are limited so >REGISTER NOW!<
Economy
Today
11:30 AUS Monetary Policy Meeting Minutes
Members agreed that the data received since the previous meeting had strengthened their concern that, without a policy response, inflation would remain persistently above target for too long.
Later this week
Wednesday
10:30 AUS February MI Leading Index (+0.8% m/m forecast vs +0.1% m/m in January)
11:30 AUS February Wage Price Index (+0.8% q/q forecast vs +0.8% q/q in November)
Thursday
11:30 AUS February Employment Change (+20.1k m/m forecast vs +65.2k m/m in January)
11:30 AUS February Unemployment Rate (+4.2% forecast vs +4.1% in January)
Friday
12:30 USA Unemployment Claims (+229k w/w forecast vs +227k w/w previous)
Saturday
12:30 USA Advance GDP q/q (+2.8% p.a forecast vs +4.4% p.a. previous)
Latest News
Interesting Movers
Trading higher
+13.7% Electro Optic Systems Holdings (EOS) – No news, bounced perfectly from long term uptrend ribbon! 🔎📈
+8.1% JB HI-FI (JBH) – Continued positive response to 16-Feb Results Presentation - 2026 Half Year Results, rating upgraded by Jarden, Morgans, and UBS (see Broker Moves) .
+7.7% Pro Medicus (PME) – No news since 16-Feb HY26 Results Presentation, bounced in the wake of the recent sharp selloff.
+7.0% Audinate Group (AD8) – No news since 16-Feb 2026 Half Year Results Presentation, bounced in the wake of the recent sharp selloff.
+6.3% The A2 Milk Company (A2M) – Continued positive response to 16-Feb 1H26 Results Presentation.
+4.8% Pexa Group (PXA) – Continued positive response to 16-Feb Outcome of Digital Solutions Strategic Review.
+4.7% BHP Group (BHP) – HY2026 Results Presentation.
+4.7% Macmahon Holdings (MAH) – Interim Financial Report.
Trading lower
-9.6% (SMI) – A$130 million Placement and Share Purchase Plan.
-9.1% Reliance Worldwide Corp. (RWC) – RWC Interim Results Presentation, fall is consistent with prevailing short and long term downtrends, a regular in ChartWatch ASX Scans Downtrends list 🔎📉
-5.5% Lynas Rare Earths (LYC) – No news, general weakness across the broader Critical Minerals sector today.
-5.1% SRG Global (SRG) – 1H FY26 Half Year Results Presentation.
-4.7% Black Cat Syndicate (BC8) – High-grade Antimony Results Continue - Mt Clement.
-4.6% Treasury Wine Estates (TWE) – Continued negative response to 16-Feb Appendix 4D and 2026 Interim Results, fall is consistent with prevailing short and long term downtrends, one of the most Featured (highest conviction) stocks in ChartWatch ASX Scans Downtrends list 🔎📉
-4.0% Sims (SGM) – 1H FY26 Results Presentation.
Broker Moves
Australian Clinical Labs (ACL)
Downgraded to neutral from buy at Bank of America; Price Target: $2.80 from $3.60
Downgraded to hold from buy at Canaccord Genuity; Price Target: $2.40 from $3.85
Retained at positive at E&P; Price Target: $3.17 from $3.85
Retained at neutral at Goldman Sachs; Price Target: $2.42 from $2.93
Retained at sector perform at RBC Capital Markets; Price Target: $2.40 from $2.80
Audinate Group (AD8)
Retained at buy at Canaccord Genuity; Price Target: $7.50 from $8.50
Retained at outperform at CLSA; Price Target: $7.40 from $8.90
Upgraded to neutral from underperform at Macquarie; Price Target: $3.20 from $4.30
Upgraded to buy from hold at Shaw and Partners; Price Target: $4.90
Retained at buy at UBS; Price Target: $6.10 from $7.10
Ansell (ANN)
Upgraded to outperform from hold at CLSA; Price Target: $36.00 from $37.00
Retained at equal-weight at Morgan Stanley; Price Target: $34.40 from $36.70
Retained at outperform at RBC Capital Markets; Price Target: $41.00
Retained at neutral at UBS; Price Target: $35.60 from $36.00
Aurizon Holdings (AZJ)
Downgraded to neutral from buy at Goldman Sachs; Price Target: $3.80 from $3.55
Upgraded to overweight from neutral at Jarden; Price Target: $3.90 from $3.45
Retained at hold at Jefferies; Price Target: $3.81 from $3.74
Downgraded to neutral from outperform at Macquarie; Price Target: $3.91 from $3.77
Retained at sector perform at RBC Capital Markets; Price Target: $3.70
Downgraded to sell from neutral at UBS; Price Target: $3.50 from $3.25
Bendigo and Adelaide Bank (BEN)
Retained at neutral at Jarden; Price Target: $11.00
Retained at hold at Jefferies; Price Target: $9.64 from $9.51
Retained at neutral at JPMorgan; Price Target: $10.50 from $10.30
BlueScope Steel (BSL)
Retained at positive at E&P; Price Target: $31.27 from $32.55
Retained at buy at Jefferies; Price Target: $35.00 from $37.00
Retained at overweight at JPMorgan; Price Target: $33.50 from $34.00
Retained at outperform at RBC Capital Markets; Price Target: $31.00 from $29.50
Golden Horse Minerals (GHM)
Retained at speculative buy at Canaccord Genuity; Price Target: $1.50
Genesis Minerals (GMD)
Retained at buy at Argonaut Securities; Price Target: $13.00
Retained at buy at Euroz Hartleys; Price Target: $7.24
Retained at buy at UBS; Price Target: $10.75 from $10.00
GPT Group (GPT)
Upgraded to outperform from neutral at Macquarie; Price Target: $5.70 from $5.55
GWA Group (GWA)
Downgraded to neutral from outperform at Macquarie; Price Target: $2.65 from $2.90
JB Hi-Fi (JBH)
Retained at hold at CLSA; Price Target: $84.60 from $103.80
Upgraded to overweight from neutral at Jarden; Price Target: $88.90 from $96.80
Upgraded to hold from trim at Morgans; Price Target: $87.00 from $95.00
Upgraded to buy from neutral at UBS; Price Target: $94.00
New Hope Corporation (NHC)
Downgraded to sell from buy at Bell Potter; Price Target: $4.10 from $4.00
Downgraded to hold from accumulate at Morgans; Price Target: $5.00 from $4.55
Oohmedia (OML)
Retained at buy at Canaccord Genuity; Price Target: $1.55 from $1.75
Retained at buy at Jefferies; Price Target: $1.50 from $1.65
Retained at overweight at JPMorgan; Price Target: $1.45 from $1.65
Retained at overweight at Morgan Stanley; Price Target: $1.55 from $1.80
Retained at buy at UBS; Price Target: $1.50 from $1.75
Stockland (SGP)
Upgraded to outperform from neutral at Macquarie; Price Target: $5.42 from $5.45
Treasury Wine Estates (TWE)
Retained at neutral at Jarden; Price Target: $5.00 from $5.40
Retained at neutral at JPMorgan; Price Target: $5.30 from $5.20
Retained at sector perform at RBC Capital Markets; Price Target: $5.70
Scans
Top Gainers
Code | Company | Last | % Chg |
|---|---|---|---|
| KRR | King River Resources Ltd | $0.029 | +31.82% |
| C1X | Cosmos Exploration Ltd | $0.11 | +29.41% |
| TM1 | Terra Metals Ltd | $0.42 | +21.74% |
| FLG | Flagship Minerals Ltd | $0.285 | +18.75% |
| ELT | Elementos Ltd | $0.415 | +18.57% |
Top Fallers
Code | Company | Last | % Chg |
|---|---|---|---|
| BOT | Botanix Pharmaceuticals Ltd | $0.066 | -41.33% |
| G1C | Group One Capital Ltd | $0.095 | -20.83% |
| CMD | Cassius Mining Ltd | $0.021 | -19.23% |
| TAT | Tartana Minerals Ltd | $0.038 | -19.15% |
| YUG | Yugo Metals Ltd | $0.04 | -18.37% |
52 Week Highs
Code | Company | Last | % Chg |
|---|---|---|---|
| KRR | King River Resources Ltd | $0.029 | +31.82% |
| C1X | Cosmos Exploration Ltd | $0.11 | +29.41% |
| TM1 | Terra Metals Ltd | $0.42 | +21.74% |
| FLG | Flagship Minerals Ltd | $0.285 | +18.75% |
| TG1 | Techgen Metals Ltd | $0.066 | +11.86% |
52 Week Lows
Code | Company | Last | % Chg |
|---|---|---|---|
| BOT | Botanix Pharmaceuticals Ltd | $0.066 | -41.33% |
| OLH | Oldfields Holdings Ltd | $0.012 | -14.29% |
| HYT | Hyterra Ltd | $0.014 | -12.50% |
| NFL | Norfolk Metals Ltd | $0.10 | -9.09% |
| RWC | Reliance Worldwide Corporation Ltd | $3.50 | -9.09% |
Near Highs
Code | Company | Last | % Chg |
|---|---|---|---|
| WVOL | iShares MSCI World Ex Aust Minimum Volatility ETF | $44.90 | +0.13% |
| IAGPF | Insurance Australia Group Ltd | $105.65 | +0.24% |
| GCI | Gryphon Capital Income Trust | $2.08 | +0.48% |
| VVLU | Vanguard Global Value Equity Active ETF | $81.36 | -0.17% |
| IHD | iShares S&P/ASX DIV Opportunities Esg Screened ETF | $16.95 | +0.47% |
Relative Strength Index (RSI) Oversold
Code | Company | Last | % Chg |
|---|---|---|---|
| CMA | Carma Ltd | $1.415 | -4.07% |
| XYZ | Block, Inc | $70.47 | -0.30% |
| JPEQ | Jpmorgan US 100Q Equity Premium Income Active ETF | $57.30 | -0.75% |
| FANG | Global X Fang+ ETF | $29.15 | -0.95% |
| ETHI | Betashares Global Sustainability Leaders ETF | $15.22 | -0.26% |
