News | Market Wraps
Evening Wrap: ASX 200 flat, tech stocks extend gains, CSL dumps 5% as CEO jumps ship
The S&P/ASX 200 closed 2.7 points lower, down -0.03%.

Mentioned
The S&P/ASX 200 closed 2.7 points lower, down -0.03%.
The ASX 200 eased after Monday’s relief rally, fading off the highs. Attention now turns to a heavier flow of company earnings later this week.
Information Technology (XIJ) (+2.1%) rebounded as beaten down software and data centre names attracted fresh demand, led by WiseTech Global (WTC) (+2.6%) and NextDC (NXT) (+3.3%).
Health Care (XHJ) (-1.7%) was the main drag, after CSL (-4.9%) tumbled on announcement of CEO Paul McKenzie's retirement. Financials (XFJ) (-1.0%) lagged behind, also, as banks eased and insurers were hit over AI fears. Steadfast Group (SDF) (-9.4%) and AUB Group (-6.1%) were the key drags.
In stock specific news, Macquarie Group (MQG) (-0.3%) firmed after a strong December quarter update and a better near-term outlook for its Commodities and Global Markets unit.
Treasury Wine Estates (TWE) (+3.4%) jumped after settling its US distributor dispute and upgrading first-half earnings guidance. G8 Education (GEM) (-20.6%) slumped after flagging a $350m impairment and cancelling its buyback and final dividend.
Spot silver eased about 2%, but silver stocks still pushed higher, led by Investigator Resources (IVR) (+8.7%) and Silver Mines (SVL) (+4.3%).
Uranium edged 2% higher, but local uranium stocks generally fared much better, with Paladin Energy (PDN) up +5.4% (after dropping -18% in the last two sessions!).
Be sure to click/scroll through for the usual reporting of the major sector and stock-specific moves, the broker responses to them, as well as all the key economic data in tonight's Evening Wrap.
Also, I have detailed technical analysis on the Nasdaq Composite and the S&P/ASX 200 in today's ChartWatch.
Let's dive in!
Today in Review
Tue 10 Feb 26, 5:30pm (AEST)
Name | Value | % Chg |
|---|---|---|
Major Indices | ||
| ASX 200 | 8,886.9 | +0.19% |
| All Ords | 9,157.6 | +0.29% |
| Small Ords | 3,743.2 | +1.20% |
| All Tech | 2,958.0 | +2.22% |
| Emerging Companies | 3,170.4 | +1.69% |
Currency | ||
| AUD/USD | 0.7065 | -0.41% |
US Futures | ||
| S&P 500 | 6,979.25 | -0.06% |
| Dow Jones | 50,205.0 | -0.03% |
| Nasdaq | 25,317.75 | -0.14% |
Name | Value | % Chg |
|---|---|---|
Sector | ||
| Information Technology | 1,822.1 | +2.14% |
| Health Care | 34,293.0 | +1.35% |
| Consumer Discretionary | 4,004.6 | +0.89% |
| Materials | 23,161.3 | +0.86% |
| Industrials | 8,407.7 | +0.79% |
| Communication Services | 1,669.6 | +0.68% |
| Energy | 9,322.6 | +0.65% |
| Real Estate | 3,817.8 | +0.38% |
| Consumer Staples | 11,932.9 | +0.19% |
| Utilities | 9,297.6 | -0.83% |
| Financials | 9,322.1 | -1.06% |
Markets
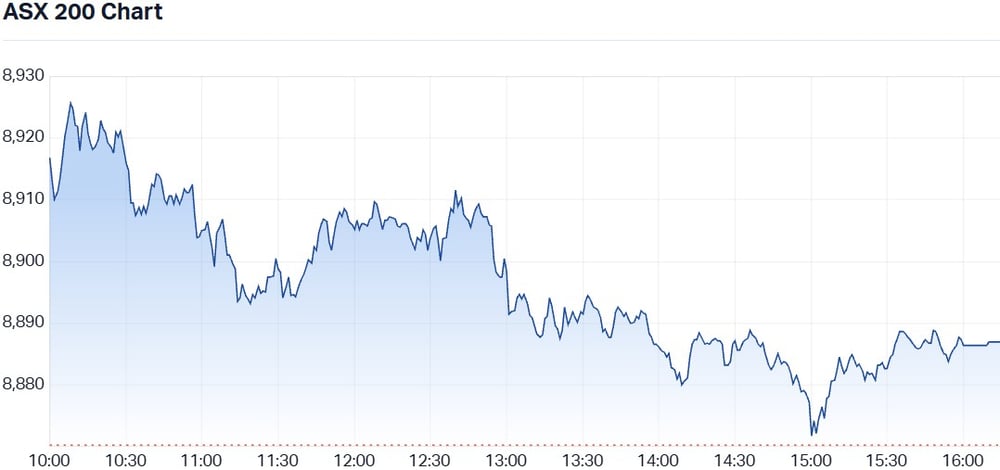
ASX 200 Session Chart
The S&P/ASX 200 (XJO) finished 2.7 points lower at 8,867.4, 0% from its session low and 0.66% from its session high. In the broader-based S&P/ASX 300 (XKO), advancers beat decliners by a 174 to 101.
Fund flows: Old or bold? 🤔
Of the 500-odd of you who responded to yesterday's quiz, roughly three-quarters took the easy way out, and like me, confessed that they have “no bloody idea” where the ASX 200, aka the Old Tin Pot, is headed next. Of the rest, you were perfectly evenly split between the OTP being substantially higher or lower over the next few weeks. ⚖️
So, 75% of us have no idea, and of the other 25%, let’s just say… net-net… they have no idea either!
I would love to do a similar survey of fund managers. I reckon there’d be far fewer in the “no bloody idea” camp — because let’s face it — it’s their job to at least believe they know where the market is headed next… but that the result might also be rather even between the up and down camps.
There’s certainly a few moving parts at play in markets the moment, and I think we can all be forgiven for being less than certain about the next big move prices. I’m reminded of an old saying taught to me by a trading mentor many years ago: “Always remember Carl: There are old traders. There are bold traders. But there are no old, bold traders!”
I’m very happy being a constituent of the first camp! 🧓
Today's best blue chip gainers
Company | Last Price | Change $ | Change % | 1mo % | 1yr % |
|---|---|---|---|---|---|
REA Group (REA) | $174.87 | +$7.75 | +4.6% | -6.2% | -31.4% |
Pro Medicus (PME) | $167.66 | +$6.49 | +4.0% | -20.2% | -41.8% |
Seek (SEK) | $18.72 | +$0.65 | +3.6% | -19.4% | -18.9% |
Treasury Wine Estates (TWE) | $5.35 | +$0.18 | +3.5% | +3.5% | -49.6% |
Nextdc (NXT) | $13.78 | +$0.45 | +3.4% | +9.9% | -9.0% |
Life360 (360) | $26.51 | +$0.77 | +3.0% | -18.1% | +13.4% |
ALS (ALQ) | $24.15 | +$0.69 | +2.9% | +6.2% | +49.5% |
SGH (SGH) | $49.15 | +$1.38 | +2.9% | +3.4% | +0.0% |
Genesis Minerals (GMD) | $7.06 | +$0.19 | +2.8% | -3.2% | +113.3% |
Netwealth Group (NWL) | $24.30 | +$0.64 | +2.7% | -5.7% | -23.1% |
Ramsay Health Care (RHC) | $37.13 | +$0.95 | +2.6% | +5.0% | +10.5% |
Wisetech Global (WTC) | $50.59 | +$1.29 | +2.6% | -24.5% | -59.4% |
Worley (WOR) | $13.47 | +$0.33 | +2.5% | +3.0% | -7.1% |
Challenger (CGF) | $8.81 | +$0.21 | +2.4% | -3.5% | +43.3% |
AMP (AMP) | $1.715 | +$0.04 | +2.4% | -3.7% | -2.6% |
Ansell (ANN) | $32.91 | +$0.72 | +2.2% | -1.7% | -5.3% |
Light & Wonder (LNW) | $164.07 | +$3.57 | +2.2% | +6.1% | +16.9% |
Xero (XRO) | $84.76 | +$1.82 | +2.2% | -21.1% | -54.1% |
Washington H. Soul Pattinson (SOL) | $37.91 | +$0.81 | +2.2% | 0.0% | +12.7% |
Lynas Rare Earths (LYC) | $15.14 | +$0.32 | +2.2% | +7.4% | +135.1% |
Today's worst blue chip losers
Company | Last Price | Change $ | Change % | 1mo % | 1yr % |
|---|---|---|---|---|---|
Steadfast Group (SDF) | $4.50 | -$0.47 | -9.5% | -15.6% | -23.2% |
Insurance Australia Group (IAG) | $7.28 | -$0.48 | -6.2% | -9.2% | -18.2% |
CSL (CSL) | $171.39 | -$8.98 | -5.0% | -1.7% | -37.2% |
Suncorp Group (SUN) | $16.05 | -$0.71 | -4.2% | -8.1% | -19.7% |
QBE Insurance Group (QBE) | $19.69 | -$0.69 | -3.4% | -2.0% | -3.0% |
Orica (ORI) | $25.38 | -$0.65 | -2.5% | -2.5% | +47.0% |
ANZ Group Holdings (ANZ) | $36.71 | -$0.92 | -2.4% | +3.6% | +18.6% |
Westpac Banking Corp. (WBC) | $39.28 | -$0.73 | -1.8% | +3.6% | +15.5% |
The Lottery Corp. (TLC) | $5.17 | -$0.09 | -1.7% | +1.8% | +4.9% |
JB HI-FI (JBH) | $79.20 | -$1.19 | -1.5% | -14.8% | -21.7% |
Origin Energy (ORG) | $10.99 | -$0.14 | -1.3% | -3.3% | +8.4% |
James Hardie Industries (JHX) | $33.24 | -$0.39 | -1.2% | +2.5% | -38.2% |
Block (XYZ) | $80.65 | -$0.86 | -1.1% | -23.0% | -41.8% |
Fortescue (FMG) | $21.57 | -$0.21 | -1.0% | -5.0% | +11.4% |
Sigma Healthcare (SIG) | $3.09 | -$0.03 | -1.0% | +6.9% | +9.2% |
Dyno Nobel (DNL) | $3.35 | -$0.03 | -0.9% | -1.2% | +11.7% |
Whitehaven Coal (WHC) | $9.08 | -$0.08 | -0.9% | +16.0% | +46.0% |
Brambles (BXB) | $22.97 | -$0.19 | -0.8% | +1.1% | +17.1% |
Amcor PLC (AMC) | $68.40 | -$0.55 | -0.8% | +6.4% | -14.7% |
Stockland (SGP) | $5.18 | -$0.04 | -0.8% | -6.3% | +0.6% |
ChartWatch
Nasdaq Composite Index
Analysis
A date with destiny?
Or just a date with the short term downtrend ribbon!? 🤣
We shall see on both counts tonight!
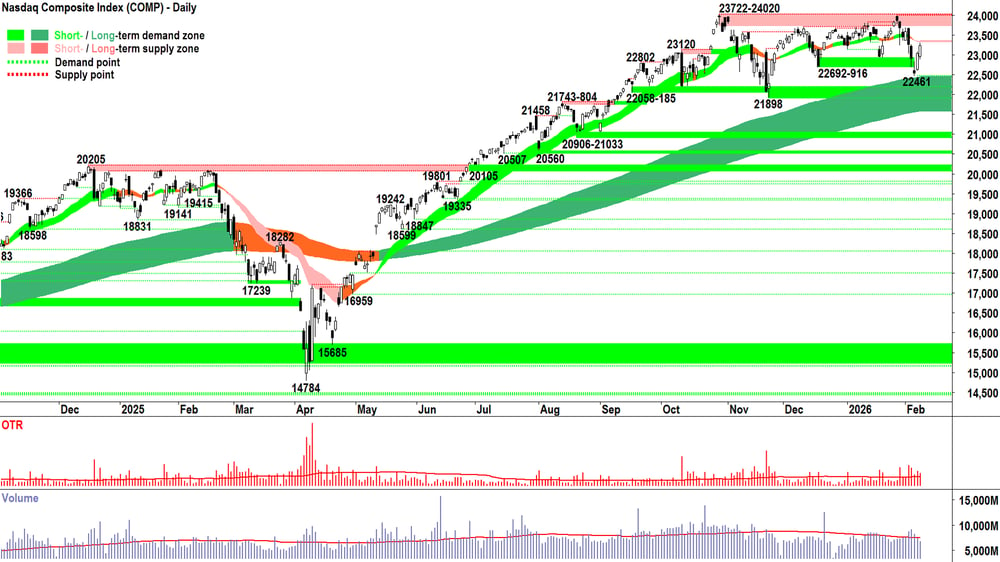
The bucking of the prior short term downtrend (short term trend ribbon ⬇️ + price action 📉 + candles ⬛) could continue with an emphatic close above the short term downtrend ribbon (presently 23325-23340).
Indeed, the very credible demand-side controlled candle from Monday suggests this is a mere formality (i.e., white body, albeit smaller than Friday’s, plus close near the high of the session = likely unquenched excess demand)!
But… don’t underestimate the short term downtrend ribbon’s ability to root out some supply… supply that may quench the prevailing excess demand sparked by Friday’s stunning reversal… and bring this fledgling rally to a halt. 🛑
I propose we are on alert for long black-bodied candles and or one with a long upward pointing shadow. 🚨
In the case of a long upward pointing shadow, watch in particular for one that tips the 2-3-Feb highs of 23692 — that’s where I expect a great deal of sell the rally latent supply will be lurking… ⚠️
I concede that to some extent, all candles are important, but can I offer that tonight’s Comp candle will be substantially important in defining both sides of the market’s intent over the coming weeks. Um... I think “Make or break” is the appropriate phrase!!! 🧐
View
On the fence… Shifting uncomfortably between the pickets! I am at 1/2RP portfolio risk limit 🪣 (RP = Risk Position — it reflects my personal allowable capital allocation limit for my investments in US stocks. So 1/2RP is 50%, 2/3RP is 67% and FRP is 100%).
Key levels
22461 is the new critical point of demand. If the Comp closes below that price, we can assume the supply side is very much in control. On a close below 21898 the long term uptrend is likely under significant pressure = ⚠️. 23722-24020 is the nearest critical static zone of supply, but the short term downtrend ribbon (presently 23330-23345) may also impede upside price action.
S&P/ASX 200 (XJO)
%20chart_10%20Feb.png)
Analysis
Upward pointing shadows, huh? 😉
They tell us so much about what’s happening in the demand-supply environment. Granted, it’s a one-session snapshot — but depending on the size of the candle/shadow and the volume that accompanies it, they can have absolutely massive ramifications for prices down the track.
Simply: upward pointing shadows indicate the location and motivation of latent excess supply in the system.
They point to an area of price where supply was stimulated to enter the market — and where the entry of this supply was sufficient to overwhelm the prevailing demand.
The longer the upward pointing shadow, the greater the motivation among the supply that entered the market. The greater the accompanying volume — the greater the clout of those supplying.
Here’s the upshot: if there was motived and large supply at a price point before — who’s to say that they won’t have another swing given the chance?
It’s why long upward pointing shadows on large volume often mark substantial market tops.
What I’ve just told you is so important that I suggest you tattoo “Up-shadow = XS Supply” on your forehead so you can read it in the bathroom mirror every morning before you start your day.
(Top tip: for best results, be sure to tattoo it backwards! 👍)
Today’s upward pointing shadow on the OTP is a small one, and volume was rather muted. So, it’s unlikely to be a definitive signal going forward. But it does hint to at least some trepidation to continue yesterday’s heroics: to sell the rally rather than FOMO into the rise.
The other important aspect of shadow analysis is where those shadows occur. They make a great deal of sense when they occur at previous zones of supply — in this case in the proximity of the 8944-8979 supply zone. So, we should not be surprised by today’s price action.
I will conclude today’s analysis by saying that upward pointing shadows are powerful signals of the market’s intent, but they can be overcome. Just because supply was active in a particular zone, beating out demand there, it doesn’t mean that this supply cannot / will not be consumed. It can / willif there’s sufficient demand.
And that’s the question now. This is the big test the OTP must overcome: Is there sufficient demand in the system to consume the supply that we’re pretty sure resides roughly here-and-all the way up to the 9110-9116 all-time highs? 🤔
The answer — while critical for your portfolio — is moot.
We don’t prognosticate, remember!!! 🔮🚫
We’re trend followers. We will see how the candles fall, demand-side or supply-side controlled, and associate a set of probabilities to them.
If the MOTN (More Often Than Not) begins to tilt towards demand-side control… simple… we have one option: +R.
If however, it begins to tilt towards supply-side control… then so be it! We again have just one option: -R.
How wonderful it is to know what to do… and when to do it!
Compare this to every other investor who’s fumbling and bumbling around trying to read the news, analyse the fundamentals… all the time putting two and two together… and getting the square root of pi!!! 🧮
View
Still on the fence here too… let’s hope we’re not stuck here for too long! I am at 1/2RP portfolio risk limit 🪣 (i.e., my personal allowable capital allocation limit for my investments in Australian stocks is 50%).
Key levels
8675 is the closest point of demand, but far more important, is the dynamic demand we'd typically associate with the long term trend ribbon (presently 8614-8717) . A close below 8614 would neutralise the present long term uptrend. 8944-8979 is the next key zone of supply.
ChartWatch *LIVE* Webinar
ChartWatch *LIVE* Webinars – WEEKLY Wednesday's @ 12pm AEDT
Learn more about technical analysis and trend following through real case studies on ASX stocks. Australia's premier technical analyst, Carl Capolingua, shares his unique insights on stocks as requested by viewers. Ask about a company in your portfolio or anything related to trading and investing and get Carl's expert opinion.
Places are limited so >REGISTER NOW!<
Economy
Today
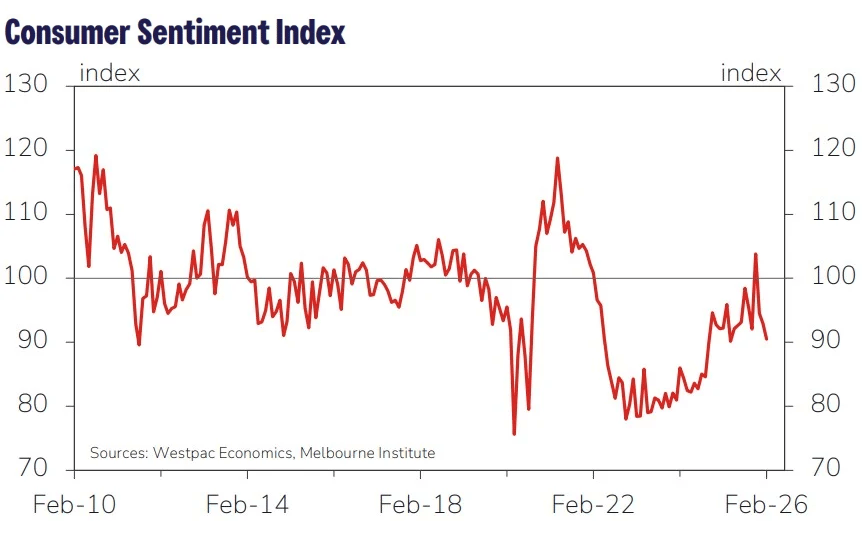
10:30 AUS February Westpac Consumer Sentiment
Result: -2.6% m/m vs -1.7% m/m in January
11:30 AUS January NAB Business Confidence
Result: 3 points vs 2 points in December
22:00 USA January NFIB Small Business Index (99.9 forecast vs 99.5 in December)
Later this week
Wednesday
00:30 USA January Core Retail Sales m/m (+0.4% m/m forecast vs +0.5% m/m in December)
00:30 USA January Employment Cost Index q/q (+0.8% m/m forecast vs +0.8% m/m in December)
12:30 AUS RBA Deputy Gov Hauser Speaks
Thursday
00:30 USA January Non-Farm Payrolls
Employment Change: 70k m/m forecast vs 50k m/m in December
Average Hourly Earnings: +0.3% m/m forecast vs +0.3% m/m in December
Unemployment Rate: +4.4% forecast vs +4.4% in December
Friday
00:30 USA Weekly Unemployment Rate (222k forecast vs 231k in December)
02:30 AUS CB Leading Index m/m (+0.2% in December)
Saturday
00:30 USA January Core Consumer Price Index (CPI) (+0.3% m/m forecast vs +0.2% m/m in December)
Latest News
Interesting Movers
Trading higher
🧪 Critical minerals — NdPr prices hit 3.5 year highs, triggering broad sector strength
+19.7% Sunrise Energy Metals (SRL) — No news, sector strength, prevailing short- and long-term uptrends, a regular in ChartWatch ASX Scans Uptrends list 🔎📈
+18.2% European Lithium (EUR) — CRML Announces High-Grade Drilling Results Tanbreez, sector strength
+13.5% EQ Resources (EQR) — Company Presentation - February 2026, sector strength
+12.8% Calix (CXL) — Calix 1H FY26 Results webinar details, sector strength, prevailing uptrends, a regular in ChartWatch ASX Scans Uptrends list 🔎📈
+10.7% American Tungsten & Antimony (AT4) — No news, sector strength
+8.7% Australian Strategic Materials (ASM) — No news, sector strength
+7.7% Northern Minerals (NTU) — No news, sector strength
+7.3% Viridis Mining and Minerals (VMM) — Appointment of Chief Financial Officer, sector strength
☢️ Uranium — Fears AI won't spur energy consumption boom unwinding... Local U-stocks aping Cameco and Kazatomprom rallies overnight.
+15.0% Alligator Energy (AGE) — No news, sector strength
+14.0% Peninsula Energy (PEN) — Company Presentation - February 2026, sector strength
+10.9% Boss Energy (BOE) — No news, sector strength
+10.0% Elevate Uranium (EL8) — No news since 09-Feb Presentation - 121 Cape Town, sector strength
+9.4% Aura Energy (AEE) — No news, sector strength
+8.4% Silex Systems (SLX) — No news, sector strength
+7.9% Bannerman Energy (BMN) — No news, sector strength
+7.1% Deep Yellow (DYL) — No news, sector strength
🛡️ Defence — risk-on follow-through
+11.8% Electro Optic Systems Holdings (EOS) — Response to Grizzly Research Report, sector strength
+7.3% Droneshield (DRO) — No news, sector strength
🥈 Silver — catch-up bid
+8.7% Investigator Resources (IVR) — No news, sector strength
+8.6% Boab Metals (BML) — Final Works Approval Received for Sorby Hills Construction, sector strength
🔍 Other notable gains
+12.8% Clarity Pharmaceuticals (CU6) — No news.
Trading lower
🏦 Insurance & financials — sector-wide unwind
-9.5% Steadfast Group (SDF) — No news, sector weakness, prevailing short- and long-term downtrends, a regular in ChartWatch ASX Scans Downtrends list 🔎📉
-6.2% Insurance Australia Group (IAG) — No news, sector weakness, prevailing short- and long-term downtrends, a regular in ChartWatch ASX Scans Downtrends list 🔎📉
-6.1% AUB Group (AUB) — No news, sector weakness, prevailing short- and long-term downtrends, a regular in ChartWatch ASX Scans Downtrends list 🔎📉
-4.2% Suncorp Group (SUN) — No news, sector weakness, prevailing short- and long-term downtrends, a regular in ChartWatch ASX Scans Downtrends list 🔎📉
-3.4% QBE Insurance Group (QBE) — No news, sector weakness, prevailing short- and long-term downtrends, a regular in ChartWatch ASX Scans Downtrends list 🔎📉
📉 Other notable declines (poorly received market updates ⚠️)
-22.1% AEL — Elanora-1 exploration well update
-20.6% G8 Education (GEM) — Market Update, prevailing short- and long-term downtrends, a regular in ChartWatch ASX Scans Downtrends list 🔎📉
-5.0% CSL (CSL) — Paul McKenzie retires, Gordon Naylor appointed interim CEO, prevailing short- and long-term downtrends, a regular in ChartWatch ASX Scans Downtrends list 🔎📉
Broker Moves
Alpha HPA (A4N)
Retained at speculative buy at Bell Potter; Price Target: $1.50 from $2.00
Amplitude Energy (AEL)
Downgraded to sector perform from outperform at RBC Capital Markets; Price Target: $2.70 from $3.25
Boab Metals (BML)
Retained at buy at Shaw and Partners; Price Target: $1.70 from $1.08
Bravura Solutions (BVS)
Upgraded to neutral from underweight at JPMorgan; Price Target: $2.25 from $2.05
Retained at neutral at Macquarie; Price Target: $3.02
CAR Group (CAR)
Retained at buy at Bell Potter; Price Target: $39.80 from $42.20
Upgraded to outperform from hold at CLSA; Price Target: $31.00
Retained at neutral at E&P; Price Target: $34.20 from $36.10
Retained at overweight at Jarden; Price Target: $30.20 from $33.75
Retained at neutral at Macquarie; Price Target: $28.50 from $39.00
Retained at overweight at Morgan Stanley; Price Target: $38.00 from $43.00
Retained at buy at UBS; Price Target: $39.60
Challenger (CGF)
Retained at buy at Citi; Price Target: $10.25
Retained at outperform at CLSA; Price Target: $9.00
Retained at buy at Goldman Sachs; Price Target: $9.30
Retained at overweight at JPMorgan; Price Target: $10.00
Retained at equal-weight at Morgan Stanley; Price Target: $8.70
CSL (CSL)
Retained at buy at Citi; Price Target: $225.00
Dexus Convenience Retail REIT (DXC)
Retained at buy at Bell Potter; Price Target: $3.25 from $3.45
Iluka Resources (ILU)
Retained at overweight at Morgan Stanley; Price Target: $6.75
Lynas Rare Earths (LYC)
Retained at overweight at Morgan Stanley; Price Target: $17.65
National Storage REIT (NSR)
Downgraded to neutral from buy at UBS; Price Target: $2.80
Orica (ORI)
Retained at buy at Bell Potter; Price Target: $28.50 from $26.00
PLS Group (PLS)
Retained at buy at Canaccord Genuity; Price Target: $5.30
Retained at overweight at Morgan Stanley; Price Target: $5.00
Pro Medicus (PME)
Upgraded to buy from accumulate at Morgans; Price Target: $290.00
Pepper Money (PPM)
Retained at buy at Citi; Price Target: $2.70
QBE Insurance Group (QBE)
Retained at outperform at Macquarie; Price Target: $22.90
REA Group (REA)
Retained at buy at Bell Potter; Price Target: $211.00 from $244.00
Region Group (RGN)
Retained at buy at Citi; Price Target: $2.40
Rio Tinto (RIO)
Retained at equal-weight at Morgan Stanley; Price Target: $140.00
Upgraded to accumulate from hold at Ord Minnett; Price Target: $173.00 from $158.00
Sims (SGM)
Downgraded to underweight from neutral at Jarden; Price Target: $18.50 from $14.40
Upgraded to buy from neutral at UBS; Price Target: $25.00
Sonic Healthcare (SHL)
Retained at buy at Bell Potter; Price Target: $28.50 from $33.30
Sky Metals (SKY)
Initiated at speculative buy at Morgans; Price Target: $0.32
Transurban Group (TCL)
Retained at neutral at Macquarie; Price Target: $14.46 from $14.55
Treasury Wine Estates (TWE)
Retained at sell at Citi; Price Target: $4.80
Vulcan Steel (VSL)
Upgraded to buy from neutral at UBS; Price Target: $7.65
WEB Travel Group (WEB)
Retained at outperform at CLSA; Price Target: $6.55 from $6.70
Retained at overweight at Jarden; Price Target: $5.70 from $5.90
Retained at overweight at JPMorgan; Price Target: $6.00
Retained at equal-weight at Morgan Stanley; Price Target: $4.40
Retained at buy at Ord Minnett; Price Target: $6.16 from $7.00
Retained at buy at UBS; Price Target: $6.15
Wisetech Global (WTC)
Retained at outperform at Macquarie; Price Target: $94.00 from $108.50
Scans
Top Gainers
Code | Company | Last | % Chg |
|---|---|---|---|
| EM3 | Emc Gold Corporation | $0.14 | +55.56% |
| AKG | Academies Australasia Group Ltd | $0.195 | +39.29% |
| IFG | Infocus Group Holdings Ltd | $0.011 | +37.50% |
| PEB | Pacific Edge Ltd | $0.22 | +33.33% |
| E79 | E79 Gold Mines Ltd | $0.045 | +32.35% |
Top Fallers
Code | Company | Last | % Chg |
|---|---|---|---|
| URF | US Masters Residential Property Fund | $0.19 | -35.59% |
| AEL | Amplitude Energy Ltd | $2.50 | -22.12% |
| GEM | G8 Education Ltd | $0.50 | -20.64% |
| ORN | Orion Minerals Ltd | $0.032 | -17.95% |
| XPN | Xpon Technologies Group Ltd | $0.019 | -17.39% |
52 Week Highs
Code | Company | Last | % Chg |
|---|---|---|---|
| EM3 | Emc Gold Corporation | $0.14 | +55.56% |
| AKG | Academies Australasia Group Ltd | $0.195 | +39.29% |
| PEB | Pacific Edge Ltd | $0.22 | +33.33% |
| BMG | BMG Resources Ltd | $0.041 | +17.14% |
| EQR | EQ Resources Ltd | $0.21 | +13.51% |
52 Week Lows
Code | Company | Last | % Chg |
|---|---|---|---|
| URF | US Masters Residential Property Fund | $0.19 | -35.59% |
| GEM | G8 Education Ltd | $0.50 | -20.64% |
| EMA | Eminence Minerals Ltd | $0.053 | -14.52% |
| IAM | Income Asset Management Group Ltd | $0.018 | -14.29% |
| HYT | Hyterra Ltd | $0.015 | -11.77% |
Near Highs
Code | Company | Last | % Chg |
|---|---|---|---|
| GLPR | iShares Ftse GBL Property Ex Aus (Aud Hedged) ETF | $27.85 | +0.18% |
| AN3PI | Australia and New Zealand Banking Group Ltd | $103.75 | -0.05% |
| WVOL | iShares MSCI World Ex Aust Minimum Volatility ETF | $44.63 | +0.25% |
| AII | Almonty Industries Inc | $20.65 | +4.03% |
| IAGPF | Insurance Australia Group Ltd | $106.20 | +0.28% |
Relative Strength Index (RSI) Oversold
Code | Company | Last | % Chg |
|---|---|---|---|
| HUGE | ETFs Magnificent 7+ ETF | $11.79 | -0.59% |
| GAME | Betashares Video Games and Esports ETF | $15.89 | +3.38% |
| CD2 | CD Private Equity Fund Ii | $0.485 | +1.04% |
| SEK | Seek Ltd | $18.72 | +3.60% |
| LED | LDR Capital Property Fund | $0.56 | -4.27% |
