

The ASX 200 advanced as the US Treasury's announcement of an expanded government-debt buyback program sent the yields on benchmark 30-year and 10-year US bonds tumbling — pulling back from 22-year highs and triggering one of gold's best single sessions of the year. Gold stocks, miners, technology, and healthcare were the key beneficiaries, while the banks' losing streak extended...
Be sure to click/scroll through for the usual reporting of the major sector and stock-specific moves, the broker responses to them, as well as all the key economic data in tonight's Evening Wrap. Also, I have detailed technical analysis on the Nasdaq Composite and the S&P/ASX 200 in today's ChartWatch.
Let’s dive in!
Today in Review
Name | Value | % Chg |
|---|---|---|
Major Indices | ||
| ASX 200 | 9,083.8 | +0.33% |
| All Ords | 9,298.5 | +0.47% |
| Small Ords | 3,570.3 | +1.98% |
| All Tech | 3,187.7 | +1.66% |
| Emerging Companies | 3,146.4 | +3.00% |
Currency | ||
| AUD/USD | 0.7119 | -0.09% |
US Futures | ||
| S&P 500 | 7,744.5 | +0.20% |
| Dow Jones | 53,583.0 | +0.10% |
| Nasdaq | 29,672.5 | +0.54% |
Name | Value | % Chg |
|---|---|---|
Sector | ||
| Materials | 25,825.7 | +3.52% |
| Information Technology | 1,943.3 | +2.54% |
| Health Care | 32,044.3 | +1.39% |
| Energy | 11,073.5 | +0.45% |
| Real Estate | 3,523.7 | +0.15% |
| Utilities | 10,266.6 | -0.05% |
| Consumer Discretionary | 3,850.7 | -0.27% |
| Communication Services | 1,612.5 | -0.71% |
| Industrials | 8,148.8 | -1.05% |
| Consumer Staples | 13,093.5 | -1.17% |
| Financials | 9,190.4 | -1.93% |
ASX 200 Intraday Chart
%20intraday%20chart_20%20Aug.png)
Markets
The S&P/ASX 200 (XJO) finished 30.0 points higher at 9,083.8, smack–bang at the mid-point of the session's 0.6% range. Importantly, despite the mediocre performance at benchmark level, in the broader-based S&P/ASX 300 (XKO) advancers beat decliners by a solid 187 to 98.
The US Treasury Department announced it would expand its government-debt buyback program from next month — a move that sent the yields on benchmark 30-year and 10-year US Treasury bonds tumbling nearly 10 and 7 basis points respectively, pulling the 30's yield back from the 22-year high reached just the day before.
The program, originally launched in 2024 under then-Treasury Secretary Janet Yellen, absorbs older, less-liquid Treasury bonds from the market — reducing supply pressure and pushing prices up, which mechanically drives yields down.
The immediate beneficiaries were gold, silver, and bitcoin, all of which surged overnight as lower risk-free yields reduced the opportunity cost of holding non-yielding assets. Equity markets globally responded in kind, with the rotation into growth and commodity stocks running in near-perfect inverse to the bond yield move.
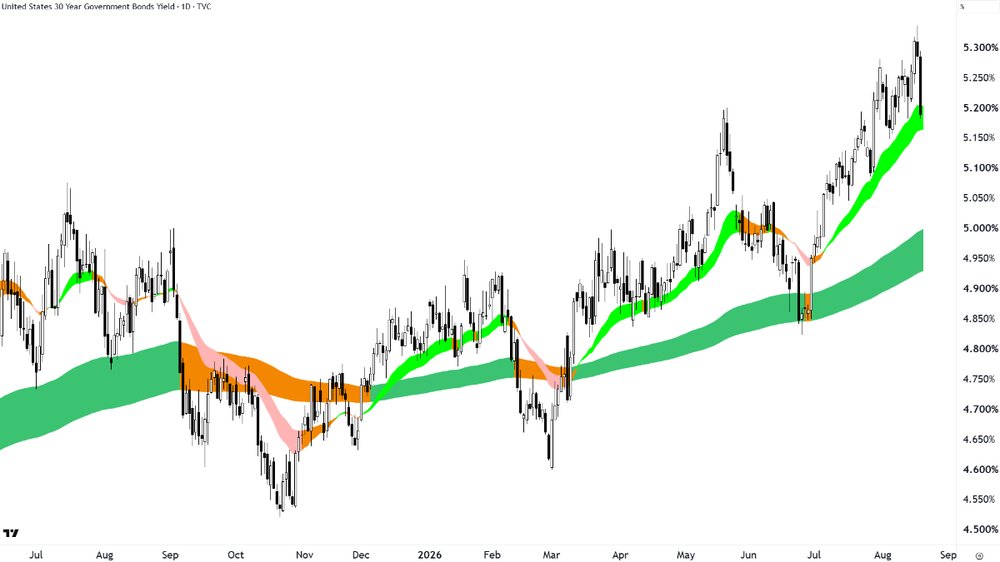
US 30-Year T-Bond Yield
Lower benchmark yields reduce the opportunity cost of holding non-yielding gold, since bonds now offer less competition as income-generating alternatives. COMEX gold futures surged 2.8% overnight before adding a further 0.2% to US$4,552.50/oz in Asian trade, while COMEX silver futures also gained 2.8% overnight before adding a further 2.0% to US$67.18/oz.
The scale of the equity response exceeded even the commodity price move — a sign that short-covering and fresh positioning amplified the fundamental signal. Ora Banda Mining (OBM) (+14.0%), Alkane Resources (ALK) (+11.0%), Regis Resources (RRL) (+10.9%), Genesis Minerals (GMD) (+10.3%), Capricorn Metals (CMM) (+10.3%), and Evolution Mining (EVN) (+10.2%) all surged.
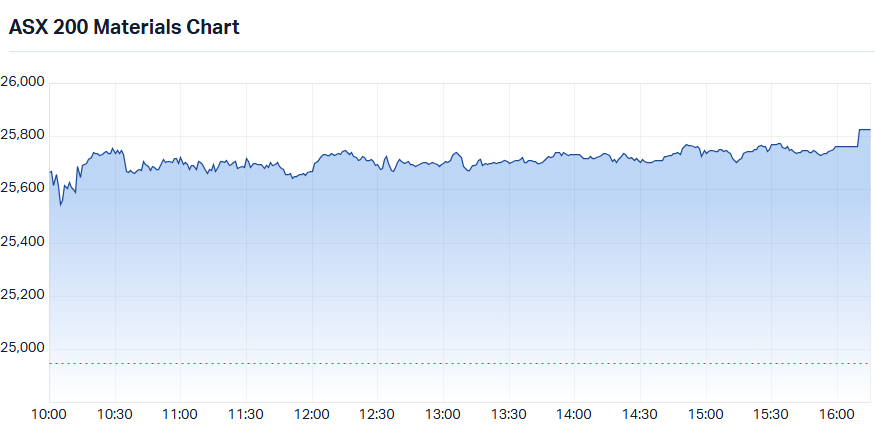
S&P-ASX 200 Materials Sector Index
Materials (XMJ) (+3.5%) was the next major beneficiary of the yield retreat — lower benchmark rates reduce the cost of capital for capital-intensive mining operations and ease the global growth headwinds that weigh on commodity demand expectations. Notably, the equity gains ran well ahead of underlying commodity prices — COMEX copper fell 0.2% to US$6.483/lb in Asian trade after declining 1.1% on the LME overnight, and SGX iron ore futures eased 0.3% to US$95.75/t.
Arguably, the buying was backed by sentiment, not commodity price leads. Capstone Copper (CSC) (+3.7%), BHP (BHP) (+3.2%), South32 (S32) (+2.7%), Sandfire Resources (SFR) (+2.7%), and Rio Tinto (RIO) (+1.8%) all surged in a session where the macro tailwind clearly overwhelmed the underlying commodity signals.
Information Technology (XIJ) (+2.5%) was the third direct beneficiary of the yield retreat — long-duration, high-P/E growth stocks benefit from lower discount rates with mathematical directness, since their earnings are weighted further into the future.
Codan (CDA) (+12.4%) led after posting a strong operational result. WiseTech Global (WTC) (+9.1%) staged a remarkable rebound from yesterday's -8.7% governance-related collapse, despite no new information emerging beyond yesterday's ACCC search warrant announcement — perhaps the market simply decided that it had overreacted. Appen (APX) (+6.1%) and Xero (XRO) (+2.4%) also advanced.
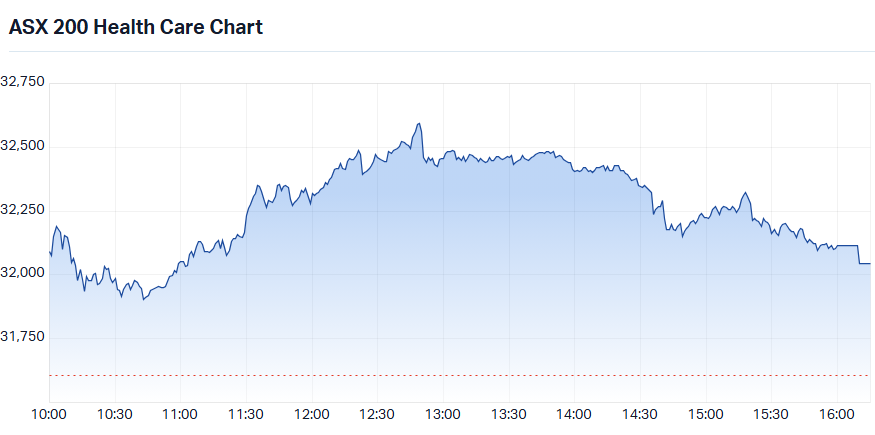
S&P-ASX 200 Health Care Sector Index
Health Care (XHJ) (+1.4%) extended its extraordinary recent run. Lower benchmark yields directly lift the present value of the sector's premium long-duration earnings multiples, and the sector is also attracting rotational flows from investors exiting the banks.
Small-cap health technology names were the standouts: Artrya (AYA) (+8.6%), Polynovo (PNV) (+6.7%), and 4DMedical (4DX) (+6.1%) all surged. Among the large-cap names, Pro Medicus (PME) (+3.6%), Telix Pharmaceuticals (TLX) (+3.2%), CSL (CSL) (+2.8%), and ResMed (RMD) (+2.8%) all continued higher.
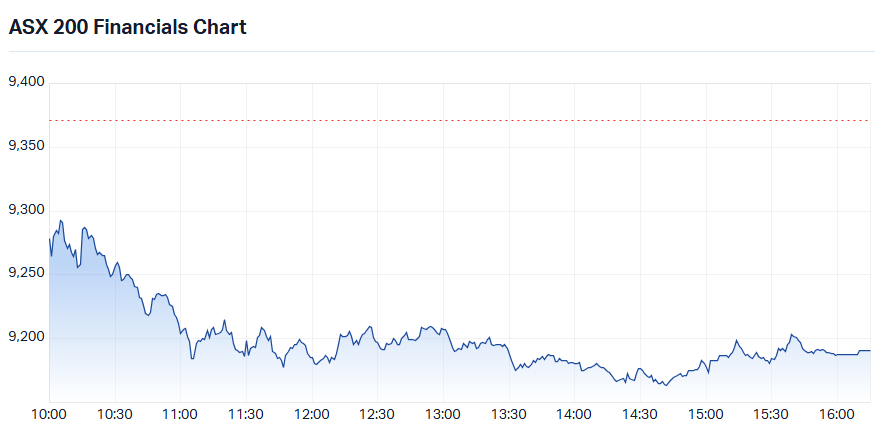
S&P-ASX 200 Financials Sector Index
Financials (XFJ) (-1.9%) extended what is becoming a defining feature of August's market — the sector is now down 8.7% from its August 6 peak even after accounting for dividends paid across the period.
Today's decline had no clear single catalyst — usually lower bond yields would help the banks. This move is about the ongoing repricing of earnings expectations following a week of results confirmation that mortgage application volumes are in deep structural retreat. Commonwealth Bank (CBA) (-2.7%), Westpac (WBC) (-1.8%), ANZ (ANZ) (-1.6%), and National Australia Bank (NAB) (-1.3%) all declined.
Energy (XEJ) (+0.5%) remained well-supported as ICE Brent crude futures held near US$91.90/bbl — up 0.3% in Asian trade and firmly above the US$90 level that has provided support since last week. SGX Australian Premium Coking Coal futures gained 2.7% to US$244.50/t, with coal stocks responding — Whitehaven Coal (WHC) (+1.1%) and New Hope Corp. (NHC) (+0.7%) were firmer. Among the oil and gas names, Santos (STO) (+1.7%) was the standout.
Consumer Staples (XSJ) (-1.2%) found no buyers on a risk-on day — the sector's defensive character, which attracts capital when anxiety is high, works in reverse when optimism returns. Metcash (MTS) (-2.9%), Woolworths (WOW) (-1.8%), and Coles (COL) (-1.2%) were all lower as capital rotated toward growth and resources.
Real Estate (XPJ) (+0.1%) was the most internally divided sector of the day. Goodman Group (GMG) (-1.5%) extended its post-results drift, dragging on the sector's performance. Meanwhile, the lower benchmark yield environment did attract buyers to some of the sector's retail and residential names — Vicinity Centres (VCX) (+3.2%), Mirvac (MGR) (+2.7%), and Stockland (SGP) (+2.4%) all advanced as investors moved capital back in to bond proxies.
Today's best ASX Top 300 gainers
Company | Last Price | Change $ | Change % | 1mo % | 1yr % |
|---|---|---|---|---|---|
| Zip Co (ZIP) | $3.05 | +$0.47 | +18.2% | +2.3% | +0.3% |
| MA Financial Group (MAF) | $7.10 | +$1.09 | +18.1% | +12.3% | -14.3% |
| Super Retail Group (SUL) | $14.45 | +$1.89 | +15.0% | +9.8% | -12.6% |
| Ora Banda Mining (OBM) | $1.585 | +$0.195 | +14.0% | +58.5% | +120.1% |
| Codan (CDA) | $48.88 | +$5.40 | +12.4% | +17.1% | +106.5% |
| Wagners Holding Company (WGN) | $4.67 | +$0.47 | +11.2% | +14.2% | +122.4% |
| Alkane Resources (ALK) | $1.77 | +$0.175 | +11.0% | +35.6% | +94.5% |
| Regis Resources (RRL) | $8.23 | +$0.81 | +10.9% | +45.9% | +85.8% |
| Bega Cheese (BGA) | $6.66 | +$0.65 | +10.8% | +9.2% | +27.8% |
| Genesis Minerals (GMD) | $8.01 | +$0.75 | +10.3% | +44.1% | +82.5% |
| Capricorn Metals (CMM) | $17.59 | +$1.64 | +10.3% | +49.7% | +81.5% |
| Evolution Mining (EVN) | $15.07 | +$1.39 | +10.2% | +43.1% | +88.8% |
| Ramelius Resources (RMS) | $3.92 | +$0.34 | +9.5% | +36.6% | +41.5% |
| Wisetech Global (WTC) | $43.19 | +$3.61 | +9.1% | +23.6% | -61.8% |
| Vault Minerals (VAU) | $6.49 | +$0.54 | +9.1% | +40.5% | +137.7% |
| MAAS Group Holdings (MGH) | $6.17 | +$0.51 | +9.0% | +9.6% | +44.2% |
| Greatland Resources (GGP) | $13.26 | +$1.09 | +9.0% | +33.5% | +142.4% |
| Westgold Resources (WGX) | $6.23 | +$0.51 | +8.9% | +43.2% | +97.2% |
| Perseus Mining (PRU) | $6.13 | +$0.50 | +8.9% | +31.8% | +73.7% |
| Spark New Zealand (SPK) | $1.82 | +$0.14 | +8.3% | +19.0% | -23.2% |
Today's worst ASX Top 300 losers
Company | Last Price | Change $ | Change % | 1mo % | 1yr % |
|---|---|---|---|---|---|
| IPH (IPH) | $3.75 | -$0.47 | -11.1% | -9.2% | -32.9% |
| Helia Group (HLI) | $5.05 | -$0.63 | -11.1% | -9.2% | -11.4% |
| Downer EDI (DOW) | $6.68 | -$0.77 | -10.3% | -15.8% | -3.6% |
| Sonic Healthcare (SHL) | $21.38 | -$2.18 | -9.3% | -2.3% | -25.6% |
| BlueScope Steel (BSL) | $30.05 | -$2.10 | -6.5% | -5.2% | +26.8% |
| Medibank Private (MPL) | $4.71 | -$0.32 | -6.4% | -8.2% | -9.9% |
| Superloop (SLC) | $3.13 | -$0.20 | -6.0% | +0.3% | -3.1% |
| Redox (RDX) | $3.59 | -$0.21 | -5.5% | -3.0% | +71.0% |
| NIB Holdings (NHF) | $7.09 | -$0.40 | -5.3% | -3.0% | -6.3% |
| Megaport (MP1) | $19.31 | -$1.03 | -5.1% | +5.9% | +35.1% |
| IperionX (IPX) | $2.89 | -$0.13 | -4.3% | -11.6% | -51.2% |
| Netwealth Group (NWL) | $22.11 | -$0.99 | -4.3% | -5.8% | -38.6% |
| Insurance Australia Group (IAG) | $7.80 | -$0.34 | -4.2% | -6.2% | -14.3% |
| HUB24 (HUB) | $76.48 | -$3.26 | -4.1% | -8.1% | -27.1% |
| GenusPlus Group (GNP) | $9.07 | -$0.38 | -4.0% | 0.0% | +89.4% |
| SKS Technologies Group (SKS) | $8.39 | -$0.35 | -4.0% | +0.4% | +223.9% |
| QBE Insurance Group (QBE) | $21.78 | -$0.89 | -3.9% | -12.8% | +0.9% |
| Ventia Services Group (VNT) | $5.59 | -$0.22 | -3.8% | -6.2% | +1.8% |
| Brambles (BXB) | $18.80 | -$0.67 | -3.4% | -3.3% | -19.1% |
| Ridley Corporation (RIC) | $2.90 | -$0.10 | -3.3% | +4.7% | -0.3% |
Chartwatch
Nasdaq Composite Index
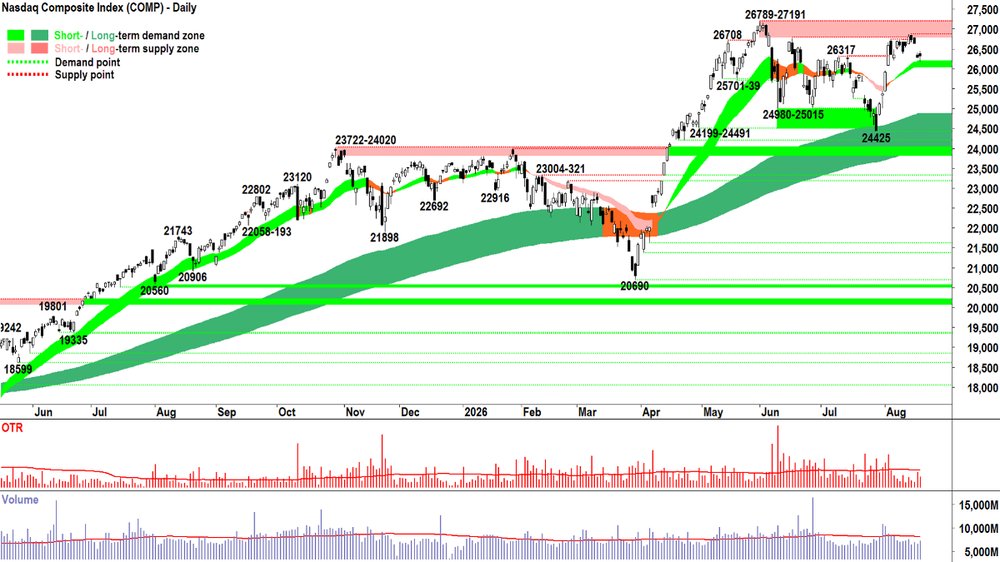
Nasdaq Composite Index chart
Analysis
Hmmm… 🤔
Is that some BTD I can see creeping in at the short term uptrend ribbon!? 🧐
Yes, downward pointing shadow, slightly elevated volume even… 🤞
But it could have been a better close…
Hey, at least no follow-through from the decisive supply side price action that was Tuesday’s candle.
Sure, the US Treasury Department had to come out and apply some Plunge Protection to the bond market (we can always count on the PPT to step in right at the market’s most dire moment!).
But I think we can assume the rot is stopped for now — last candle is history, the next is a mystery, of course! 🔮
A follow through tonight would be very nice: a long white bodied candle, or another downward pointing shadow, pushing at least halfway back up the last peak-to-trough move (I make it 26,524 or better).
If forthcoming, I think we can assume that the short term trend ribbon is indeed acting as a zone of dynamic demand ✅, that the short term uptrend is therefore intact, and therefore we’re back to MOTN P ⬆️.
The other great thing about last night’s candle is that it delivers us a clear focal point for where we DON'T want to see the Comp closing — i.e., below its 26185 low.
That’s where the demand kicked in to stop the rot last night, so if we close below it — then that demand must have been consumed = ❌
View
I am 2/3RP on US stocks. (RP = Risk Position — it reflects my personal allowable capital allocation limit for my investments in US stocks. So 1/2RP is 50%, 2/3RP is 67% and FRP is 100%).
Key Levels
27191 is the key point of supply vs the short term trend ribbon (presently 26066-26200) is the key zone of demand.
S&P/ASX 200 (XJO)
%20chart_20%20Aug.png)
S&P/ASX 200 (XJO) chart
Analysis
What a great opportunity today was to really capitalise on yesterday's downward pointing shadow into the short term uptrend ribbon, to launch an almighty great big white candle back towards the 9297 all-time high.
Stop chuckling. It was possible. As in, across the realms of potential outcomes for the OTP today, a big white candle was one of them.
But, alas, we got an: Old. Tin. Pot. Performance. 😔
Our OTP better get a wriggle on here, though. Because Just as last night's candle low provides the key "focal point" for Go-No-Go on the Comp's short term uptrend, yesterday's candle low of 9019 is our key focal point.
Below it, the short term uptrend is at least neutralised — I will very likely be forced to cut back on portfolio risk.
Above it, and the OTP retains a MOTN chance of doing something good. For once! 🤦
View
I am FRP on Aussie stocks — waiting for the verdict at the short term trend ribbon before retreating, tail between my legs back to 2/3RP. (My personal allowable capital allocation limit for my investments in ASX stocks is now 100%).
Key Levels
9297 is the key point of supply to contend with, while demand the short term uptrend ribbon (presently 9010-9069).
(Glossary of acronyms! Old Tin Pot (OTP): S&P/ASX 200 | MOTN: More Often Than Not | FOMO: Fear Of Missing Out | HOFU: Holding On For Upside | BTD: Buy The Dip | NUTE: No Urgency To Enter | FOHO: Fear Of Holding On | STR: Sell The Rally | RP: Risk Position | FFS: Fund Flow Shenanigans!)
***CHARTWATCH LIVE WEBINARS — NEW VIDEO DROPPED!!! 📺🍿***
ASX biggest blue chip shares analysed by an expert: CSL, COH, BHP, WDS, STO, Copper, Lithium & more
ChartWatch LIVE Webinar
ChartWatch LIVE Webinars – WEEKLY Wednesday's @ 12pm AEDT
Learn more about technical analysis and trend following through real case studies on ASX stocks. Australia's premier technical analyst, Carl Capolingua, shares his unique insights on stocks as requested by viewers. Ask about a company in your portfolio or anything related to trading and investing and get Carl's expert opinion.
Places are limited so >REGISTER NOW!<
Economy
TODAY
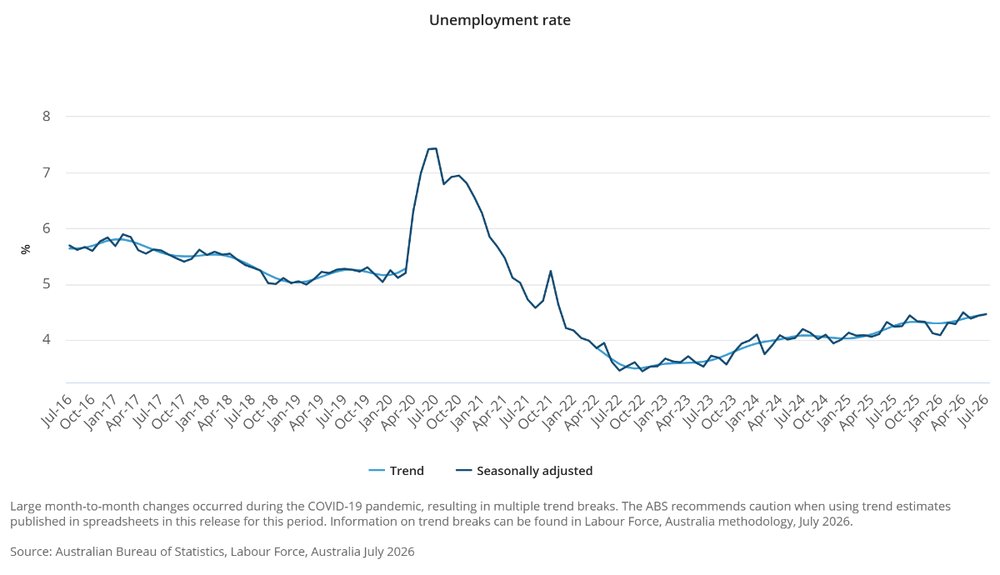
AUS July Employment Data
Result:
-15,800 employed vs +12,000 forecast and +80,700 in June (revised up from +76,300)
Unemployment rate up to 4.5% from 4.4% versus 4.4% forecast.
Reader:
Looked weak, but really, mixed signals.
Employment fell by 15,800 and the participation rate dropped 0.2 percentage points to 66.9%, while hours worked fell 0.6% – all pointing to some cooling in labour demand.
But! Full-time employment rose by 16,300 while part-time employment fell by 32,200 (FT jobs usually seen as more reliable indicator of job market strength/weakness) and both underemployment and underutilisation edged lower (indicates less spare capacity).
Upshot for the RBA: July data = mildly dovish but not weak = consistent with labour market cooling, not cracking...
LATER THIS WEEK
Thursday
22:30 USA Philly Fed Manufacturing Index
Friday
00:00 USA Conference Board Leading Index
09:00 AUS Flash Manufacturing & Services Purchasing Managers Index (PMI)
23:45 USA Flash Manufacturing & Services Purchasing Managers Index (PMI)
Interesting Movers
Trading higher
- Zip Co (ZIP) $3.05+18.2%
Reported FY26 results.
- MA Financial Group (MAF) $7.10+18.1%
Reported FY26 results.
- Super Retail Group (SUL) $14.45+15.1%
Reported FY26 results.
- Ora Banda Mining (OBM) $1.59+14.0%
No news. Performance reflected general strength in the broader precious metals sector after the gold price surged overnight (on similarly sharp fall in bond yields after US Treasury announcement).
- Codan (CDA) $48.88+12.4%
Reported FY26 results. Stronger gold price and sector likely also helped.
- Alkane Resources (ALK) $1.77+11.0%
No news. Performance reflected general strength in the broader precious metals sector.
- Regis Resources (RRL) $8.23+10.9%
No news. Performance reflected general strength in the broader precious metals sector.
- Bega Cheese (BGA) $6.66+10.8%
Reported FY26 results.
- Genesis Minerals (GMD) $8.01+10.3%
Reported FY26 results, but performance likely also reflected general strength in the broader precious metals sector.
- Capricorn Metals (CMM) $17.59+10.3%
No news. Performance reflected general strength in the broader precious metals sector.
- Evolution Mining (EVN) $15.07+10.2%
No news. Performance reflected general strength in the broader precious metals sector.
- Ramelius Resources (RMS) $3.92+9.5%
No news. Performance reflected general strength in the broader precious metals sector.
- Wisetech Global (WTC) $43.19+9.1%
No news! Rebounded from yesterday's selloff that was triggered by an ASX announcement the ACCC had executed a search warrant on the company as part of an investigation into possible contraventions of the Competition and Consumer Act 2010.
- Vault Minerals (VAU) $6.49+9.1%
No news. Performance reflected general strength in the broader precious metals sector.
- MAAS Group Holdings (MGH) $6.17+9.0%
Reported FY26 results.
- Greatland Resources (GGP) $13.26+9.0%
No news. Performance reflected general strength in the broader precious metals sector.
- Westgold Resources (WGX) $6.23+8.9%
No news. Performance reflected general strength in the broader precious metals sector.
- Perseus Mining (PRU) $6.13+8.9%
No news. Performance reflected general strength in the broader precious metals sector.
- Minerals 260 (MI6) $0.86+8.9%
Reported results from infill and exploration drilling at its 100% owned Bullabulling Gold Project in WA. Included 8m @ 3.0g/t Au from 56m and 2m @ 15.6g/t Au from 148m.
- Emerald Resources NL (EMR) $7.05+8.8%
No news. Performance reflected general strength in the broader precious metals sector.
- Spark New Zealand (SPK) $1.82+8.3%
Reported FY26 results.
- VanEck Gold Miners ETF (GDX) $117.96+8.3%
No news. Performance reflected general strength in the broader precious metals sector.
- Resolute Mining (RSG) $1.26+7.9%
No news. Performance reflected general strength in the broader precious metals sector.
- Cuscal (CCL) $5.60+7.3%
Reported FY26 results.
- Northern Star Resources (NST) $23.97+6.3%
Reported FY26 results, but performance likely also reflected general strength in the broader precious metals sector.
- Telix Pharmaceuticals (TLX) $17.78+5.6%
Reported FY26 results.
- NRW Holdings (NWH) $7.58+5.1%
Reported FY26 results.
Trading Lower
- Helia Group (HLI) $5.05-11.1%
No news. Ex-dividend 43 cents per share franked at 37.21%.
- Downer EDI (DOW) $6.68-10.3%
Reported FY26 results.
- Sonic Healthcare (SHL) $21.38-9.3%
Reported FY26 results.
- Medibank Private (MPL) $4.71-6.4%
Reported FY26 results.
- Redox (RDX) $3.59-5.5%
Reported FY26 results.
- Megaport (MP1) $19.31-5.1%
Reported FY26 results.
- Brambles (BXB) $18.80-3.4%
Reported FY26 results.
- Goodman Group (GMG) $28.36-2.9%
Reported FY26 results.
Broker Moves
Company | Broker | Action | Rating | Price Target |
|---|---|---|---|---|
ALCAlcidion Group | Bell Potter | Retained | Buy | $0.15 |
AYAArtrya | Bell Potter | Retained | Buy | $6.75(from $6.10) |
BCIBCI Minerals | Canaccord Genuity | Retained | Speculative Buy | $0.55(from $0.50) |
| Shaw and Partners | Retained | Buy | $0.72(from $0.75) | |
BGDBarton Gold Holdings | Canaccord Genuity | Initiated | Speculative Buy | $2.05 |
BRGBreville Group | Macquarie | Retained | Outperform | $37.10 |
| Morgan Stanley | Retained | Overweight | $38.20 | |
BWPBWP Trust | Macquarie | Retained | Neutral | $3.70 |
| Morgan Stanley | Retained | Equal Weight | $4.20 | |
CBACommonwealth Bank of Australia | Morgan Stanley | Retained | Underweight | $123.50 |
CCVCash Converters International | Shaw and Partners | Retained | Buy | $0.41 |
CKFCollins Foods | Morgan Stanley | Retained | Equal Weight | $10.08 |
COLColes Group | Morgan Stanley | Retained | Overweight | $24.24 |
DGTDigico Infrastructure REIT | UBS | Retained | Buy | $3.75(from $4.20) |
DMPDomino's Pizza Enterprises | Morgan Stanley | Retained | Underweight | $18.60 |
EGLThe Environmental Group | Bell Potter | Retained | Buy | $0.16(from $0.20) |
EVNEvolution Mining | Bell Potter | Retained | Buy | $15.55(from $15.10) |
| UBS | Retained | Neutral | $13.60(from $13.00) | |
FBUFletcher Building | Morgan Stanley | Retained | Underweight | $2.76 |
GHMGolden Horse Minerals | Shaw and Partners | Retained | Buy | $1.25 |
GYGGuzman Y Gomez | Morgan Stanley | Retained | Overweight | $24.67 |
HLSHealius | Macquarie | Retained | Neutral | $0.45(from $0.39) |
HSNHansen Technologies | Shaw and Partners | Retained | Buy | $6.80(from $7.60) |
ILUIluka Resources | Macquarie | Retained | Outperform | $8.00 |
| UBS | Retained | Neutral | $6.65(from $5.25) | |
MGRMirvac Group | Macquarie | Retained | Outperform | $2.25(from $2.17) |
MPKMany Peaks Minerals | Canaccord Genuity | Retained | Speculative Buy | $1.90 |
PMEPro Medicus | Morgan Stanley | Retained | Overweight | $220.00(from $200.00) |
RWCReliance Worldwide Corporation | Morgan Stanley | Retained | Equal Weight | $4.75(from $3.50) |
SGPStockland | Macquarie | Retained | Outperform | $5.22 |
| Morgan Stanley | Retained | Equal Weight | $4.90 | |
SHASHAPE Australia Corporation | Shaw and Partners | Retained | Buy | $8.70 |
SLCSuperloop | Morgan Stanley | Retained | Overweight | $3.80 |
SLSSolstice Minerals | Canaccord Genuity | Retained | Speculative Buy | $2.55 |
SSMService Stream | Morgan Stanley | Retained | Overweight | $2.90(from $2.80) |
STOSantos | Macquarie | Retained | Outperform | $9.15 |
| Morgan Stanley | Retained | Overweight | $7.67 | |
STPStep One Clothing | Bell Potter | Retained | Hold | $0.17(from $0.29) |
SVRSolvar | Shaw and Partners | Initiated | Buy | $1.90 |
SXESouthern Cross Electrical Engineering | Bell Potter | Retained | Buy | $5.40 |
| Shaw and Partners | Retained | Hold | $4.70 | |
TLCThe Lottery Corporation | Morgan Stanley | Retained | Equal Weight | $5.60 |
| UBS | Retained | Buy | $6.10(from $6.15) | |
TPWTemple & Webster Group | Morgan Stanley | Downgraded | Equal Weight(from Overweight) | $4.80(from $8.00) |
TTMTitan Minerals | Canaccord Genuity | Retained | Speculative Buy | $1.65 |
VMMViridis Mining and Minerals | Canaccord Genuity | Retained | Speculative Buy | $6.30 |
WHCWhitehaven Coal | Bell Potter | Retained | Hold | $7.50(from $8.05) |
| Morgan Stanley | Retained | Overweight | $8.45 | |
WOWWoolworths Group | Morgan Stanley | Retained | Equal Weight | $37.16 |
Scans
Top Gainers
Code | Company | Last | % Chg |
|---|---|---|---|
| GES | Genesis Resources Ltd | $0.016 | +220.00% |
| RWL | Rubicon Water Ltd | $0.20 | +42.86% |
| LAT | Latitude 66 Ltd | $0.12 | +27.66% |
| NMT | Neometals Ltd | $0.03 | +25.00% |
| REC | Recharge Metals Ltd | $0.025 | +25.00% |
Top Fallers
Code | Company | Last | % Chg |
|---|---|---|---|
| IEL | Idp Education Ltd | $1.72 | -20.74% |
| ACS | Accent Resources NL | $0.235 | -18.97% |
| AD1 | Adneo Ltd | $0.025 | -16.67% |
| MBG | MB Gold Ltd | $0.15 | -16.67% |
| 3DA | Amaero Inc | $0.185 | -15.91% |
52 Week Highs
Code | Company | Last | % Chg |
|---|---|---|---|
| GES | Genesis Resources Ltd | $0.016 | +220.00% |
| CNB | Carnaby Resources Ltd | $0.98 | +12.64% |
| CDA | Codan Ltd | $48.88 | +12.42% |
| KLI | Killi Resources Ltd | $0.28 | +12.00% |
| CMM | Capricorn Metals Ltd | $17.59 | +10.28% |
52 Week Lows
Code | Company | Last | % Chg |
|---|---|---|---|
| IEL | Idp Education Ltd | $1.72 | -20.74% |
| 3DA | Amaero Inc | $0.185 | -15.91% |
| CQT | Conneqt Health Ltd | $0.016 | -13.51% |
| DOW | Downer Edi Ltd | $6.68 | -10.34% |
| SRR | Sarama Resources Ltd | $0.029 | -9.38% |
Near Highs
Code | Company | Last | % Chg |
|---|---|---|---|
| GLPR | iShares Ftse GBL Property Ex Aus (Aud Hedged) ETF | $28.73 | +0.11% |
| RHC | Ramsay Health Care Ltd | $44.65 | -0.56% |
| OZBD | Betashares Australian Composite Bond ETF | $43.80 | +0.28% |
| AN3PI | Australia and New Zealand Banking Group Ltd | $103.443 | +0.04% |
| WVOL | iShares MSCI World Ex Aust Minimum Volatility ETF | $46.28 | 0.00% |
Relative Strength Index (RSI) Oversold
Code | Company | Last | % Chg |
|---|---|---|---|
| DOW | Downer Edi Ltd | $6.68 | -10.34% |
| ARF | Arena REIT | $2.42 | +2.11% |
| TCF | 360 Capital Mortgage REIT | $5.45 | -4.72% |
| SKG | Storage King Group | $1.145 | 0.00% |
| AZJ | Aurizon Holdings Ltd | $3.60 | -0.55% |
