
News | Market Wraps
Evening Wrap: ASX 200 recovery well underway as big banks and big miners lead the way, uranium stocks tank
The S&P/ASX 200 closed 56.5 points higher, up 0.71%.

Mentioned
The S&P/ASX 200 closed 56.5 points higher, up 0.71%.
The Aussie stock market is now +3.3% from its correction low and -5.5% from the all time high that preceded it. Today was a strong day, led by gains in mega caps like Woolworths Group (WOW) (+1.7%), banks ANZ Group (ANZ) (+3.0%), Westpac Banking Corporation (WBC) (+1.2%), and Commonwealth Bank of Australia (CBA) (+1.1%), as well as key iron ore stocks BHP Group (BHP) (+1.2%), Rio Tinto (RIO) (+1.0%), and Mineral Resources (MIN) (+1.8%).
It wasn’t all one way traffic, though. Health Care (XHJ) (-0.53%) stocks CSL (CSL) (-1.5%), Ramsay Health Care (RHC) (-1.3%), and Pro Medicus (PME) (-0.94%) struggled, as did key uranium stocks like Paladin Energy (PDN) (-11.6%) and Boss Energy (BOE) (-4.0%).
Click/scroll through for the usual reporting of the major sector and stock-specific moves, the broker responses to them, as well as all the key upcoming economic data in tonight's Evening Wrap.
Also, I have detailed technical analysis on the NASDAQ Composite, S&P/ASX 200, and Copper in today's ChartWatch.
Let's dive in!
Today in Review
Wed 26 Mar 25, 5:17pm (AEST)
Name | Value | % Chg |
|---|---|---|
Major Indices | ||
| ASX 200 | 7,999.0 | +0.71% |
| All Ords | 8,225.1 | +0.72% |
| Small Ords | 3,074.3 | +0.46% |
| All Tech | 3,538.8 | +0.16% |
| Emerging Companies | 2,267.5 | +1.02% |
Currency | ||
| AUD/USD | 0.6313 | +0.15% |
US Futures | ||
| S&P 500 | 5,820.25 | -0.11% |
| Dow Jones | 42,872.0 | -0.08% |
| Nasdaq | 20,461.75 | -0.13% |
Name | Value | % Chg |
|---|---|---|
Sector | ||
| Consumer Staples | 11,632.6 | +1.19% |
| Real Estate | 3,701.7 | +1.15% |
| Industrials | 7,874.3 | +1.11% |
| Financials | 8,379.2 | +1.08% |
| Materials | 16,409.6 | +0.71% |
| Utilities | 9,123.2 | +0.47% |
| Consumer Discretionary | 3,869.6 | +0.45% |
| Communication Services | 1,657.0 | +0.30% |
| Information Technology | 2,388.7 | +0.15% |
| Energy | 8,012.3 | +0.13% |
| Health Care | 41,508.7 | -0.53% |
Markets

ASX 200 Session Chart
The S&P/ASX 200 (XJO) finished 56.5 points higher at 7,999.0, 0.71% from its session low and just 0.20% from its high. In the broader-based S&P/ASX 300 (XKO), advancers beat decliners by a resounding 193 to 89.
An 8-handle there, unfortunately not hung onto by a whisker, but at today's high of 8014.9 the post-correction rally had moved to +282 points or +3.6%. To put this into perspective, our all time high set on Valentine's Day was 8616 – so we still require +617 points or +7.7% to go to return to record territory.
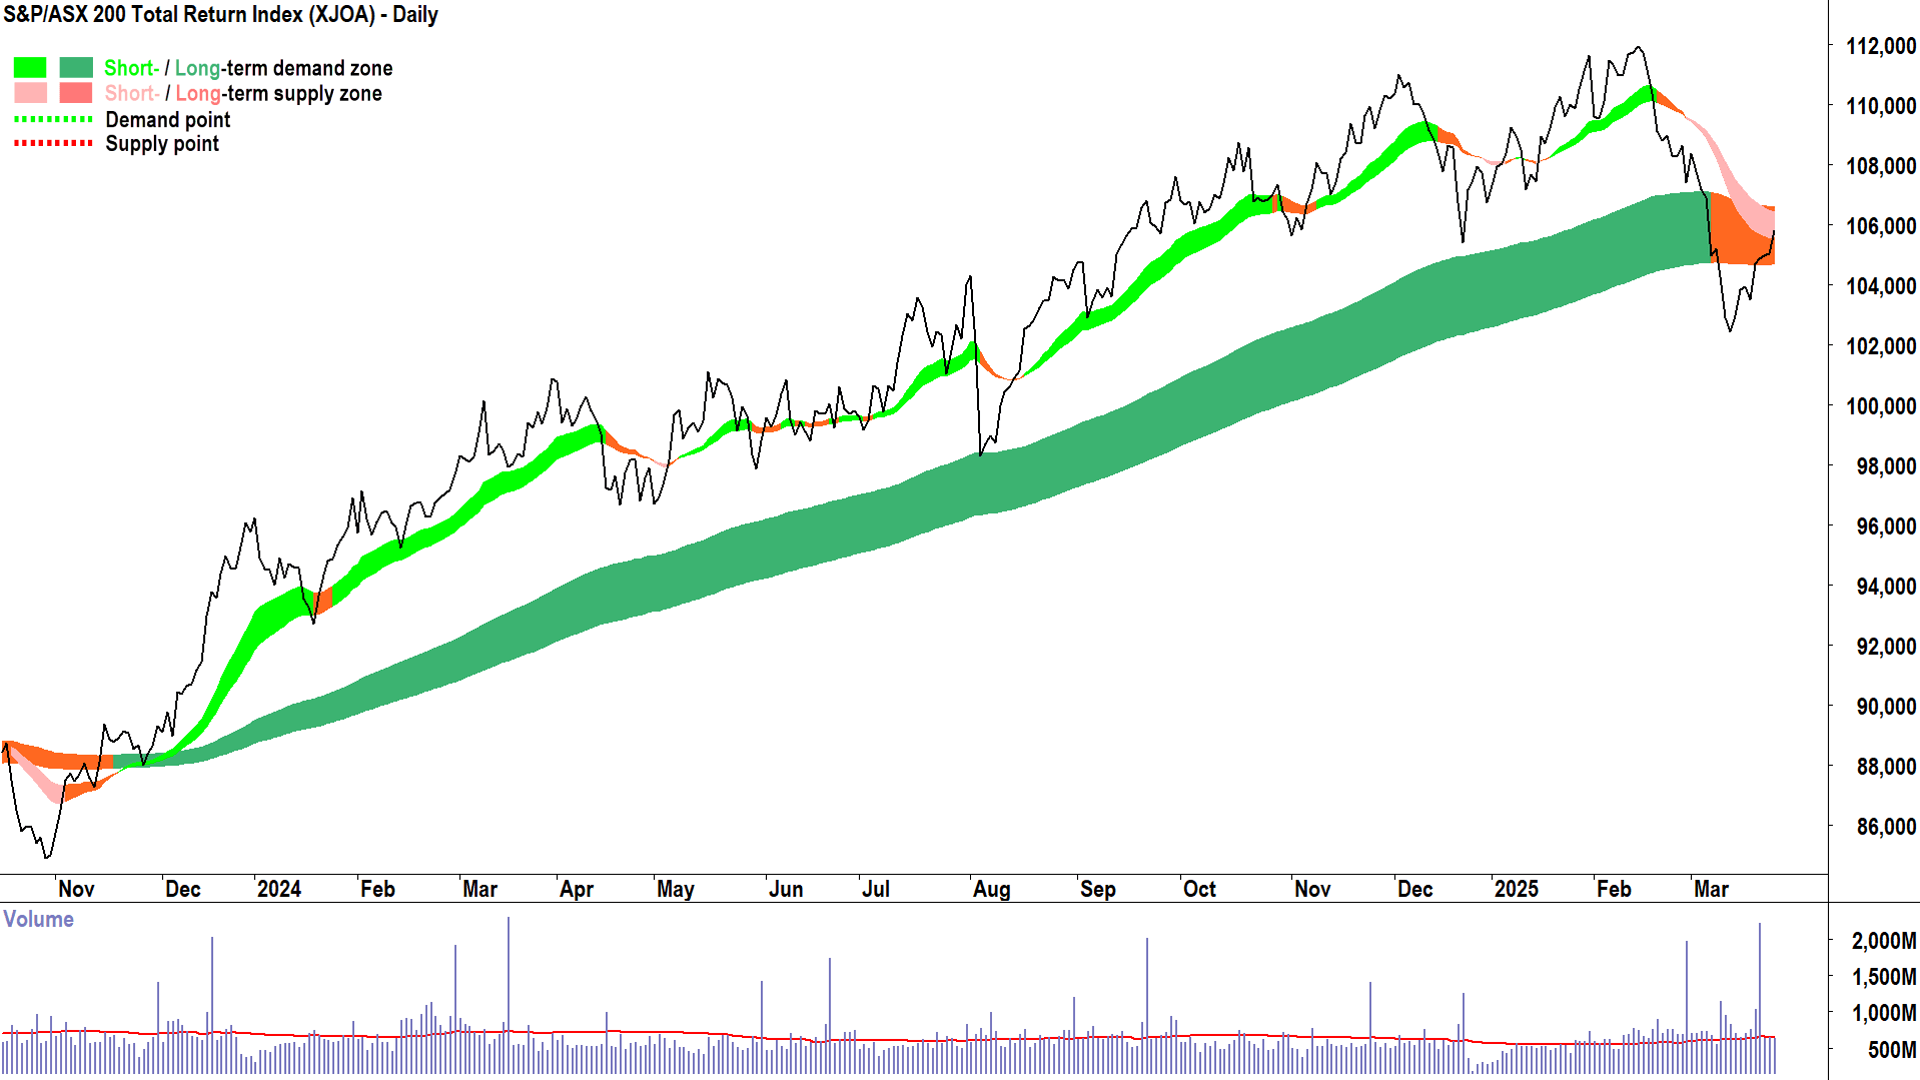
Dividends overstate the decline, of course, and for those who astutely just had that thought, when accounted for the stats for, the stats for the S&P/ASX 200 Total Return Index (XAOA) are:
Correction loss: -8.5%
Recovery so far: +3.3%
Required to return to high: -5.5%
%20chart%2026%20March%202025.png)
S&P/ASX 200 Total Return Index adds back in dividends (click here for full size image)
Importantly, today’s gains were broad-based and with key mega-caps doing the heavy lifting – much like they did into the lead up to this correction. Topping the sector performance table was Consumer Staples (XSJ) (+1.2%), as Woolworths Group (ASX: WOW) (+1.7%) rebounded following two days of pullback post-Friday’s ACCC all-clear relief rally.
Real Estate Investment Trusts (XPJ) (+-%) were next, with Scentre Group (ASX: SCG) (+3.3%) and Healthco Healthcare and Wellness Reit (ASX: HCW) (+2.7%) logging strong gains, but sector heavyweight Goodman Group (ASX: GMG) (+1.0%) wasn’t too far behind.
The big banks are also starting to string together a few winners – sans yesterday’s mystery sell off by ANZ Group (ASX: ANZ) (+3.0%) – but lo and behold, it recouped most of that loss today! Go figure – and nobody emailed in with a reason why 🤷!
The banks will be crucial if we are to recoup the index points mentioned above. To this end, Westpac Banking Corporation (ASX: WBC) (+1.2%), Commonwealth Bank of Australia (ASX: CBA) (+1.1%), and National Australia Bank (ASX: NAB) (+0.68%) each rose nicely.
Resources (XJR) (+0.69%) weren’t terrible today, but they hardly shot the lights out, either. Metals prices were mixed overnight, with really only copper a shining light (detailed technical analysis for you in ChartWatch below). Having said this, copper stocks were largely subdued today, as major iron ore miners like BHP Group (ASX: BHP) (+1.2%), Rio Tinto (ASX: RIO) (+1.0%), and Mineral Resources (ASX: MIN) (+1.8%) led the way.
Doing it tough today was Health Care (XHJ) (-0.53%), as well-established long term downtrends CSL (ASX: CSL) (-1.5%) and Ramsay Health Care (ASX: RHC) (-1.3%), and new long term downtrend Pro Medicus (ASX: PME) (-0.94%), contributed to another tough day for the sector. All three of these stocks have graced my ChartWatch ASX Daily Scans Feature Downtrends lists of late (and for a long time for RHC and CSL).
On this point, it’s worth noting each day just how many times stocks that I’ve run as Feature Uptrends appear in the top gainers list of the Interesting Moves section near the bottom of this Wrap, and how many Feature Downtrends appear in the top losers list. To be forewarned is to be forearmed ⚠️🧐!
Energy (XEJ) (+0.13%) also deserves a mention among today’s underperformers, as it only squeaked a gain in an otherwise buoyant market. Good gains in sector heavyweights Santos (ASX: STO) (+1.7%) and Woodside Energy Group (ASX: WDS) (+0.35%) were undermined by heavy losses in uranium stocks like Paladin Energy (ASX: PDN) (-11.6%) and Boss Energy (ASX: BOE) (-4.0%).
There was some news for PDN and BOE (check the Interesting Moves section below), but if you’ve been following along with my uranium price analysis in ChartWatch, you’re probably less surprised by today’s moves than you were by recent strength in the sector.
ChartWatch
NASDAQ Composite Index

No signs of supply yet...🧐 (click here for full size image)
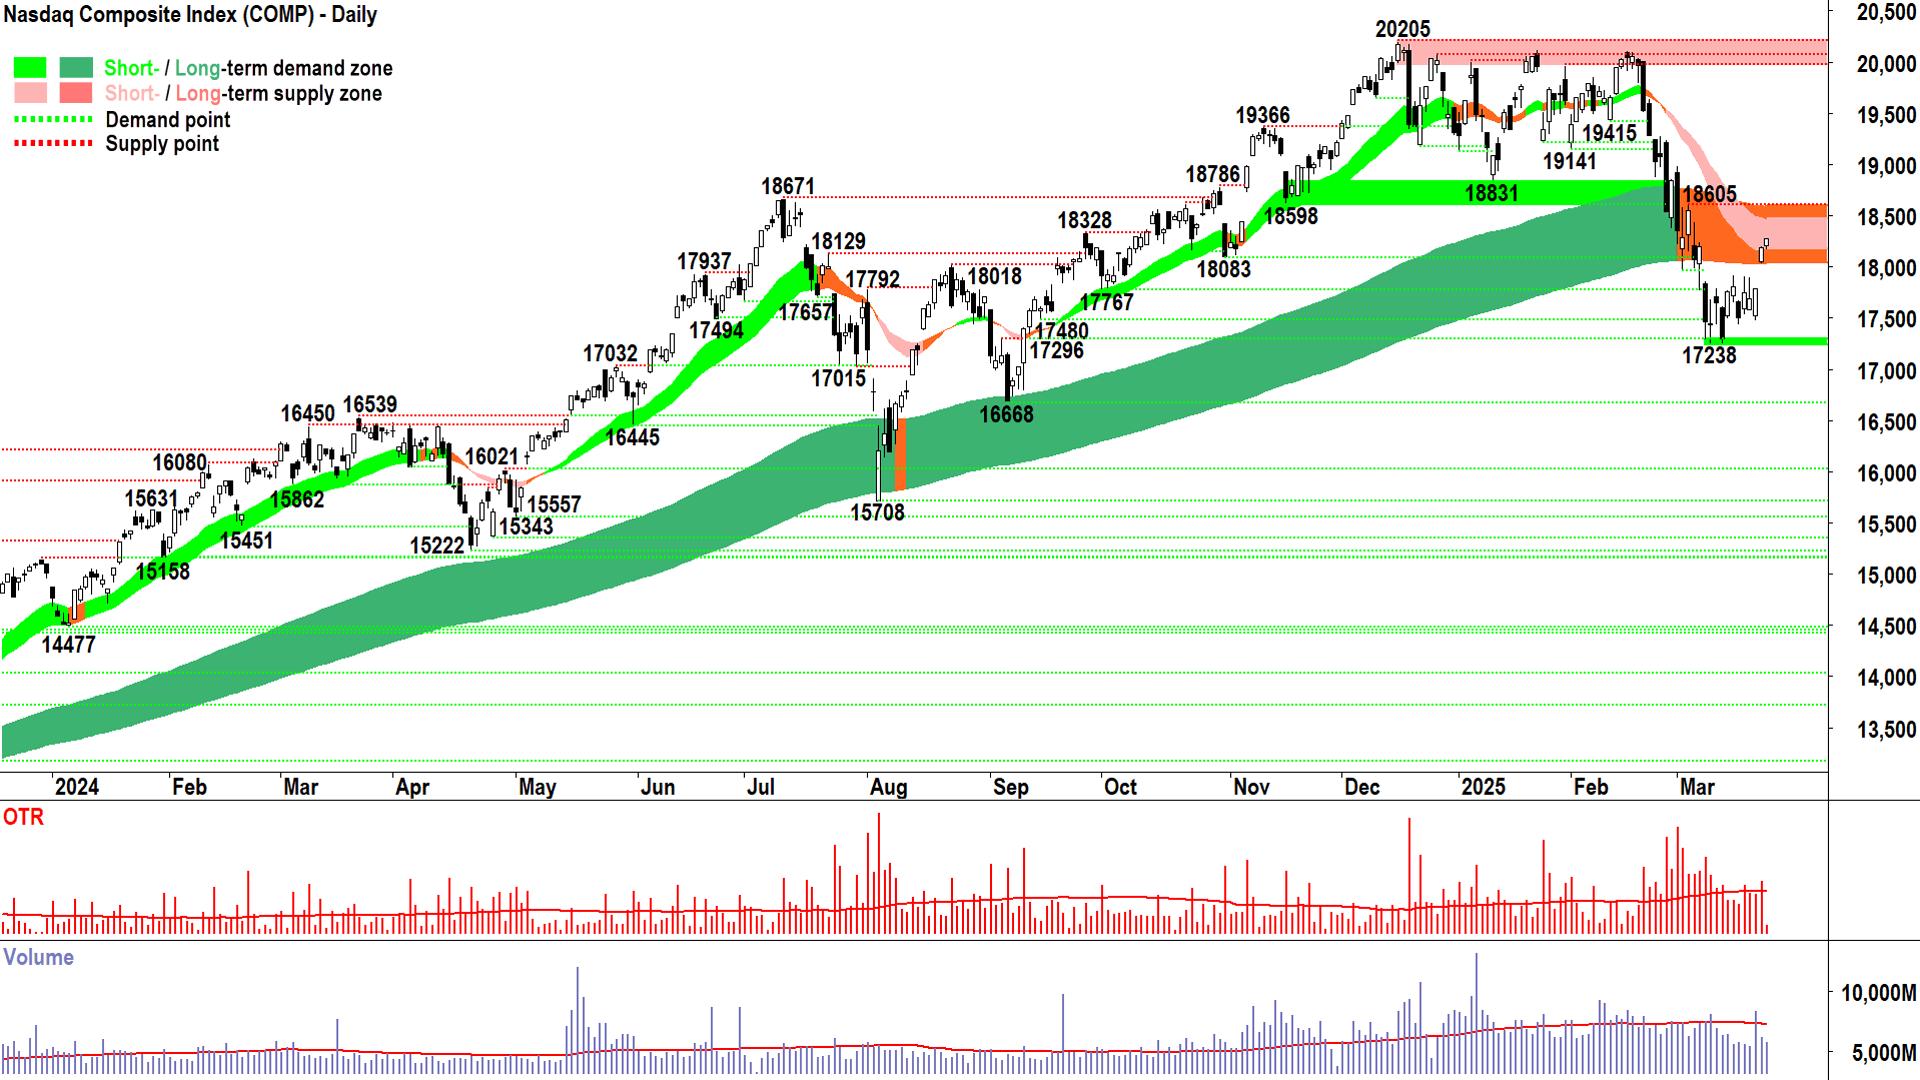
3 quick updates today as they are as incremental as one can get (i.e., +1🕯️!).
Here, on the Comp, no signs of the supply we’d usually associate with the short and long term trend ribbons, with the formation of another small-but-still-white-still-high-session-close candle.
The longer we go without the supply-side impacting the market – the better – and the more likely that as called based on Friday’s candle that the low is in.
16605 is the key hurdle. A close above there – and even the most ardent bears will start asking the questions: Was that it? It is happening to me again!? 😭
You know the drill – On the lookout for the fingerprints of supply:
Black-bodied candles
Upward pointing shadows
Peak formed (higher highs and higher lows transitions to lower high and lower low)
Lower peak formed (supply reinforcement)
S&P/ASX 200 (XJO)
%20chart%2026%20March%202025.png)
Testing the XJO's mettle 💪 (click here for full size image)
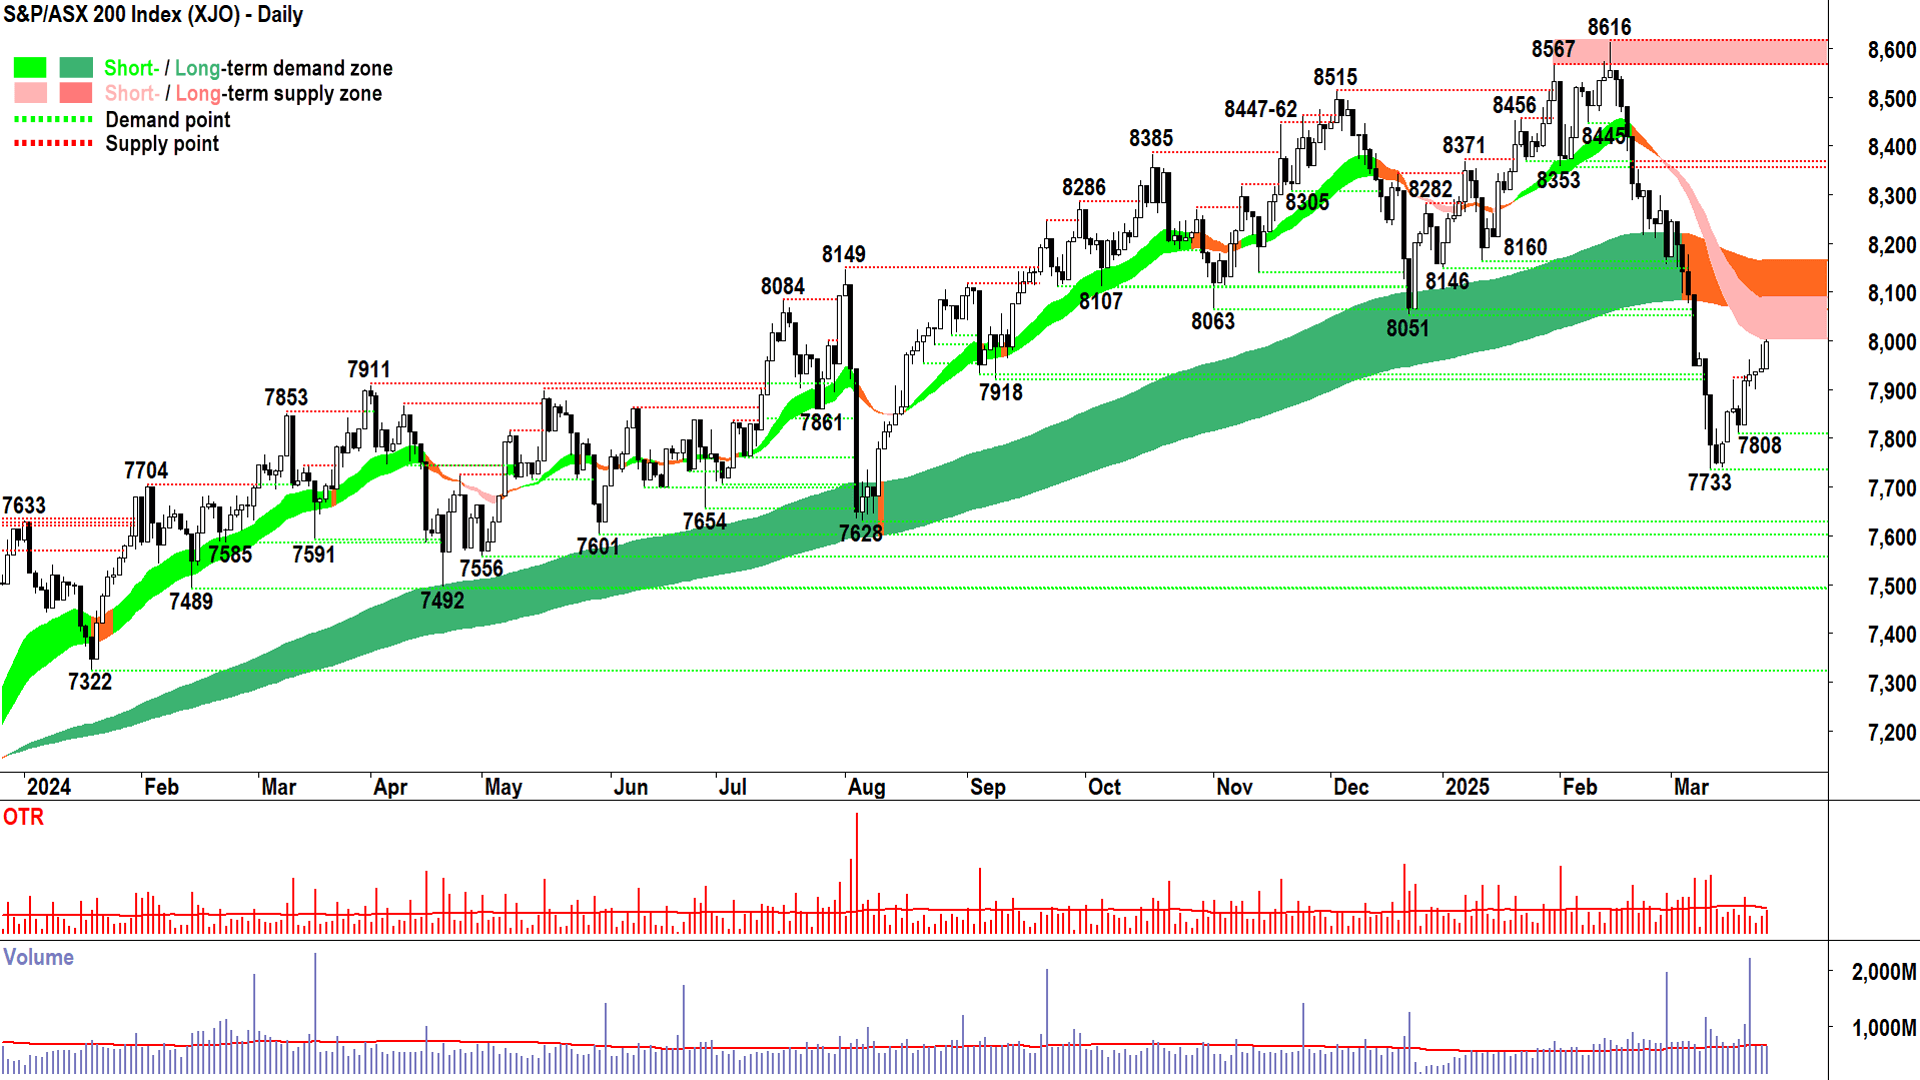
Perhaps yesterday’s scathing criticism of the XJO’s mettle struck home with some patriotic fund managers and they’ve rushed in to make amends.
Tuesday’s sell-the-rally upward pointing shadow has given way to a very solid exhibition of short term demand-side control in the form of today’s full white candle.
Excess demand started the day, supply got out of the way, and excess demand finished the day.
Importantly, the XJO price is now nudging into the confluence of the dynamic supply we expect at the short and long term trend ribbons.
It’s a welcome continuation from last week’s also very solid stamping out of the 7733 major trough (a “major” trough has a sequence of falling peaks and falling troughs on its left, and a sequence of rising peaks and rising troughs on its right).
It seems like we’re in a healthy counter-correction rally. If we can string together a few more days like today’s, it’s going to resemble a V-shape – and those are the rallies most likely to eventually result in a new high down the track 🤞.
Ditto above re Comp – watch out for the fingerprints of supply 👀.
High Grade Copper Futures (Front month, back-adjusted) COMEX
%20COMEX%20chart%2026%20March%202025.png)
What a stunning turn of events! 🚀 (click here for full size image)

I had to follow this one up today as Tuesday’s candle ended up being such a monster – totally at odds with the Monday candle we analysed yesterday – and today’s live candle is nothing less than astonishing!
What a difference a day makes for copper!
In yesterday’s update all of our discussion was about equilibrium – how, after a strong rally, it should be no surprise that price rises enough to eventually entice out enough supply to match the prevailing environment of excess demand.
Well, looking at Tuesday’s candle, equilibrium was fleeting (Tuesday’s candle is the second last on the above chart – because the last is today’s candle). It ended with a long white body, closing well above Monday’s high/intraday point of supply.
It sent any shorts who gambled on at least an intermediate top, scrambling for cover – literally. That, and renewed momentum buying, have taken the move even further in today’s live candle to sniff the multi-year and critical supply zone at 5.3805-5.3935.
As much as we must discount today’s live candle, its upward pointing shadow does indicate at least some credible supply up there – even if this determination is only preliminary.
I propose that if today’s candle can only close around the current price or worse, then the supply in the critical zone will be confirmed – and more than likely this amazing copper rally will take a breather for at least a few candles.
Hey – it’s a live candle – anything can still happen. A close very near, into, or above (best case scenario) the supply zone, would indicate the demand-side remains hungry for more and the supply-side completely unwilling or completely powerless to stop them.
I see demand residing in a zone defined by 5.027-5.1485. Upside momentum remains intact until a close below there, and more generally, the short term uptrend remains intact until a close below the short term uptrend ribbon.
Too early to call a top, again confirmation of the fingerprints of supply are so far lacking, and are required, to do so. In conclusion, I have no reason to doubt the prevailing short and long term uptrends 📈📈.
Economy
Today
AUS Consumer Price Index (CPI) February
Headline: +2.4% p.a. actual vs +2.5% p.a. forecast vs +2.5% p.a. in January
Core (Trimmed Mean): +2.7% p.a. actual vs +2.8% p.a. forecast vs +2.8% p.a. in January
Headline inflation has now been in the target band for 7 consecutive months - but much of this is due to Government subsidies relating to electricity.
It is the third month Trimmed Mean inflation has been within the target band, and increases the likelihood the RBA's preferred quarterly data will do the same when it is released at the end of next month.
Most of the cooling game in goods inflation (+1.3% p.a. down from +1.8% p.a.) while services inflation (+3.6% unchanged) remained disturbingly sticky
Overall, a positive set of results as far as the RBA is concerned, and firms the case for at least another rate cut at either of the next two meetings to finish their work for this easing round (my tip!).
Later this week
Wednesday
20:30 USA Core Durable Goods Orders February (+0.4% m/m forecast vs 0.0% m/m in January)
Thursday
20:30 USA Fina GDP December Quarter (+2.4% p.a. forecast vs +2.3% p.a. in September quarters)
Friday
20:30 USA Core PCE Price Index February (+0.3% m/m and 2.7% p.a. forecast vs +0.3% m/m and 2.6% p.a. in January)
20:30 USA Personal Income February (+0.4% m/m forecast vs +0.9% m/m in January)
20:30 USA Personal Spending February (+0.6% m/m forecast vs -0.2% m/m in January)
Latest News
Interesting Movers
Trading higher
+111.8% European Metals Holdings (EMH) - Cinovec Declared a Strategic Project Under EU CRMA.
+31.9% Ecograf (EGR) - No news since 24-Mar Engineering Study Completed for Midstream Development, rise is consistent with prevailing short and long term uptrends, added to ChartWatch ASX Scans Uptrends list yesterday 🔎📈
+19.9% Larvotto Resources (LRV) - IP Trial Survey Planned for Clarks Gully and Bakers Creek and Eleanora-Garibaldi Drilling Update-amended, rise is consistent with prevailing short and long term uptrends, a regular in ChartWatch ASX Scans Uptrends list 🔎📈
+12.8% Vulcan Energy Resources (VUL) - EU Strategic Project Status Awarded under CRMA, rise is consistent with prevailing short term uptrend and long term trend is transitioning from down to up 🔎📈
+11.8% Gorilla Gold Mines (GG8) - No news since 24-Mar $25m Institutional Placement to Accelerate Growth Strategy, rise is consistent with prevailing short and long term uptrends, a regular in ChartWatch ASX Scans Uptrends list 🔎📈
+10.7% Talga Group (TLG) - Talga graphite mine awarded EU Strategic Project status.
+9.7% MTM Critical Metals (MTM) - No news, bounced perfectly from long term uptrend ribbon! 🔎📈
+9.4% Webjet (WJL) - Change in substantial holding (increase from First Sentier).
+9.2% Tasmea (TEA) - No news 🤔.
+8.3% Antipa Minerals (AZY) - No news since 25-Mar Ignite Investment Summit Hong Kong Presentation, rise is consistent with prevailing short and long term uptrends, a regular in ChartWatch ASX Scans Uptrends list 🔎📈
+8.0% Unico Silver (USL) - No news since 24-Mar Cerro Leon drill results - Revised, general strength across the broader Silver sector today, rise is consistent with prevailing short and long term uptrends 🔎📈
+6.7% Firefly Metals (FFM) - No news since 25-Mar Exceptional drilling results to upgrade Green Bay Resource, rise is consistent with prevailing short and long term uptrends, a recent regular in ChartWatch ASX Scans Uptrends list 🔎📈
+6.0% Ramelius Resources (RMS) - Change in substantial holding (looks like something to do with short selling).
+5.4% Silver Mines (SVL) - No news, general strength across the broader Silver sector today.
+5.2% Cettire (CTT) - No news, bounced in the wake of the recent sharp selloff.
+5.2% Helia Group (HLI) - No news, bounced in the wake of the recent sharp selloff.
+5.1% Southern Cross Gold (SX2) - No news, rise is consistent with prevailing short and long term uptrends, a recent regular in ChartWatch ASX Scans Uptrends list 🔎📈
+5.0% Fisher & Paykel Healthcare Corporation (FPH) - No news, upgraded to buy from neutral at UBS.
+4.9% Spartan Resources (SPR) - No news, rise is consistent with prevailing short and long term uptrends, a regular in ChartWatch ASX Scans Uptrends list 🔎📈
+4.7% Orthocell (OCC) - First Sales of Striate in Germany, Austria & Swiss Region, rise is consistent with prevailing short and long term uptrends 🔎📈
Trading lower
-16.4% Sovereign Metals (SVM) - Sovereign Completes A$40 Million Placement (what goes up, must cap raise! 🤦).
-13.6% Omega Oil & Gas (OMA) - Strong Oil Flows from Canyon-1H well and Investor Call.
-11.6% Paladin Energy (PDN) - Update on the Langer Heinrich Mine and production guidance and Change in substantial holding (looks like another short selling increase), general weakness across the broader Uranium sector today, fall is consistent with prevailing short and long term downtrends, a regular in ChartWatch ASX Scans Downtrends list 🔎📉
-9.4% Syrah Resources (SYR) - Becoming a substantial holder (looks like another short selling increase), repelled perfectly from long term downtrend ribbon! 🔎📉
-7.5% Tuas (TUA) - Half Year Results Presentation.
-6.2% Develop Global (DVP) - No news 🤔.
-5.5% Neuren Pharmaceuticals (NEU) - No news, fall is consistent with prevailing short and long term downtrends, a regular in ChartWatch ASX Scans Downtrends list 🔎📉
-5.4% Lotus Resources (LOT) - No news, general weakness across the broader Uranium sector today, fall is consistent with prevailing short and long term downtrends, a regular in ChartWatch ASX Scans Downtrends list 🔎📉
-4.5% Deep Yellow (DYL) - Ceasing to be a substantial holder from MQG, general weakness across the broader Uranium sector today, fall is consistent with prevailing short and long term downtrends, a regular in ChartWatch ASX Scans Downtrends list 🔎📉
-4.2% Coronado Global Resources (CRN) - No news, fall is consistent with prevailing short and long term downtrends, one of the most Featured (highest conviction) stocks in ChartWatch ASX Scans Downtrends list 🔎📉
-4.0% Boss Energy (BOE) - Boss Energy Honeymoon Analyst Site Visit Presentation, general weakness across the broader Uranium sector today, repelled perfectly from long term downtrend ribbon! 🔎📉
-3.7% DigiCo REIT (DGT) - No news, fall is consistent with prevailing long term downtrend 🔎📉
-3.7% Clarity Pharmaceuticals (CU6) - No news, fall is consistent with prevailing short and long term downtrends, a regular in ChartWatch ASX Scans Downtrends list 🔎📉
Broker Moves
Amplitude Energy (AEL)
Retained at buy at Bell Potter; Price Target: $0.260
Retained at outperform at Macquarie; Price Target: $0.300 from $0.310
Retained at hold at Ord Minnett; Price Target: $0.230
Ampol (ALD)
Retained at buy at Goldman Sachs; Price Target: $31.30 from $31.70
Retained at buy at Ord Minnett; Price Target: $33.00
Aristocrat Leisure (ALL)
Retained at buy at Citi; Price Target: $74.00
ANZ Group (ANZ)
Retained at neutral at Macquarie; Price Target: $28.00
Bapcor (BAP)
Retained at neutral at Citi; Price Target: $5.64
Bendigo and Adelaide Bank (BEN)
Retained at underperform at Macquarie; Price Target: $10.00
Bank of Queensland (BOQ)
Retained at underperform at Macquarie; Price Target: $5.75
Brazilian Rare Earths (BRE)
Retained at buy at Canaccord Genuity; Price Target: $5.50
Breville Group (BRG)
Retained at outperform at Macquarie; Price Target: $41.10
Commonwealth Bank of Australia (CBA)
Retained at underperform at Macquarie; Price Target: $105.00
EBR Systems (EBR)
Retained at buy at Bell Potter; Price Target: $2.69 from $2.26
Fineos Corporation (FCL)
Retained at buy at Citi; Price Target: $2.35 from $2.25
Firefly Metals (FFM)
Retained at buy at Canaccord Genuity; Price Target: $1.950
Fisher & Paykel Healthcare Corporation (FPH)
Upgraded to buy from neutral at UBS; Price Target: NZ$37.30 from NZ$38.10
Gold Road Resources (GOR)
Retained at buy at Bell Potter; Price Target: $3.20 from $2.95
Helia Group (HLI)
Retained at neutral at Goldman Sachs; Price Target: $3.70 from $4.99
Judo Capital (JDO)
Retained at neutral at Macquarie; Price Target: $1.850
James Hardie Industries (JHX)
Retained at hold at Ord Minnett; Price Target: $47.00 from $59.00
KMD Brands (KMD)
Retained at sector perform at RBC Capital Markets; Price Target: NS$0.360 from NS$0.400
Light & Wonder (LNW)
Retained at buy at Citi; Price Target: $200.00
Monadelphous Group (MND)
Retained at neutral at Citi; Price Target: $16.65
Monash IVF Group (MVF)
Retained at hold at Ord Minnett; Price Target: $1.250
National Australia Bank (NAB)
Retained at neutral at Macquarie; Price Target: $35.00
Nickel Industries (NIC)
Retained at outperform at Macquarie; Price Target: $0.850
NRW (NWH)
Retained at buy at Citi; Price Target: $3.85
Orora (ORA)
Retained at outperform at Macquarie; Price Target: $2.42 from $2.50
Pro Medicus (PME)
Upgraded to add from hold at Morgans; Price Target: $250.00
REA Group (REA)
Retained at buy at Citi; Price Target: $227.00 from $230.00
Ramelius Resources (RMS)
Upgraded to outperform from neutral at Macquarie; Price Target: $2.50 from $2.30
Scentre Group (SCG)
Retained at buy at Citi; Price Target: $3.90
Retained at overweight at Morgan Stanley; Price Target: $4.34
Steadfast Group (SDF)
Retained at buy at Goldman Sachs; Price Target: $6.50
Sigma Healthcare (SIG)
Retained at hold at Ord Minnett; Price Target: $2.70 from $2.15
Spark New Zealand (SPK)
Retained at overweight at Macquarie; Price Target: NZ$3.00 from NZ$3.46
Super Retail Group (SUL)
Retained at buy at Citi; Price Target: $18.00
Turaco Gold (TCG)
Retained at buy at Canaccord Genuity; Price Target: $0.750
Tuas (TUA)
Retained at buy at Citi; Price Target: $7.10
Westpac Banking Corporation (WBC)
Retained at underperform at Macquarie; Price Target: $28.00
Scans
Top Gainers
Code | Company | Last | % Chg |
|---|---|---|---|
| EMH | European Metals Holdings Ltd | $0.36 | +111.77% |
| PGD | Peregrine Gold Ltd | $0.21 | +40.00% |
| LSR | Lodestar Minerals Ltd | $0.018 | +38.46% |
| EGR | Ecograf Ltd | $0.475 | +31.94% |
| RGT | Argent Biopharma Ltd | $0.16 | +23.08% |
Top Fallers
Code | Company | Last | % Chg |
|---|---|---|---|
| I88 | Infini Resources Ltd | $0.195 | -27.78% |
| REE | RAREX Ltd | $0.018 | -18.18% |
| HFR | Highfield Resources Ltd | $0.17 | -17.07% |
| AUG | Augustus Minerals Ltd | $0.03 | -16.67% |
| SVM | Sovereign Metals Ltd | $0.815 | -16.41% |
52 Week Highs
Code | Company | Last | % Chg |
|---|---|---|---|
| LSR | Lodestar Minerals Ltd | $0.018 | +38.46% |
| EGR | Ecograf Ltd | $0.475 | +31.94% |
| WYX | Western Yilgarn NL | $0.044 | +22.22% |
| LRV | Larvotto Resources Ltd | $1.055 | +19.89% |
| ABE | Australian Bond Exchange Holdings Ltd | $0.034 | +13.33% |
52 Week Lows
Code | Company | Last | % Chg |
|---|---|---|---|
| HFR | Highfield Resources Ltd | $0.17 | -17.07% |
| AUG | Augustus Minerals Ltd | $0.03 | -16.67% |
| ADO | Anteotech Ltd | $0.012 | -14.29% |
| CNQ | Clean TEQ Water Ltd | $0.21 | -14.29% |
| PDN | Paladin Energy Ltd | $5.65 | -11.58% |
Near Highs
Code | Company | Last | % Chg |
|---|---|---|---|
| WVOL | Ishares MSCI World Ex Aust Minimum Volatility ETF | $44.23 | -0.27% |
| AII | Almonty Industries Inc | $2.47 | -3.52% |
| IAGPF | Insurance Australia Group Ltd | $104.50 | +0.46% |
| IHD | Ishares S&P/ASX DIV Opportunities Esg Screened ETF | $14.32 | +0.85% |
| BILL | Ishares Core Cash ETF | $100.65 | -0.01% |
Relative Strength Index (RSI) Oversold
Code | Company | Last | % Chg |
|---|---|---|---|
| KMD | KMD Brands Ltd | $0.31 | -7.46% |
| REH | Reece Ltd | $15.80 | +0.70% |
| MAQ | Macquarie Technology Group Ltd | $67.68 | -0.47% |
| APX | Appen Ltd | $1.145 | +4.57% |
| RWC | Reliance Worldwide Corporation Ltd | $4.52 | -0.44% |
