

The ASX 200 fell as oil surged 7% overnight — its biggest single-session gain in weeks — after President Trump threatened to escalate strikes following Houthi attacks on Saudi Arabian tankers in the Red Sea, sending gold, base metals, and technology stocks sharply lower. Energy was the lone bright spot, with the index ending the week down 0.3%.
Be sure to click/scroll through for the usual reporting of the major sector and stock-specific moves, the broker responses to them, as well as all the key economic data in tonight's Evening Wrap. Also, I have detailed technical analysis on the Nasdaq Composite and the S&P/ASX 200 in today's ChartWatch.
Let’s dive in!
Today in Review
Name | Value | % Chg |
|---|---|---|
Major Indices | ||
| ASX 200 | 8,772.3 | -0.76% |
| All Ords | 8,941.5 | -0.85% |
| Small Ords | 3,278.5 | -2.08% |
| All Tech | 2,763.4 | -2.90% |
| Emerging Companies | 2,787.2 | -2.33% |
Currency | ||
| AUD/USD | 0.6986 | +0.25% |
US Futures | ||
| S&P 500 | 7,446.75 | +0.02% |
| Dow Jones | 51,990.0 | +0.18% |
| Nasdaq | 28,567.25 | -0.19% |
Name | Value | % Chg |
|---|---|---|
Sector | ||
| Energy | 10,629.1 | +0.93% |
| Financials | 9,744.2 | +0.88% |
| Utilities | 9,562.4 | +0.80% |
| Consumer Staples | 13,075.1 | +0.40% |
| Health Care | 25,198.5 | -0.95% |
| Industrials | 8,217.3 | -1.02% |
| Consumer Discretionary | 3,866.5 | -1.06% |
| Real Estate | 3,520.6 | -1.22% |
| Communication Services | 1,573.5 | -1.52% |
| Materials | 22,740.2 | -2.84% |
| Information Technology | 1,631.6 | -3.98% |
ASX 200 Intraday Chart
%20intraday%20chart_24%20Jul.png)
Markets
The S&P/ASX 200 (XJO) finished 66.7 points lower at 8,772.3, 0.76% from its session high and 0.36% from its low. In the broader-based S&P/ASX 300 (XKO) advancers lagged decliners by a rather miserable 58 to 216.
For the week, the XJO finished down 24.4 points or 0.28% lower, 1.8% from its intraweek high and just 0.5% from its intraweek low.
Energy (XEJ) (+0.9%) was the week's consistent performer and Friday was the exclamation mark — ICE Brent crude futures surged 7.0% overnight to trade at their highest level since May 22, before easing 1.6% to US$99.04/bbl in Asian trade as traders paused to digest the scale of the move.
The Houthi attacks on Saudi Arabian oil tankers, and President Trump's threats of major retaliatory escalation, introduced a meaningful new risk premium into oil markets that could be sticky if the conflict spreads beyond the Strait of Hormuz.
Karoon Energy (KAR) (+10.8%) was the session's biggest energy mover — a stock whose operational leverage to oil prices amplifies commodity moves in both directions. Woodside Energy (WDS) (+1.8%), Santos (STO) (+1.5%), and Beach Energy (BPT) (+2.3%) were all strongly higher.
%20intraday%20chart_24%20Jul%20-%20Copy.png)
ASX 200 Financial XFJ) intraday chart
Financials (XFJ) (+0.9%) was an unusual winner on a day when surging oil stoked bond yield fears — the sector typically suffers when rate expectations spike. What appears to have happened, as has occurred on multiple occasions across recent weeks, is that large institutional funds used the sector as a vehicle to buffer the index from deeper losses and maintain portfolio positioning in a liquid, income-generating sector.
The late-session buying was again concentrated in the closing price auction, with the major banks posting solid gains: National Australia Bank (NAB) (+1.5%), ANZ (ANZ) (+1.4%), Westpac (WBC) (+1.4%), and Commonwealth Bank (CBA) (+1.0%).
If not for this resilience — things could have been much uglier for the ASX 200!
%20COMEX%20chart_24%20Jul.png)
Gold Futures (Front month, back-adjusted) COMEX chart
The Gold Sub-Index (XGD) (-4.2%) bore Friday's most concentrated damage. The overnight 7% oil surge was simply too large for gold to absorb — the inflationary implications of crude at $US99/bbl reignited US rate hike fears with full force, lifting benchmark bond yields and crushing non-yielding precious metals. COMEX gold futures fell 2.5% overnight before recovering a modest 0.2% to US$4,044/oz in Asian trade — a recovery that did nothing to arrest equity selling.
Gold miners face a double hit on days like this: falling commodity revenue and rising diesel cost pressure compress margins from both directions. Predictive Discovery (PDI) (-6.7%), Catalyst Metals (CYL) (-6.3%), Pantoro Gold (PNR) (-6.1%), Perseus Mining (PRU) (-5.6%), Greatland Gold (GGP) (-6.4%), and Capricorn Metals (CMM) (-6.1%) were all savaged.
%20intraday%20chart_24%20Jul%20-%20Copy.png)
ASX 200 Information Technology (XIJ) intraday chart
Information Technology (XIJ) (-4.0%) was brutalised by the bond yield surge — higher discount rates applied to the distant future earnings of high-P/E growth stocks compress their valuations with mathematical precision. The sector had no help from Wall Street either, where Tesla tumbled 14.5% and Alphabet shed 6.9% on renewed AI capital expenditure concerns, delivering a one-two punch to local tech sentiment. WiseTech Global (WTC) (-4.6%), Xero (XRO) (-4.5%), Life360 (360) (-4.4%), Technology One (TNE) (-3.9%), NextDC (NXT) (-3.6%), and Megaport (MP1) (-3.3%) were all sharply lower.
%20intraday%20chart_24%20Jul.png)
ASX 200 Materials (XMJ) intraday chart
Materials (XMJ) (-2.8%) completed the trilogy of commodity-and-yield-sensitive sectors to fall hard. The overnight copper price dropped 2.3% before recovering 0.1% to US$6.35/lb in Asian trade, leaving copper stocks with poor leads from two directions — softer prices and higher input costs from diesel. Capstone Copper (CSC) (-5.0%), Sandfire Resources (SFR) (-4.3%), South32 (S32) (-3.6%), and BHP (BHP) (-2.9%) led the selling. James Hardie Industries (JHX) (-0.2%) eased modestly after Jarden downgraded the stock to Neutral, citing increased construction sector risk.
Lithium stocks gave back the week's tentative recovery as investor confidence — fragile at best following a correction of more than 30% from May's peak — crumbled again. GFEX lithium carbonate futures fell 0.5% to CNY 144,280/t and Australian spodumene concentrate in China eased 0.7% to US$2,115/t — modest commodity price moves that nonetheless triggered outsized equity reactions. Liontown Resources (LTR) (-7.4%), Core Lithium (CXO) (-5.9%), Elevra Lithium (ELV) (-5.6%), IGO (IGO) (-5.1%), Mineral Resources (MIN) (-2.3%), and Pilbara Minerals (PLS) (-2.1%) all fell.
Today's best ASX Top 300 gainers
Company | Last Price | Change $ | Change % | 1mo % | 1yr % |
|---|---|---|---|---|---|
| Karoon Energy (KAR) | $1.79 | +$0.175 | +10.8% | +27.0% | -6.3% |
| Benz Mining Corp (BNZ) | $3.26 | +$0.25 | +8.3% | +53.8% | +447.9% |
| GR Engineering Services (GNG) | $5.65 | +$0.25 | +4.6% | +2.4% | +54.8% |
| Supply Network (SNL) | $33.06 | +$1.39 | +4.4% | +0.8% | -16.4% |
| Nufarm (NUF) | $2.94 | +$0.10 | +3.5% | +8.9% | +7.7% |
| Credit Corp Group (CCP) | $13.77 | +$0.35 | +2.6% | +9.4% | -9.1% |
| Treasury Wine Estates (TWE) | $4.73 | +$0.12 | +2.6% | +2.4% | -41.5% |
| Austal (ASB) | $3.87 | +$0.09 | +2.4% | -11.0% | -36.8% |
| Rural Funds Group (RFF) | $2.22 | +$0.05 | +2.3% | +8.3% | +21.3% |
| Beach Energy (BPT) | $0.905 | +$0.02 | +2.3% | -3.7% | -33.9% |
| Stockland (SGP) | $4.13 | +$0.09 | +2.2% | -0.7% | -23.8% |
| Ridley Corporation (RIC) | $2.81 | +$0.06 | +2.2% | +5.6% | -2.1% |
| Sonic Healthcare (SHL) | $21.22 | +$0.42 | +2.0% | +7.0% | -25.1% |
| Dalrymple Bay Infrastructure (DBI) | $5.72 | +$0.11 | +2.0% | -4.7% | +25.2% |
| Woodside Energy Group (WDS) | $32.37 | +$0.57 | +1.8% | +13.0% | +28.1% |
| Heartland Group Holdings (HGH) | $1.018 | +$0.018 | +1.8% | +1.8% | +39.4% |
| Santos (STO) | $7.97 | +$0.12 | +1.5% | +9.0% | +3.5% |
| National Australia Bank (NAB) | $40.39 | +$0.58 | +1.5% | +5.4% | +7.2% |
| Insurance Australia Group (IAG) | $8.55 | +$0.12 | +1.4% | +3.3% | +0.1% |
| ANZ Group Holdings (ANZ) | $36.47 | +$0.51 | +1.4% | +2.0% | +19.8% |
Today's worst ASX Top 300 losers
Company | Last Price | Change $ | Change % | 1mo % | 1yr % |
|---|---|---|---|---|---|
| Centuria Capital Group (CNI) | $1.455 | -$0.135 | -8.5% | -28.3% | -16.3% |
| Clarity Pharmaceuticals (CU6) | $2.35 | -$0.21 | -8.2% | +14.6% | -45.5% |
| IperionX (IPX) | $3.07 | -$0.26 | -7.8% | -26.7% | -51.5% |
| DroneShield (DRO) | $2.04 | -$0.17 | -7.7% | -19.4% | -39.5% |
| ALS (ALQ) | $20.46 | -$1.68 | -7.6% | -9.5% | +12.9% |
| Liontown (LTR) | $1.185 | -$0.095 | -7.4% | -37.0% | +23.4% |
| FireFly Metals (FFM) | $1.65 | -$0.13 | -7.3% | -4.3% | +47.6% |
| Resolute Mining (RSG) | $0.925 | -$0.07 | -7.0% | -14.4% | +40.2% |
| Kingsgate Consolidated (KCN) | $4.08 | -$0.30 | -6.8% | -29.7% | +63.9% |
| Predictive Discovery (PDI) | $0.63 | -$0.045 | -6.7% | -32.6% | +40.0% |
| Greatland Resources (GGP) | $10.03 | -$0.68 | -6.3% | -24.6% | +43.3% |
| Catalyst Metals (CYL) | $5.63 | -$0.38 | -6.3% | -1.6% | +14.2% |
| Capricorn Metals (CMM) | $11.90 | -$0.77 | -6.1% | -10.5% | +28.4% |
| Regis Resources (RRL) | $5.97 | -$0.38 | -6.0% | -11.7% | +36.9% |
| Deep Yellow (DYL) | $1.34 | -$0.085 | -6.0% | -10.4% | -24.7% |
| Develop Global (DVP) | $5.37 | -$0.34 | -6.0% | -17.9% | +16.7% |
| Elsight (ELS) | $5.94 | -$0.37 | -5.9% | -18.4% | +191.2% |
| Emerald Resources NL (EMR) | $5.19 | -$0.32 | -5.8% | -14.1% | +38.0% |
| MA Financial Group (MAF) | $5.72 | -$0.35 | -5.8% | -10.8% | -27.1% |
| Brazilian Rare Earths (BRE) | $3.78 | -$0.23 | -5.7% | -20.1% | +56.2% |
Chartwatch
Nasdaq Composite Index
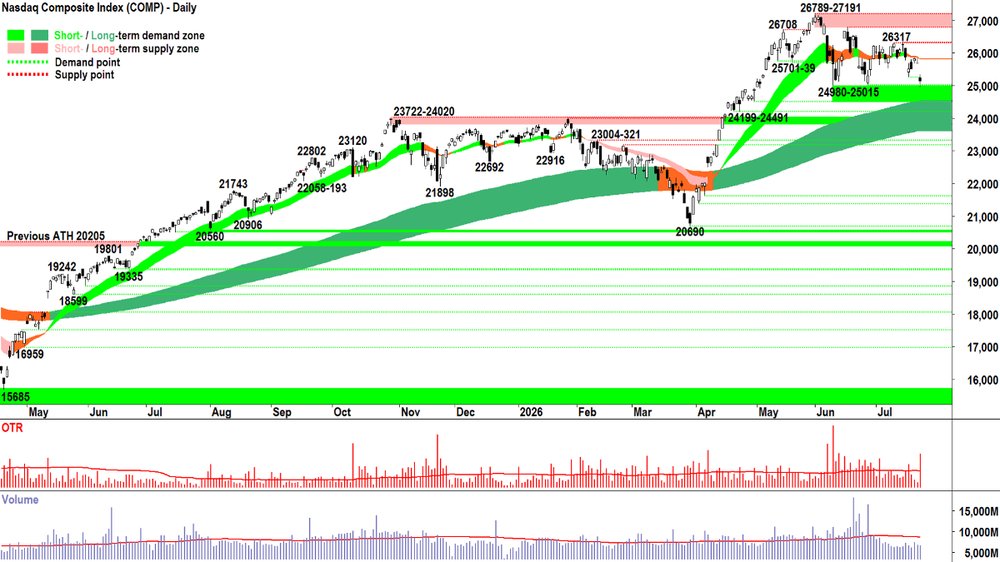
Nasdaq Composite Index chart
Analysis
Looks worse than it probably is. The headlines say: “Nasdaq plunges +500 points”…
But we see: “Downward pointing shadow exactly where we’d expect — in the 24980-25015 demand zone”.
To be fair, it’s easy to maintain such a dispassionate perspective when half of the capital you’ve allocated to investing in the US is in cash!
And that’s kinda the most important / best bit about having a model like this to manage your portfolio risk. MOTN it gives you great balance. ⚖️ Balance with respect to regularly having the optimal mix of risk and cash, but far more importantly: emotional balance. 🧘
Sure, it’s not great that 50% of one’s capital is still invested… But when you consider that most investors are BHP Technique (Buy, Hold, Pray) 100% of the time… It’s still pretty good.
Anyways, what to do now? 🤔
We really only have one question to answer:
Cut risk more by moving to 1/3RP?
Maintain the present 1/2RP?
That’s the Act step, so it seems we’ve missed a couple of important bits! Back to Analyse!
(Yes, copy and paste from yesterday — that’s the deal — Analyse occurs at the end of EVERY candle!)
ST Trend = 🟧 and TURNING LOWER! 👎
LT Trend = 🟩 and ⬆️. Losing a little bit of steam as the ST trend extends sideways, but still a clear indication that in the longer term, D > S. 👍
Price action = Falling peaks and troughs 📉 (i.e., STR + NUTE + FOHO) 👎
Candles = Must add in the black bit to last nights gap-down, so it's actually big and black despite that modest downward pointing shadow. Mixed at best, but definitely trending towards supply side control ⚠️
Volatility = (i.e., check OTR) Last night's candle is an important session — we should sit up and take note of what it's telling us! ⚠️
Volume = Malaise... disengaged demand side in an environment of fear and uncertainty means there could be little in the way of a motivated supply side. ⚠️
Points/Zones of Demand/Supply = 24980-25015 appears holding, for now. Plenty of supply now likely all the way back up to 26789-27191. ⚖️
View
👎👍👎⚠️⚠️⚠️⚖️ = Not great in terms of the MOTN for where the Comp is headed next! Sticking with 1/2RP on my US portfolio for now. Let's see how the candles fall at the 24980-25015 and long term uptrend ribbon (presently 23619-24532) demand zones — we'll know soon enough if we need to shave off some more risk... (RP = Risk Position — it reflects my personal allowable capital allocation limit for my investments in US stocks. So 1/2RP is 50%, 2/3RP is 67% and FRP is 100%)
Key Levels
26789-27191 is the key zone of supply vs 24980-25015 is the key zone of demand. In between = 1/2RP vs >= FRP and <= 1/3RP.
S&P/ASX 200 (XJO)
%20chart_24%20Jul.png)
S&P/ASX 200 (XJO) chart
Analysis
Is today the payback for the absolutely lousy market breadth within the OTP over the last few weeks?
We know that it has probably been aided by a few strategic and well-timed buy orders in a quiet market (quiet = see consistently below average volume).
Yet, most days we've logged more stocks down than up, and a good day, it might have been only roughly even.
In my experience: A market will MOTN struggle to do anything really good when it's firing on only half of its cylinders.
How do I, as a technical analyst, resolve all of those long downward pointing shadows (thanks XFJ plunge protection team! 😉) against the last two days' strong supply side showing? 🤔
That's easy. 👇
View
I'm 1/2RP on my Aussie portfolio ⚖️ (i.e., my personal allowable capital allocation limit for my investments in Australian stocks is 50%).
Key Levels
8984-9022 is the key zone of supply, while demand is at 8708-8656.
(Glossary of acronyms! Old Tin Pot (OTP): S&P/ASX 200 | MOTN: More Often Than Not | FOMO: Fear Of Missing Out | HOFU: Holding On For Upside | BTD: Buy The Dip | NUTE: No Urgency To Enter | FOHO: Fear Of Holding On | STR: Sell The Rally | RP: Risk Position | FFS: Fund Flow Shenanigans!)
***CHARTWATCH LIVE WEBINARS — NEW VIDEO DROPPED 📺🍿***
Lithium masterclass, plus CSL flashing sell signal vs WDS flashing buy signal! 🚨🚨
ChartWatch LIVE Webinar
ChartWatch LIVE Webinars – WEEKLY Wednesday's @ 12pm AEDT
Learn more about technical analysis and trend following through real case studies on ASX stocks. Australia's premier technical analyst, Carl Capolingua, shares his unique insights on stocks as requested by viewers. Ask about a company in your portfolio or anything related to trading and investing and get Carl's expert opinion.
Places are limited so >REGISTER NOW!<
Economy
Today
AUS July Flash Purchasing Managers Index (PMI)
Manufacturing: 51.7 vs 51.5 in June (revised up from 51.2)
Services: 53.0 vs 50.5 in June (revised up from 49.9)
Reader: Decently better than expected and both over the 50 mark which delineates growth from contraction. So, Aussie manufacturing and services (in particular) businesses are growing faster than expected!
Later this week
Friday
23:45 USA July Flash PMIs
Manufacturing: 54.5 forecast vs 51.5 in June (revised down from 55.7)
Services: 51.4 forecast vs 50.5 in June (revised down from 51.3)
Saturday
00:00 USA June New Home Sales (604,000 forecast vs 580,000 in May)
Interesting Movers
Trading higher
- Medical Developments International (MVP) $0.50+28.2%
Rose after it announced its quarterly activity report for the quarter ended 30 June 2026. Group revenue for Q4 FY26 was $10.5 million, $0.3 million higher than the prior corresponding period (pcp). Revenue for the year was $42.6 million, $3.5 million higher than the pcp. Management said that FY26 earnings before interest and tax is now expected to be modestly improved on FY25.
- Carnegie Clean Energy (CCE) $0.35+22.8%
Rose on no news, performance reflected prevailing short and long term uptrends. CCE is a regular in the ChartWatch ASX Scans Uptrends List.
- Karoon Energy (KAR) $1.79+10.8%
Rose on no news, performance reflected general strength in the broader energy sector.
- GR Engineering Services (GNG) $5.65+4.6%
Rose after it announced that it has executed an engineering, procurement and construction (EPC) contract with BHP Iron Ore for the Yandi Eastern Front-End Facility upgrade; contract sum is $229.5 million.
- Supply Network (SNL) $33.06+4.4%
Rose after it announced unaudited accounts for the year ended 30 June 2026. Consolidated sales revenue was $403.1m and profit after income tax is expected to be around $47.7m. Management noted the business is targeting revenue growth of around $50m in FY27.
- Beach Energy (BPT) $0.91+2.3%
Rose on no news, performance reflected general strength in the broader energy sector.
- Woodside Energy Group (WDS) $32.37+1.8%
Rose on no news, performance reflected general strength in the broader energy sector. WDS is a recent regular in the ChartWatch ASX Scans Uptrends List.
- Santos (STO) $7.97+1.5%
Rose on no news, performance reflected general strength in the broader energy sector.
Trading Lower
- Brainchip Holdings (BRN) $0.12-7.7%
Fell after it announced the put option agreement entered into with LDA Capital Limited expired on 30 June 2026. LDA sold approximately 6.96 million BrainChip shares from the collateral shares; proceeds of approximately A$1.0 million were applied in full to discharge the failure fee obligation. Move also likely due to weakness in the information technology sector and prevailing short and long term downtrends.
- DroneShield (DRO) $2.04-7.7%
Fell on no news, performance reflected general weakness in the broader defence sector and prevailing short and long term downtrends. DRO is a regular in the ChartWatch ASX Scans Downtrends List.
- Forrestania Resources (FRS) $0.37-7.5%
Fell after it announced a batch of assay results from the British Hill drill program, and reflected prevailing short and long term downtrends.
- Liontown (LTR) $1.19-7.4%
Fell on no news, performance reflected general weakness in the broader lithium sector and prevailing short and long term downtrends.
- Kingsgate Consolidated (KCN) $4.08-6.8%
Fell on no news, performance reflected general weakness in the broader gold sector and prevailing short and long term downtrends.
- Predictive Discovery (PDI) $0.63-6.7%
Fell on no news, performance reflected general weakness in the broader gold sector and prevailing short and long term downtrends. PDI is a regular in the ChartWatch ASX Scans Downtrends List.
- Catalyst Metals (CYL) $5.63-6.3%
Fell on no news, performance reflected general weakness in the broader gold sector and prevailing short and long term downtrends. CYL is a regular in the ChartWatch ASX Scans Downtrends List.
- Regis Resources (RRL) $5.97-6.0%
Fell after it announced quarterly gold production of 101.5koz at an AISC of $3,244/oz; management warned costs in the final quarter of FY26 were impacted primarily by higher diesel prices and higher stockpile related non-cash costs.
- Perseus Mining (PRU) $4.76-5.6%
Fell on no news, performance reflected general weakness in the broader gold sector and prevailing short and long term downtrends. PRU is a regular in the ChartWatch ASX Scans Downtrends List.
- CAR Group (CAR) $23.92-3.9%
Fell on no news, reflected prevailing short and long term downtrends. BRE is a regular in the ChartWatch ASX Scans Downtrends List.
- CAR Group (CAR) $23.92-3.9%
Fell on no news, performance reflected general weakness in the broader information technology sector and prevailing short and long term downtrends. CAR has become a recent regular in the ChartWatch ASX Scans Downtrends List.
Broker Moves
Company | Broker | Action | Rating | Price Target |
|---|---|---|---|---|
A4NAlpha HPA | Ord Minnett | Upgraded | Speculative Buy(from Accumulate) | $0.90 |
ALCAlcidion Group | Bell Potter | Retained | Buy | $0.15(from $0.16) |
AUBAUB Group | UBS | Retained | Buy | $33.00(from $34.00) |
AUEAurum Resource | Canaccord Genuity | Retained | Speculative Buy | $1.40 |
BHPBHP Group | Citi | Retained | Neutral | $63.00 |
BSLBlueScope Steel | UBS | Retained | Buy | $37.50(from $27.50) |
CSLCSL | UBS | Retained | Buy | $158.00 |
FCLFINEOS Corporation Holdings PLC | Macquarie | Retained | Outperform | $3.50 |
GDGGeneration Development Group | Bell Potter | Retained | Buy | $6.20 |
| Citi | Retained | Buy | $5.70(from $5.50) | |
| Jefferies | Retained | Buy | $6.35 | |
| Macquarie | Retained | Outperform | $5.05(from $4.90) | |
| Moelis Australia | Retained | Buy | $6.96(from $6.72) | |
| Morgan Stanley | Retained | Overweight | $6.40 | |
| Morgans | Retained | Buy | $6.89(from $6.28) | |
IAGInsurance Australia Group | JPMorgan | Downgraded | Neutral(from Overweight) | $8.45(from $7.70) |
| UBS | Retained | Buy | $9.45(from $8.80) | |
JHXJames Hardie Industries Plc | Jarden | Downgraded | Neutral(from Overweight) | $37.60(from $34.20) |
| Morgans | Upgraded | Hold(from Trim) | $40.00(from $36.00) | |
| Ord Minnett | Upgraded | Accumulate(from Hold) | $42.00(from $31.50) | |
| UBS | Retained | Neutral | $30.00 | |
KARKaroon Energy | Jarden | Retained | Buy | $2.00(from $1.90) |
| Macquarie | Retained | Neutral | $1.55 | |
| Morgan Stanley | Retained | Equal Weight | $1.58 | |
| RBC Capital Markets | Upgraded | Outperform(from Sector Perform) | $2.00 | |
MPLMedibank Private | UBS | Retained | Neutral | $5.15(from $4.85) |
MQGMacquarie Group | CLSA | Retained | Outperform | $272.40 |
| Jefferies | Retained | Buy | $284.03(from $253.73) | |
| JPMorgan | Retained | Overweight | $275.00(from $265.00) | |
| Morgan Stanley | Retained | Overweight | $273.00(from $263.00) | |
| Morgans | Retained | Hold | $255.80(from $248.32) | |
MXIMaxiPARTS | Ord Minnett | Retained | Buy | $2.80 |
NHFNIB Holdings | UBS | Retained | Neutral | $7.60(from $7.05) |
NWHNRW Holdings | Morgans | Retained | Accumulate | $8.00(from $6.60) |
PNVPolynovo | Bell Potter | Downgraded | Hold(from Buy) | $1.00(from $2.00) |
| E&P | Retained | Positive | $2.65 | |
| Macquarie | Retained | Outperform | $1.30(from $1.75) | |
RIORio Tinto | Citi | Retained | Neutral | $171.00(from $185.00) |
S32South32 | Citi | Retained | Buy | $5.30(from $6.10) |
SEKSEEK | UBS | Retained | Buy | $18.20 |
SFRSandfire Resources | Argonaut Securities | Retained | Hold | $19.50(from $19.00) |
| CLSA | Retained | Hold | $18.90(from $18.60) | |
| JPMorgan | Downgraded | Neutral(from Overweight) | $19.00(from $21.00) | |
| RBC Capital Markets | Downgraded | Sector Perform(from Outperform) | $20.00 | |
| UBS | Retained | Neutral | $20.55(from $20.70) | |
SGHSGH | UBS | Retained | Buy | $58.00(from $59.00) |
SNSSenSen Networks | Bell Potter | Retained | Buy | $0.08(from $0.10) |
SS1Sun Silver | Canaccord Genuity | Retained | Speculative Buy | $2.85 |
STOSantos | Citi | Retained | Buy | $8.30 |
| CLSA | Retained | Outperform | $10.40 | |
| Jarden | Retained | Overweight | $7.90(from $7.65) | |
| Morgan Stanley | Retained | Overweight | $7.67 | |
| RBC Capital Markets | Retained | Outperform | $8.00 | |
| UBS | Retained | Buy | $8.30 | |
WESWesfarmers | Macquarie | Retained | Neutral | $88.00 |
Scans
Top Gainers
Code | Company | Last | % Chg |
|---|---|---|---|
| UM1 | Unity Metals Ltd | $0.145 | +45.00% |
| MVP | Medical Developments International Ltd | $0.50 | +28.21% |
| SPLR | Starpharma Holdings Ltd | $0.125 | +27.55% |
| AT4 | American Tungsten & Antimony Ltd | $0.041 | +24.24% |
| CCE | Carnegie Clean Energy Ltd | $0.35 | +22.81% |
Top Fallers
Code | Company | Last | % Chg |
|---|---|---|---|
| ACS | Accent Resources NL | $0.012 | -52.00% |
| 10X | Exultant Mining Ltd | $0.155 | -22.50% |
| AZ9 | Azzuro Resources Plc | $0.015 | -21.05% |
| GTI | Gratifii Ltd | $0.019 | -20.83% |
| PKY | Pathkey.Ai Ltd | $0.031 | -18.42% |
52 Week Highs
Code | Company | Last | % Chg |
|---|---|---|---|
| CCE | Carnegie Clean Energy Ltd | $0.35 | +22.81% |
| KRR | King River Resources Ltd | $0.063 | +14.55% |
| AFP | Aft Pharmaceuticals Ltd | $3.75 | +13.98% |
| PGO | Pacgold Ltd | $0.17 | +13.33% |
| SEN | Senetas Corporation Ltd | $3.52 | +6.67% |
52 Week Lows
Code | Company | Last | % Chg |
|---|---|---|---|
| 10X | Exultant Mining Ltd | $0.155 | -22.50% |
| AZ9 | Azzuro Resources Plc | $0.015 | -21.05% |
| GTI | Gratifii Ltd | $0.019 | -20.83% |
| IMA | Image Resources NL | $0.019 | -13.64% |
| LRM | Lion Rock Minerals Ltd | $0.019 | -13.64% |
Near Highs
Code | Company | Last | % Chg |
|---|---|---|---|
| GLPR | iShares Ftse GBL Property Ex Aus (Aud Hedged) ETF | $29.30 | 0.00% |
| BEAR | Betashares Australian Equities Bear Complex ETF | $7.45 | +1.64% |
| RHC | Ramsay Health Care Ltd | $42.30 | -0.07% |
| AN3PI | Australia and New Zealand Banking Group Ltd | $102.75 | -0.41% |
| WVOL | iShares MSCI World Ex Aust Minimum Volatility ETF | $45.08 | -0.04% |
Relative Strength Index (RSI) Oversold
Code | Company | Last | % Chg |
|---|---|---|---|
| PME | Pro Medicus Ltd | $159.82 | -1.43% |
| PEN | Peninsula Energy Ltd | $0.245 | -5.77% |
| EOL | Energy One Ltd | $10.54 | -3.04% |
| WC8 | Wildcat Resources Ltd | $0.355 | -4.05% |
| BRN | Brainchip Holdings Ltd | $0.12 | -7.69% |
