News | Market Wraps
Evening Wrap: ASX 200 gains on WDS, STO rebound, RIO pops 3% as uranium stock BOE tanks
The S&P/ASX 200 closed 14.1 points higher, up 0.18%.

Mentioned
ASX 200 futures are down 70pts (-0.89%) as of 8:30 am AEDT.
In addition to the bounce in oil, gas, and coal plays, there was plenty of strength across Resources (XJR) (+0.98%) more generally, as the big miners also rebounded and the Gold (XGD) sub-index (+1.4%) regained its winning ways.
Rio Tinto (RIO) (+3.0%) and Mineral Resources (MIN) (+3.3%) helped stack the most sector-index points.
But it wasn’t all chocolates and roses for Energy stocks today, however. The uranium price remains firmly in the doldrums, and as a result, uranium stocks were generally belted – again.
Click/scroll through for the usual reporting of the major sector and stock-specific moves, the broker responses to them, as well as all the key upcoming economic data in tonight's Evening Wrap.
Also, I have detailed technical analysis on the NASDAQ Composite and the S&P/ASX 200 in today's ChartWatch.
Let's dive in!
Today in Review
Mon 10 Mar 25, 5:03pm (AEST)
Name | Value | % Chg |
|---|---|---|
Major Indices | ||
| ASX 200 | 7,962.3 | +0.18% |
| All Ords | 8,191.7 | +0.16% |
| Small Ords | 3,064.8 | +0.30% |
| All Tech | 3,635.0 | +0.14% |
| Emerging Companies | 2,228.5 | +0.48% |
Currency | ||
| AUD/USD | 0.6311 | +0.08% |
US Futures | ||
| S&P 500 | 5,742.5 | -0.58% |
| Dow Jones | 42,640.0 | -0.46% |
| Nasdaq | 20,085.75 | -0.71% |
Name | Value | % Chg |
|---|---|---|
Sector | ||
| Energy | 7,857.3 | +1.50% |
| Materials | 16,413.3 | +0.89% |
| Utilities | 8,701.2 | +0.58% |
| Real Estate | 3,608.4 | +0.44% |
| Consumer Discretionary | 3,902.6 | +0.23% |
| Industrials | 7,865.3 | +0.16% |
| Information Technology | 2,455.8 | +0.01% |
| Consumer Staples | 11,516.4 | -0.01% |
| Financials | 8,275.5 | -0.10% |
| Health Care | 42,165.4 | -0.58% |
| Communication Services | 1,662.0 | -0.74% |
Markets

ASX 200 Session Chart
The S&P/ASX 200 (XJO) finished 14.1 points higher at 7,962.3, 0.20% from its session high, and roughly smack–bang at the mid-point of the session's range. In the broader-based S&P/ASX 300 (XKO), advancers beat decliners by a modest 152 to 117.
A bounce. Not much of one, but given the severity of the correction from Valentine’s Day high of 8616 – who are we to complain? 🙏
It wouldn’t do us any good anyway!
"Bounce" was the theme of the day, and we’ll discuss the nature of bounces from a technical analysis standpoint in this evening’s ChartWatch below.
For now, note that the Energy (XEJ) (+1.5%) sector bounced, led by heavyweights Woodside Energy Group (ASX: WDS) (1.9%) and Santos (ASX: STO) (+1.3%), but well supported by strong gains in Beach Energy (ASX: BPT) (4.1%), and coal stocks Whitehaven Coal (ASX: WHC) (+3.5%) and Yancoal Australia (ASX: YAL) (+2.5%).
Why? Crude oil prices got a rare reprieve from the recent selloff on Friday, and the natural gas price continued its recent fine form. Elsewhere, the thermal coal price extended its rally into a fifth day – and is now up 8% from the 3-year low it set just last week.
But it wasn’t all chocolates and roses for Energy stocks today, however. The uranium price remains firmly in the doldrums, and as a result, uranium stocks were generally belted – again. Boss Energy (ASX: BOE) (-3.9%), Deep Yellow (ASX: DYL) (-2.5%), Nexgen Energy (ASX: NXG) (-1.4%), and Paladin Energy (ASX: PDN) (-0.93%) each slid further towards the bottom-right edge of their charts (as each has been doing it for some time as per my ChartWatch ASX Scans Downtrends lists!)
Will they every actually reach that bottom-right edge? I can't say, but it appears they're trying very hard! 📉
In addition to the bounce in oil, gas, and coal plays, there was plenty of strength across Resources (XJR) (+0.98%) more generally, as the big miners also rebounded and the Gold (XGD) sub-index (+1.4%) regained its winning ways.
Iron ore stocks Rio Tinto (ASX: RIO) (+3.0%) and Mineral Resources (ASX: MIN) (+3.3%) helped stack the most sector-index points. In gold, there were several very strong performances from mid-and-smaller-cap producers that may be considered beneficiaries of the upcoming S&P index rebalancing (see Interesting Moves section below for more details).
It wasn't a case of commodity price support in Resources as it was in Energy, though, as gold, iron ore, and most base metals prices are largely unchanged compared to our Friday update.
So why the strength in Energy and Resources? 🤔
There is, I suggest, a bit of portfolio reshuffling going on at the moment that may explain their outperformance. These sectors are trading at fractions of the P/E Ratios of their cousins Financials (XFJ) (-0.10%), Health Care (XHJ) (-0.58%) and Communication Services (XTJ) (-0.74%) – today’s three worst performing sectors.
ChartWatch
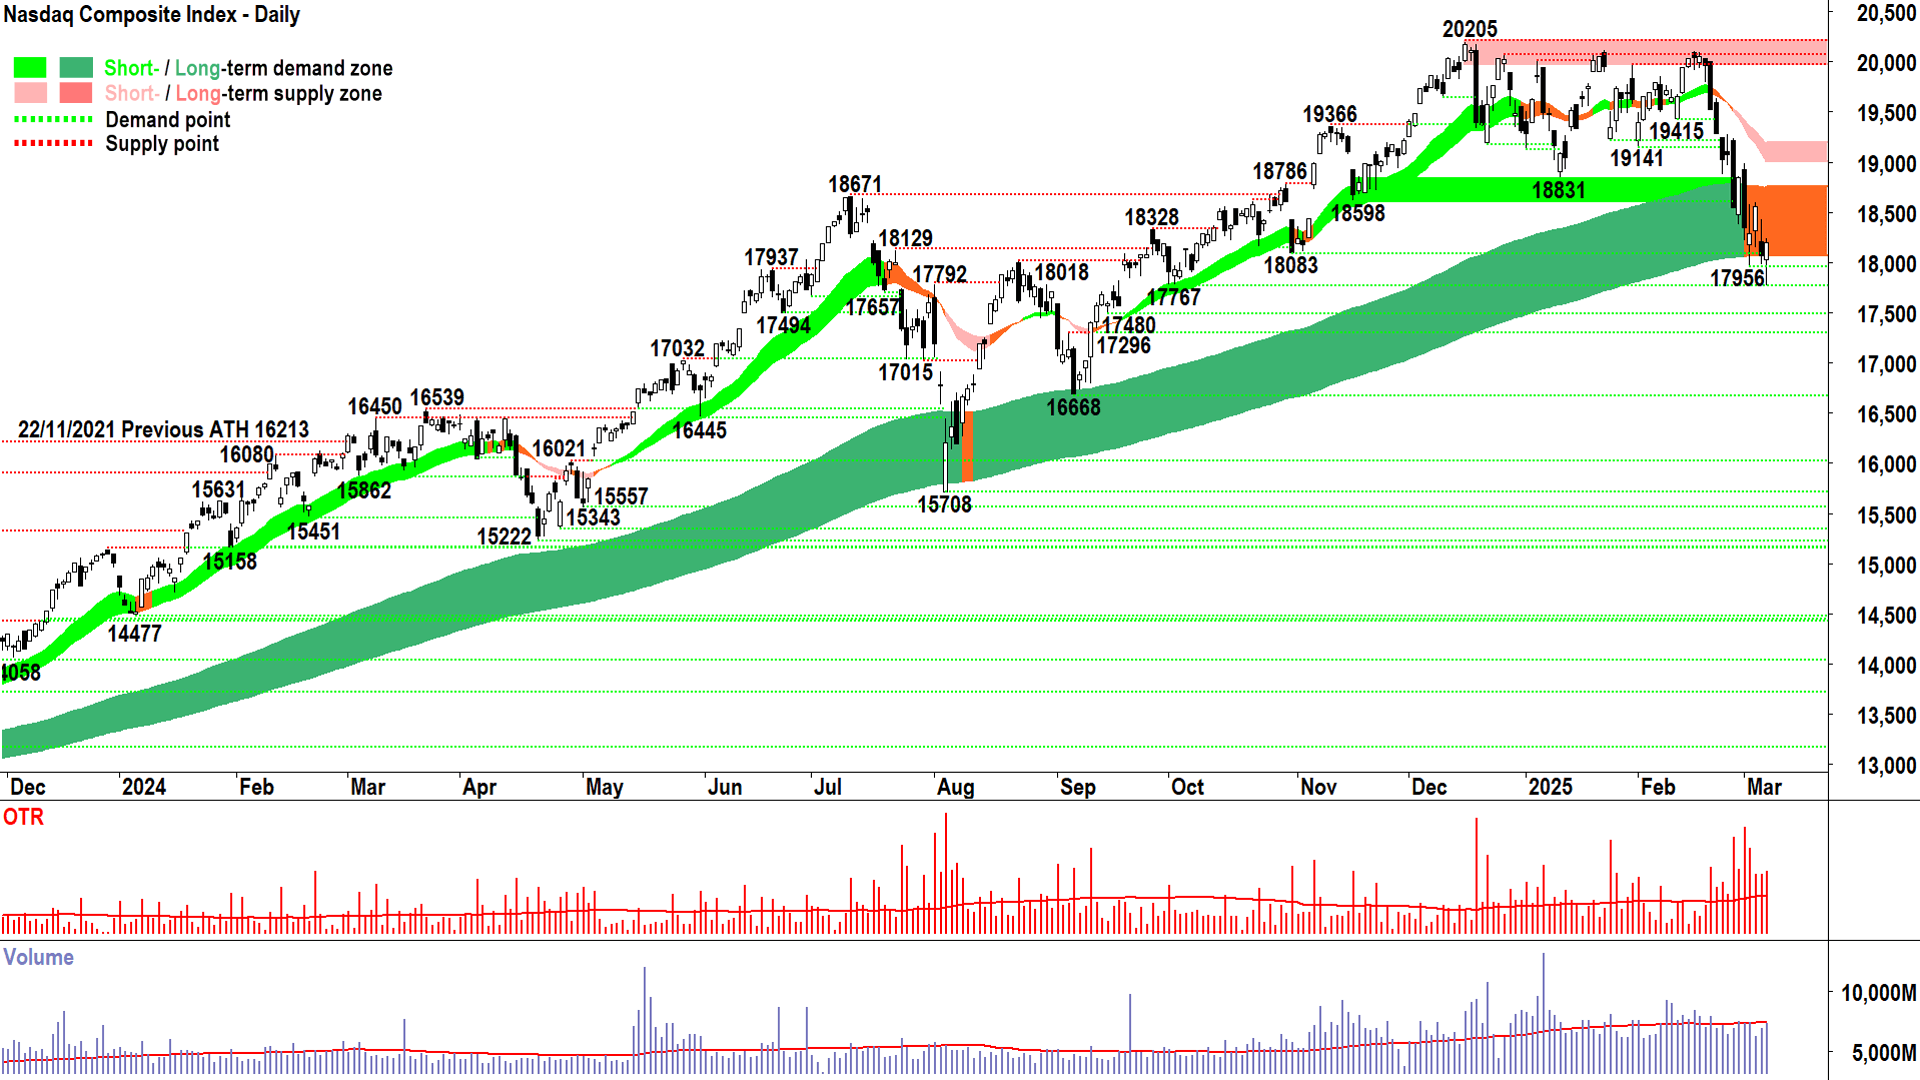
NASDAQ Composite Index

Hanging on by a fingernail...💅 (click here for full size image)
A quick update with respect to our recent candle-by-candle coverage of the Comp!
Hey, another NOT close below the long term trend ribbon. Also, another credible demand-side showing logged in the process (white-bodied and downward pointing shadow).
I propose there appears to be a decent whack of excess demand lurking around the lows of this correction – and Friday’s candle increases the probability we may well get a meaningful bounce from here.
It’s still a little touch-and-go, but the longer the supply-side are resisted in cracking and holding below the long term trend ribbon/18,000 handle/static points of demand at 17767-18083 – the less motivated the supply-side will grow towards letting go near those levels – and the more emboldened the demand-side will grow towards buying into them.
Two demand-side candles are better than one...as is the case for two better than three…and so on. So, some confirmation of the demand-side’s growing strength here is critical – and best if it comes tonight.
Should a rally ensue, then we shouldn’t bet overly excited as there will likely be a wall of supply all the way back up – starting with the short term downtrend ribbon.
The “demand-side is making a stand here” thesis is bust on a close below Friday’s low of 17768.6. Lights out for the bulls should that occur, and we’ll likely then probe 16668-17296.
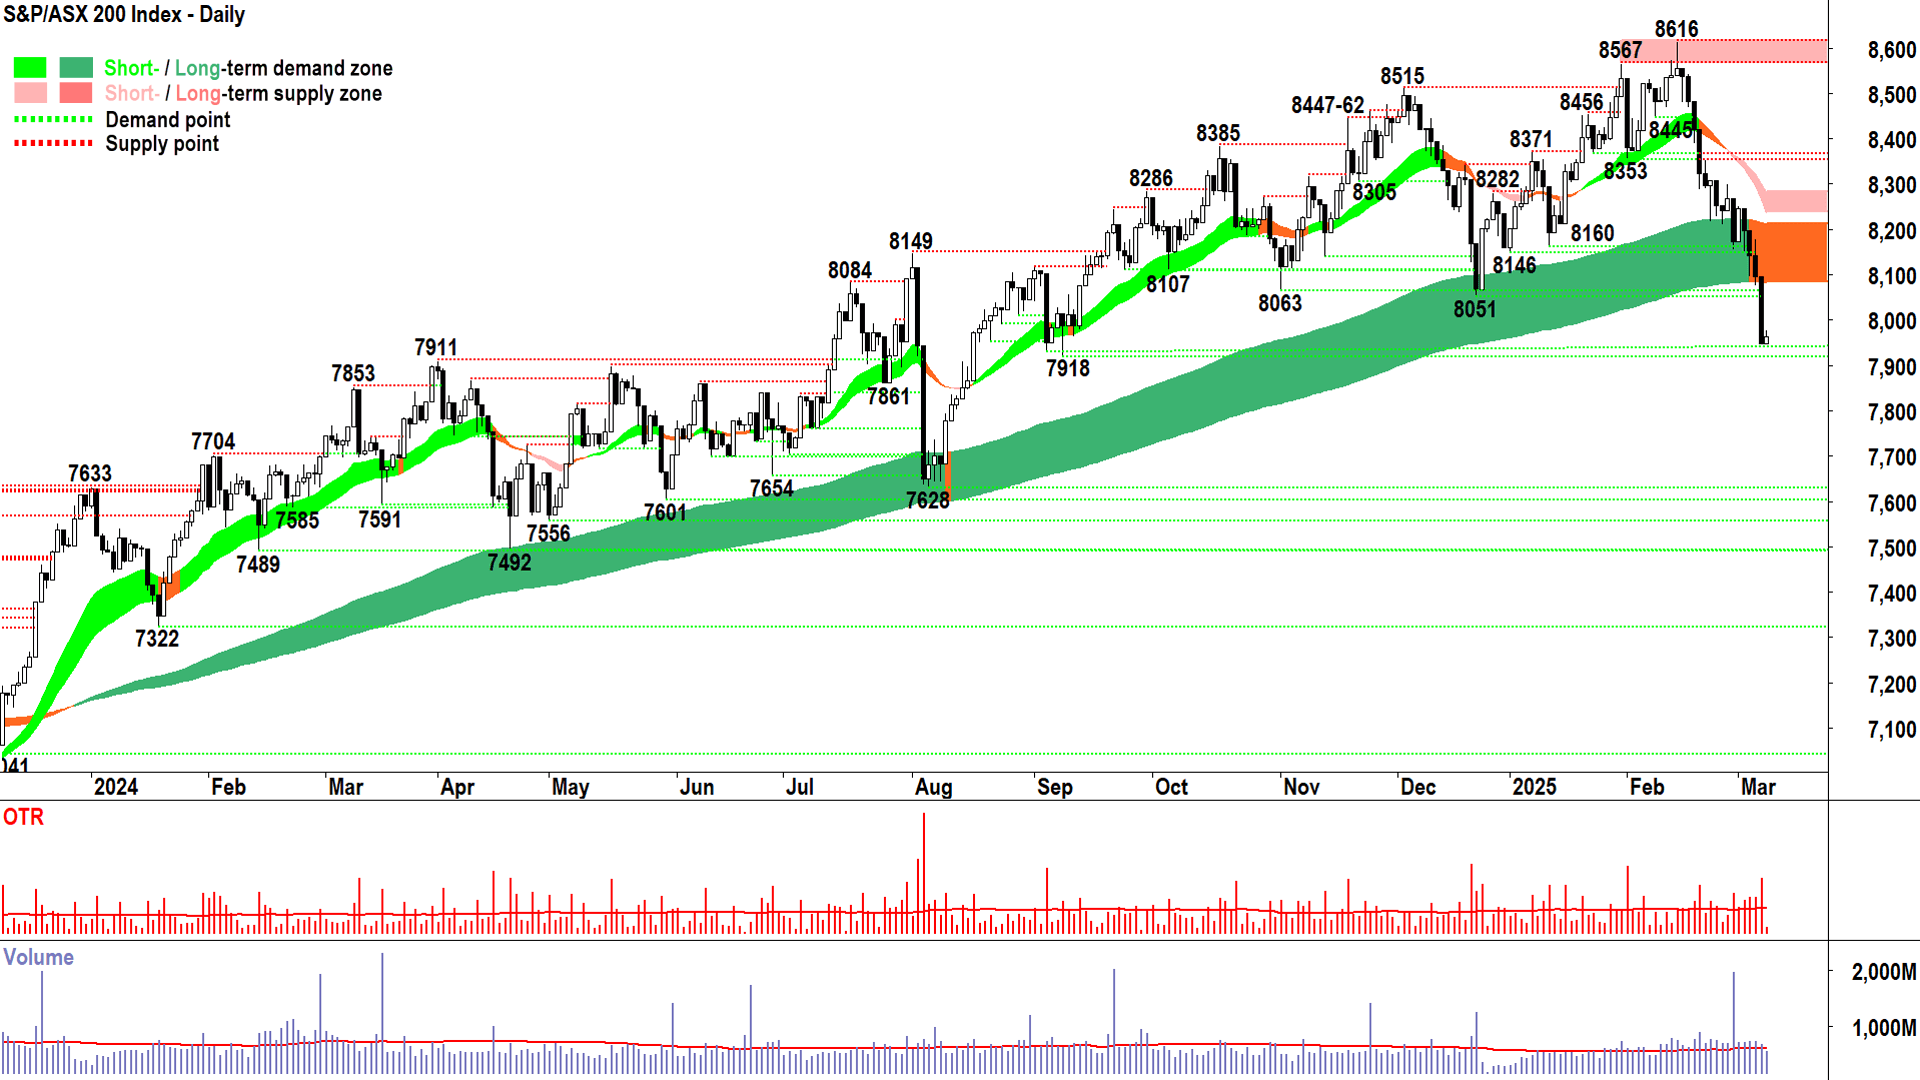
S&P/ASX 200 (XJO)
%20Intraday%20chart%2010%20March%202025.png)
How high does a dead cat bounce? 🙀 (click here for full size image)
There’s an old saying in markets: "Take a dead cat, drop it from a great height, see how high it bounces".
Don’t get me wrong, I love cats, I have two at home. They’re quite well and healthy and I would never contemplate carrying out an experiment to determine the answer to this age-old question.
But, the rhetorical answer to the aforementioned conundrum is: "Not very much, but if you drop it from high enough, probably a bit…" 🙀
Take for example Friday’s and today’s price action on the XJO.
On Friday (and really for the past 3 weeks), the market gods dropped have the XJO from a great height – you can tell this from Friday’s big black candle (and its many friends immediately prior).
Today, the XJO bounced. About as high as a dead cat would, I suspect.
Market analogies aside, in my experience, bounces are less likely to succeed when they are small and prolonged compared to the decline that preceded them. It is a signal the supply-side remains in control and or the demand-side is not yet ready to commit. Often, such bounces occur with small bodies and or upward pointing shadows.
Strong bounces – that is ones more likely to succeed – are large compared to the decline that preceded them, but also occur very soon in response. A large and fast bounce indicates the supply-side lacked power and follow-though and that the demand-side greedily jumped on the lower prices and supply-side volumes. Often, such bounces occur with long white bodies and or long downward pointing shadows.
I’ll let you decide which category today’s candle/bounce fits into. 🤔
All deceased animals and the depositing of them over the sides of buildings, cliffs, or out of aircraft aside – 7918 is shaping as an important point of demand, given we’re now well into “not above the long term uptrend ribbon territory”.
It’s a long way down to the next clear point of demand at 7626 if from there. 🪂
Looking back up, frustratingly, the long term trend ribbon which for so long acted as a zone of dynamic demand for the XJO – may begin to act as a zone of dynamic supply.
Economy
Today
There weren't any major data releases in our time zone today
Later this week
Tuesday
07:30 AUS Westpac Consumer Sentiment
08:30 AUS NAB Business Confidence
22:00 USA JOLTS Job Openings February (7.71 million forecast vs 7.60 million in January)
Wednesday
20:30 USA Core Consumer Price Index (CPI) February m/m (+0.3% forecast vs +0.3% in January)
Thursday
20:30 USA Core Producer Price Index (PPI) February m/m (+0.3% forecast vs +0.4% in January)
Friday
22:00 USA Prelim UoM Consumer Sentiment March (63.8% forecast vs 64.7 in February)
22:00 USA Prelim UoM Inflation Expectations March (+4.3% p.a. in February)
Latest News
Interesting Movers
Trading higher
+13.2% Larvotto Resources (LRV) - S&P DJI Announces March 2025 Quarterly Rebalance, general strength across the broader Gold sector today, rise is consistent with prevailing long term uptrend 🔎📈
+13.0% Catalyst Metals (CYL) - S&P DJI Announces March 2025 Quarterly Rebalance, general strength across the broader Gold sector today, rise is consistent with prevailing short and long term uptrends, a regular in ChartWatch ASX Scans Uptrends list 🔎📈
+11.4% Droneshield (DRO) - No news since 03-Feb Change in substantial holding, rise is consistent with prevailing short term uptrend and long term trend is transitioning from down to up 🔎📈
+8.3% Gorilla Gold Mines (GG8) - No news, general strength across the broader Gold sector today, rise is consistent with prevailing short and long term uptrends, a recent regular in ChartWatch ASX Scans Uptrends list 🔎📈
+6.3% Spartan Resources (SPR) - S&P DJI Announces March 2025 Quarterly Rebalance, general strength across the broader Gold sector today, rise is consistent with prevailing long term uptrend 🔎📈
+6.0% Nuix (NXL) - S&P DJI Announces March 2025 Quarterly Rebalance, bounced in the wake of the recent sharp selloff.
+5.7% Black Cat Syndicate (BC8) - S&P DJI Announces March 2025 Quarterly Rebalance, general strength across the broader Gold sector today, rise is consistent with prevailing short and long term uptrends, a regular in ChartWatch ASX Scans Uptrends list 🔎📈
+5.5% Kingsgate Consolidated (KCN) - No news, general strength across the broader Gold sector today.
+5.4% Catapult Group International (CAT) - S&P DJI Announces March 2025 Quarterly Rebalance, general strength across the broader Gold sector today, rise is consistent with prevailing short and long term uptrends, a regular in ChartWatch ASX Scans Uptrends list 🔎📈
+5.3% Temple & Webster Group (TPW) - S&P DJI Announces March 2025 Quarterly Rebalance, rise is consistent with prevailing short and long term uptrends, a regular in ChartWatch ASX Scans Uptrends list 🔎📈
+5.0% Ora Banda Mining (OBM) - S&P DJI Announces March 2025 Quarterly Rebalance, Davyhurst Site Visit Presentation, and Corporate Presentation - Euroz Hartleys Conference, general strength across the broader Gold sector today, rise is consistent with prevailing short and long term uptrends, a regular in ChartWatch ASX Scans Uptrends list 🔎📈
Trading lower
-12.5% Johns Lyng Group (JLG) - S&P DJI Announces March 2025 Quarterly Rebalance and (StateStreet is a rumoured active short seller), fall is consistent with prevailing short and long term downtrends, one of the most Featured (highest conviction) stocks in ChartWatch ASX Scans Downtrends list 🔎📉
-5.7% Vaneck Bitcoin ETF (VBTC) - No news, prices of several major cryptos sharply lower on Friday.
-4.5% Peninsula Energy (PEN) - Half Yearly Report and Accounts, fall is consistent with prevailing short and long term downtrends, one of the most Featured (highest conviction) stocks in ChartWatch ASX Scans Downtrends list 🔎📉
-4.3% St Barbara (SBM) - H2 FY25 Production and Cost Guidance Update and S&P DJI Announces March 2025 Quarterly Rebalance, fall is consistent with prevailing short term downtrend and long term trend is transitioning from up to down 🔎📉
-4.3% WA1 Resources (WA1) - No news, fall is consistent with prevailing short term downtrend and long term trend is transitioning from up to down, a regular in ChartWatch ASX Scans Downtrends list 🔎📉
-3.9% Boss Energy (BOE) - Boss takes option over uranium exploration project in the NT, fall is consistent with prevailing short and long term downtrends, a regular in ChartWatch ASX Scans Downtrends list 🔎📉
-3.6% Webjet (WJL) - S&P DJI Announces March 2025 Quarterly Rebalance, fall is consistent with prevailing short and long term downtrends, a regular in ChartWatch ASX Scans Downtrends list 🔎📉
Broker Moves
Abacus Group (ABG)
Retained at buy at Citi; Price Target: $1.350
Amplitude Energy (AEL)
Retained at buy at Bell Potter; Price Target: $0.260
Alligator Energy (AGE)
Retained at accumulate at Bell Potter; Price Target: $0.100
Amcor (AMC)
Retained at outperform at Macquarie; Price Target: $18.20
Eagers Automotive (APE)
Retained at add at Morgans; Price Target: $16.20
Aspen Group (APZ)
Retained at buy at Bell Potter; Price Target: $3.05
Austal (ASB)
Retained at neutral at Citi; Price Target: $4.30
Abacus Storage King (ASK)
Retained at buy at Citi; Price Target: $1.400
Avjennings (AVJ)
Retained at buy at Bell Potter; Price Target: $0.700
Bapcor (BAP)
Retained at add at Morgans; Price Target: $5.95
Brickworks (BKW)
Retained at neutral at Macquarie; Price Target: $27.30
Boss Energy (BOE)
Retained at buy at Bell Potter; Price Target: $4.80
Beach Energy (BPT)
Retained at buy at Bell Potter; Price Target: $1.700
Bluescope Steel (BSL)
Retained at outperform at Macquarie; Price Target: $28.70
BWP Trust (BWP)
Retained at neutral at Citi; Price Target: $3.40
Brambles (BXB)
Retained at outperform at Macquarie; Price Target: $21.85
Charter Hall Group (CHC)
Retained at neutral at Citi; Price Target: $18.50
Retained at overweight at Morgan Stanley; Price Target: $20.00
Centuria Industrial Reit (CIP)
Retained at buy at Bell Potter; Price Target: $3.35
Charter Hall Long Wale Reit (CLW)
Retained at neutral at Citi; Price Target: $4.00
Centuria Capital Group (CNI)
Retained at sell at Bell Potter; Price Target: $1.700
Centuria Office Reit (COF)
Retained at hold at Bell Potter; Price Target: $1.200
Comet Ridge (COI)
Retained at buy at Bell Potter; Price Target: $0.210
Charter Hall Retail Reit (CQR)
Retained at buy at Citi; Price Target: $4.00
Conrad Asia Energy (CRD)
Retained at buy at Bell Potter; Price Target: $1.900
Cedar Woods Properties (CWP)
Retained at buy at Bell Potter; Price Target: $7.20
Cleanaway Waste Management (CWY)
Retained at outperform at Macquarie; Price Target: $3.40
Catalyst Metals (CYL)
Retained at buy at Morgans; Price Target: $4.56 from $4.04
Dexus Convenience Retail Reit (DXC)
Retained at buy at Bell Potter; Price Target: $3.30
Dexus Industria Reit (DXI)
Retained at hold at Bell Potter; Price Target: $2.90
Dexus (DXS)
Retained at neutral at Citi; Price Target: $7.80
Fletcher Building (FBU)
Retained at underperform at Macquarie; Price Target: $1.760
Fineos Corporation (FCL)
Retained at outperform at Macquarie; Price Target: $2.45
GDI Property Group (GDI)
Retained at buy at Bell Potter; Price Target: $0.800
Goodman Group (GMG)
Retained at buy at Citi; Price Target: $40.00
Retained at outperform at CLSA; Price Target: $39.77
Growthpoint Properties Australia (GOZ)
Retained at buy at Citi; Price Target: $2.60
GPT Group (GPT)
Retained at buy at Citi; Price Target: $5.00
GWA Group (GWA)
Retained at outperform at Macquarie; Price Target: $3.15
Healthco Healthcare and Wellness Reit (HCW)
Retained at buy at Bell Potter; Price Target: $1.300
Homeco Daily Needs Reit (HDN)
Retained at hold at Bell Potter; Price Target: $1.350
Hartshead Resources (HHR)
Retained at buy at Bell Potter; Price Target: $0.030
HMC Capital (HMC)
Retained at buy at Bell Potter; Price Target: $12.90
Ingenia Communities Group (INA)
Retained at buy at Citi; Price Target: $6.50
James Hardie Industries (JHX)
Retained at outperform at Macquarie; Price Target: $65.00
Lifestyle Communities (LIC)
Retained at hold at Bell Potter; Price Target: $8.55
Retained at neutral at Citi; Price Target: $9.70
Lendlease Group (LLC)
Retained at neutral at Citi; Price Target: $7.50
Lotus Resources (LOT)
Retained at buy at Bell Potter; Price Target: $0.500
Retained at outperform at Macquarie; Price Target: $0.380
Mirvac Group (MGR)
Retained at neutral at Citi; Price Target: $2.20
Mineral Resources (MIN)
Retained at neutral at Citi; Price Target: $30.00
Medibank Private (MPL)
Retained at buy at Ord Minnett; Price Target: $4.80
Macquarie Group (MQG)
Retained at sell at Citi; Price Target: $177.00
NIB (NHF)
Retained at buy at Ord Minnett; Price Target: $7.65
National Storage Reit (NSR)
Retained at buy at Citi; Price Target: $2.70
Nextdc (NXT)
Retained at buy at Citi; Price Target: $18.70
Orora (ORA)
Retained at outperform at Macquarie; Price Target: $2.50
Orica (ORI)
Retained at neutral at Citi; Price Target: $19.00
Retained at outperform at Macquarie; Price Target: $20.91 from $20.87
Paladin Energy (PDN)
Retained at buy at Bell Potter; Price Target: $11.00
Retained at buy at Jefferies; Price Target: $9.00 from $10.00
Qantas Airways (QAN)
Retained at neutral at Macquarie; Price Target: $9.65
Reece (REH)
Retained at neutral at Macquarie; Price Target: $21.00
Region Group (RGN)
Retained at buy at Citi; Price Target: $2.40
Reliance Worldwide Corporation (RWC)
Retained at outperform at Macquarie; Price Target: $5.90
Scentre Group (SCG)
Retained at buy at Citi; Price Target: $3.90
SGH (SGH)
Retained at outperform at Macquarie; Price Target: $56.10
Sims (SGM)
Retained at outperform at Macquarie; Price Target: $15.70
Stockland (SGP)
Retained at buy at Citi; Price Target: $5.80
Superloop (SLC)
Retained at overweight at Morgan Stanley; Price Target: $2.65
Synlait Milk (SM1)
Retained at hold at Bell Potter; Price Target: $0.900 from $0.425
Strike Energy (STX)
Retained at hold at Bell Potter; Price Target: $0.260
Southern Cross Gold (SX2)
Retained at buy at Bell Potter; Price Target: $4.80 from $4.00
Unibail-Rodamco-Westfield (URW)
Retained at buy at Citi; Price Target: $85.20
Vicinity Centres (VCX)
Retained at neutral at Citi; Price Target: $2.40
West African Resources (WAF)
Retained at buy at Ord Minnett; Price Target: $2.65 from $2.55
Scans
Top Gainers
Code | Company | Last | % Chg |
|---|---|---|---|
| WOA | Wide Open Agriculture Ltd | $0.018 | +63.64% |
| RML | Resolution Minerals Ltd | $0.014 | +55.56% |
| HT8 | Harris Technology Group Ltd | $0.015 | +50.00% |
| LMS | Litchfield Minerals Ltd | $0.195 | +34.48% |
| CMG | Critical Minerals Group Ltd | $0.155 | +29.17% |
Top Fallers
Code | Company | Last | % Chg |
|---|---|---|---|
| ANR | Anatara Lifesciences Ltd | $0.011 | -71.80% |
| PNT | Panther Metals Ltd | $0.015 | -16.67% |
| CYM | Cyprium Metals Ltd | $0.017 | -15.00% |
| IVX | Invion Ltd | $0.115 | -14.82% |
| HAW | Hawthorn Resources Ltd | $0.044 | -13.73% |
52 Week Highs
Code | Company | Last | % Chg |
|---|---|---|---|
| HT8 | Harris Technology Group Ltd | $0.015 | +50.00% |
| NMG | New Murchison Gold Ltd | $0.012 | +26.32% |
| CYL | Catalyst Metals Ltd | $4.68 | +13.04% |
| OMA | Omega Oil & Gas Ltd | $0.43 | +11.69% |
| DYM | Dynamic Metals Ltd | $0.35 | +9.38% |
52 Week Lows
Code | Company | Last | % Chg |
|---|---|---|---|
| ANR | Anatara Lifesciences Ltd | $0.011 | -71.80% |
| CAN | Cann Group Ltd | $0.024 | -11.11% |
| TOE | Toro Energy Ltd | $0.18 | -10.00% |
| CHL | Camplify Holdings Ltd | $0.48 | -9.43% |
| DEM | De.Mem Ltd | $0.10 | -9.09% |
Near Highs
Code | Company | Last | % Chg |
|---|---|---|---|
| GLDN | Ishares Physical Gold ETF | $36.74 | 0.00% |
| MTO | Motorcycle Holdings Ltd | $2.02 | +0.50% |
| JEPI | Jpmorgan EQ Prem Income Active ETF (Managed Fund) | $55.78 | +0.41% |
| GXLD | Global X Gold Bullion ETF | $46.03 | -0.09% |
| ASIA | Betashares Asia Technology Tigers ETF | $11.15 | -3.21% |
Relative Strength Index (RSI) Oversold
Code | Company | Last | % Chg |
|---|---|---|---|
| GMG | Goodman Group | $30.72 | +0.62% |
| PGC | Paragon Care Ltd | $0.435 | +3.57% |
| ACQ | Acorn Capital Investment Fund Ltd | $0.765 | -1.29% |
| FLT | Flight Centre Travel Group Ltd | $14.82 | -1.85% |
| BRN | Brainchip Holdings Ltd | $0.205 | 0.00% |
