News | Market Wraps
Evening Wrap: ASX 200 cracks key support as big banks MQG, CBA and ANZ slice billions off super fund balances

Mentioned
ASX 200 futures are up 69pts (+0.86%) as of 8:30 am AEDT.
What goes up...🚀
It's not always the case in the stock market that the rest of that sentence is "must come down". Ideally, higher share prices are supported by higher earnings, and higher earnings expectations.
It's the earnings expectations that are suffering as a combination of simmering Trump trade war uncertainty and a surprise drop in a key Chinese economic data point combined to send investors packing from the ASX today.
Few sectors or stocks were spared as the sell off from Valentine's Day record high cracks a key technical support level and enters a dangerous new phase.
The sell off in major banking stocks like Macquarie Group (MQG) (-5.2%) and Commonwealth Bank (CBA) (-3.3%) continued, and only defensive stocks like supermarket operators Coles Group (+0.75%) and Woolworths (WOW) (+0.60%) were spared.
Click/scroll through for the usual reporting of the major sector and stock-specific moves, the broker responses to them, as well as all the key upcoming economic data in tonight's Evening Wrap.
Also, I have detailed technical analysis on the NASDAQ Composite and the S&P/ASX 200 in today's ChartWatch.
Let's dive in!
Today in Review
Fri 07 Mar 25, 5:03pm (AEST)
Name | Value | % Chg |
|---|---|---|
Major Indices | ||
| ASX 200 | 7,948.2 | -1.81% |
| All Ords | 8,178.5 | -1.78% |
| Small Ords | 3,055.5 | -1.26% |
| All Tech | 3,629.8 | -3.15% |
| Emerging Companies | 2,217.0 | -1.33% |
Currency | ||
| AUD/USD | 0.6302 | -0.48% |
US Futures | ||
| S&P 500 | 5,758.75 | +0.22% |
| Dow Jones | 42,657.0 | +0.10% |
| Nasdaq | 20,158.75 | +0.35% |
Name | Value | % Chg |
|---|---|---|
Sector | ||
| Consumer Staples | 11,517.1 | +0.35% |
| Materials | 16,269.1 | -0.92% |
| Utilities | 8,650.6 | -1.02% |
| Industrials | 7,853.0 | -1.16% |
| Health Care | 42,410.7 | -1.28% |
| Consumer Discretionary | 3,893.6 | -1.85% |
| Energy | 7,741.4 | -1.91% |
| Communication Services | 1,674.3 | -1.99% |
| Financials | 8,283.6 | -2.49% |
| Real Estate | 3,592.5 | -3.00% |
| Information Technology | 2,455.6 | -3.04% |
Markets

ASX 200 Session Chart
The S&P/ASX 200 (XJO) finished 146.5 points lower at 7,948.2, smack bang at its session low. In the broader-based S&P/ASX 300 (XKO), advancers lagged decliners by a comprehensive 51 to 234. For the week, the XJO finished down 224.2 points or 2.74% lower, 3.82% from its intraweek high and just 0.02% from its intraweek low.
There were few places to hide today in what you will see when you get to ChartWatch was an awful candle, capping what has been a most-sudden about-face from the 8616 record high that was set just 15 trading sessions ago.
I wouldn't say there were clear sector-themes today, more just a theme of best to worst. Real Estate Investment Trusts (XPJ) (-3.1%) was the hardest hit sector, but I wouldn't say this was due to the sector's usual driver – risk-free market yields – those were lower overnight which is usually a positive for the sector. Rather, it was more a case of previously high flying sector leaders like Goodman Group (GMG) (-4.8%) and HMC Capital (HMC) (-3.4%) getting their wings clipped.
Information Technology (XIJ) (-3.0%) and Financials (XFJ) (-2.5%) were next worst, as until recent market darlings Xero (XRO) (-3.5%) and Wisetech Global (-3.2%) were dumped, and respectively, the previously invincible but much maligned banks also tanked. Macquarie Group (MQG) (-5.2%) and Commonwealth Bank (CBA) (-3.3%) were hardest hit there.
Really the only place to hide was in supermarkets as Coles Group (+0.75%) and Woolworths (WOW) (+0.60%) notched commendable gains. I guess regardless of how poorly our super funds performed this week – we all still have to buy groceries!
Perhaps the generic Tim-Tams for a while, though...😭
ChartWatch
NASDAQ Composite Index

Time to ditch the BHP Technique 🧐 (click here for full size image)
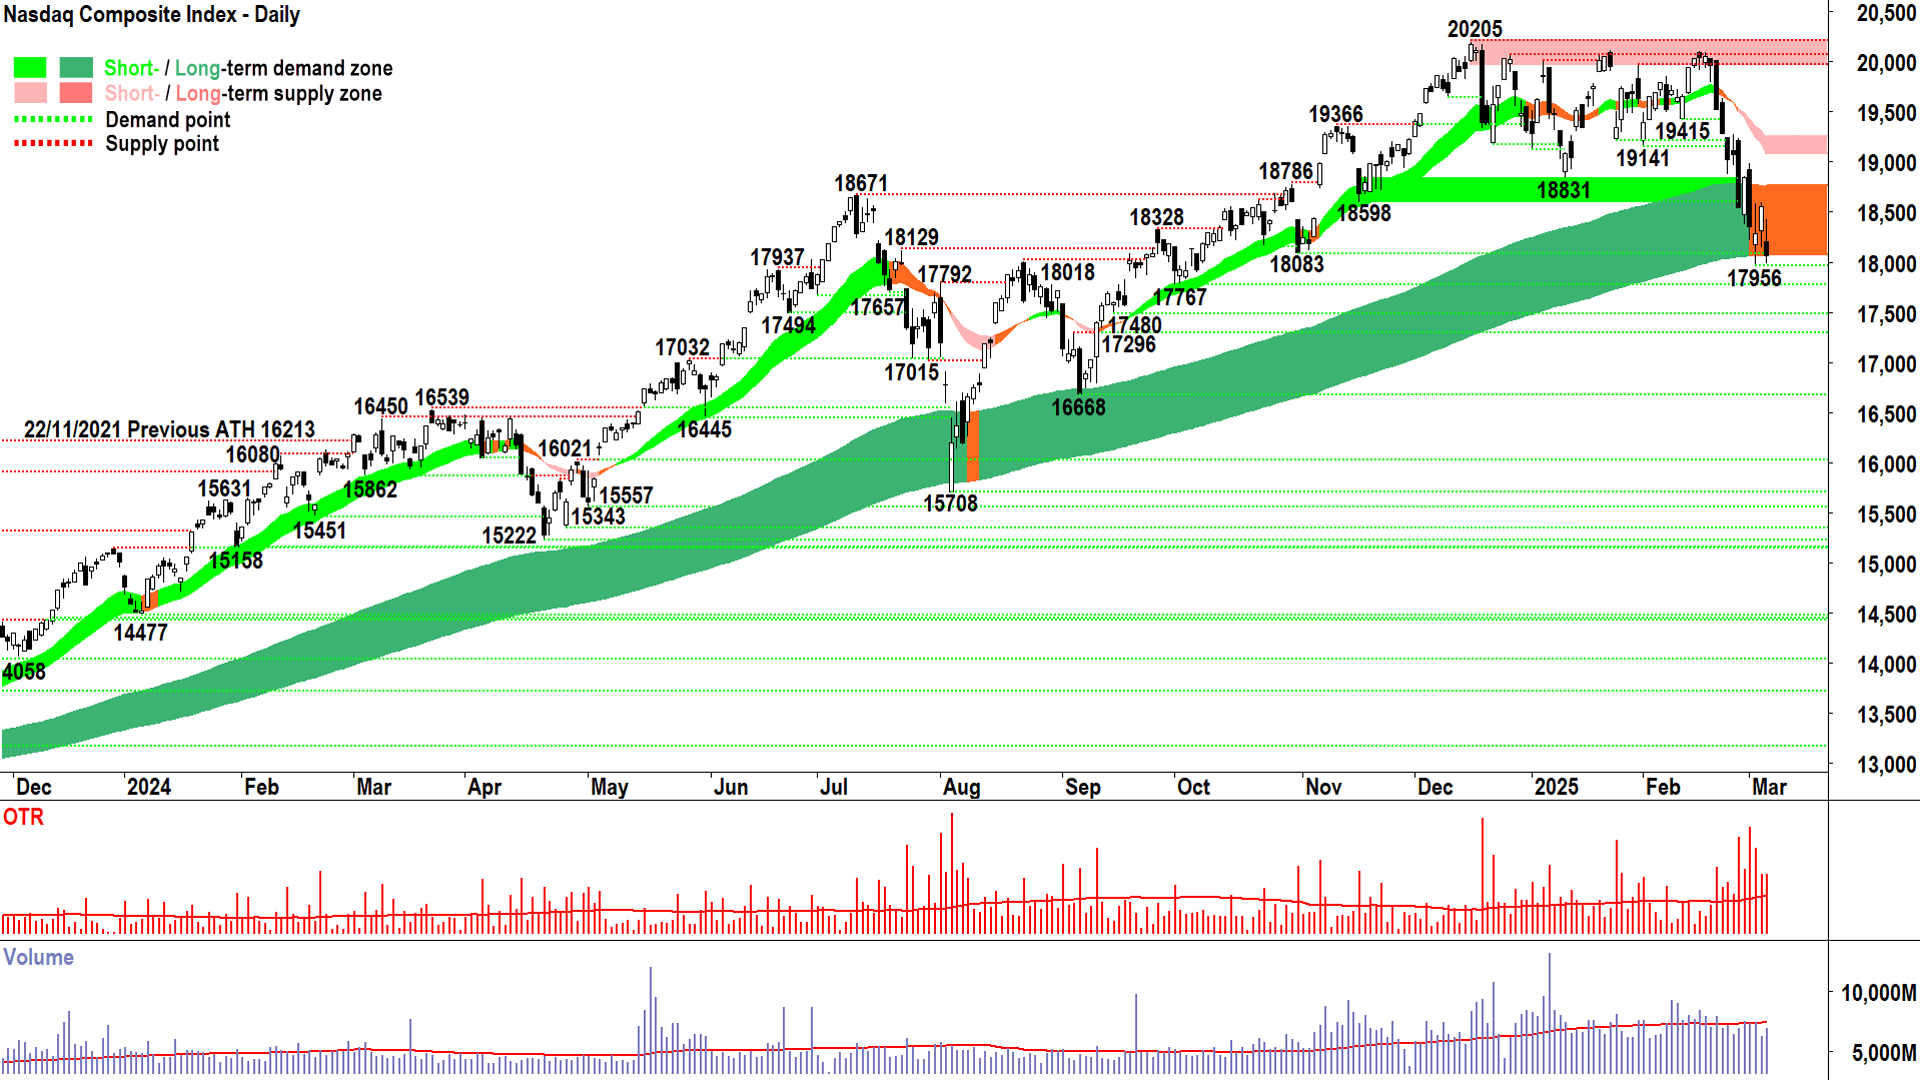
In yesterday’s update, we talked about the importance of “confirmation”. Thursday’s move goes a long way to giving us that.
It was a credible supply side showing with its long upward pointing shadow, black body, and low close (just off the session low). It nullifies the prior two promising demand-side candles, and therefore I propose confirms supply side is firmly in control of the price in the short term.
I also propose it tentatively confirms the long term trend ribbon (neutral) is beginning to act as a zone of dynamic supply – a trait associated with a bear market / transition to long term supply-side control.
I’m probably one more convincing supply-side candle away from calling the Comp bull market that started just off the left-hand side of the above chart in June 2023 is over.
“Convincing” would be long and black and closing very close to the session’s low. It also means closing below the long term trend ribbon – which last night’s candle very nearly did (👇)

The Comp’s Thursday close was a whisker away from closing below the long term trend ribbon.
If we do see a close below the long term trend ribbon, it will be the first since October 2023.
There are some static points of demand also lurking and they should not be discounted – we may well see the demand-side make strong showings at them yet. 🤞
Here, I would watch 17767 closely, with probably only minor demand likely at 17296-17480.
When I say something like “the bull market is over” this doesn’t mean I think we’re in a bear market. Markets rarely transition immediately from bull to bear. More often than not, and this makes perfect sense, they transition through a period of equilibrium first. That’s what I believe is occurring now.
We’re in equilibrium. It means pull one’s head in, have just a fraction of risk one typically runs in a strong trend…and wait for the new long term trend to exert itself.
As a trend follower who actively targets the short side – I really couldn’t care less which outcome occurs – bull or bear. Just that there is a clear outcome.
I note that when it comes to potential short-side opportunities, I have you covered. Each day I publish for you a comprehensive list of my favourite downtrends. They’ve been running hot for the last few weeks and have nailed some of the most catastrophic declines within the ASX over the at time.
I detail the options facing investors in the current market in the article I wrote today: The ASX 200 is tanking, what can you do about it?
I encourage all investors to seriously consider an approach more proactive than the default BHP Technique!
S&P/ASX 200 (XJO)
%20chart%207%20March%202025.png)
Total supply-side control ⚠️ (click here for full size image)
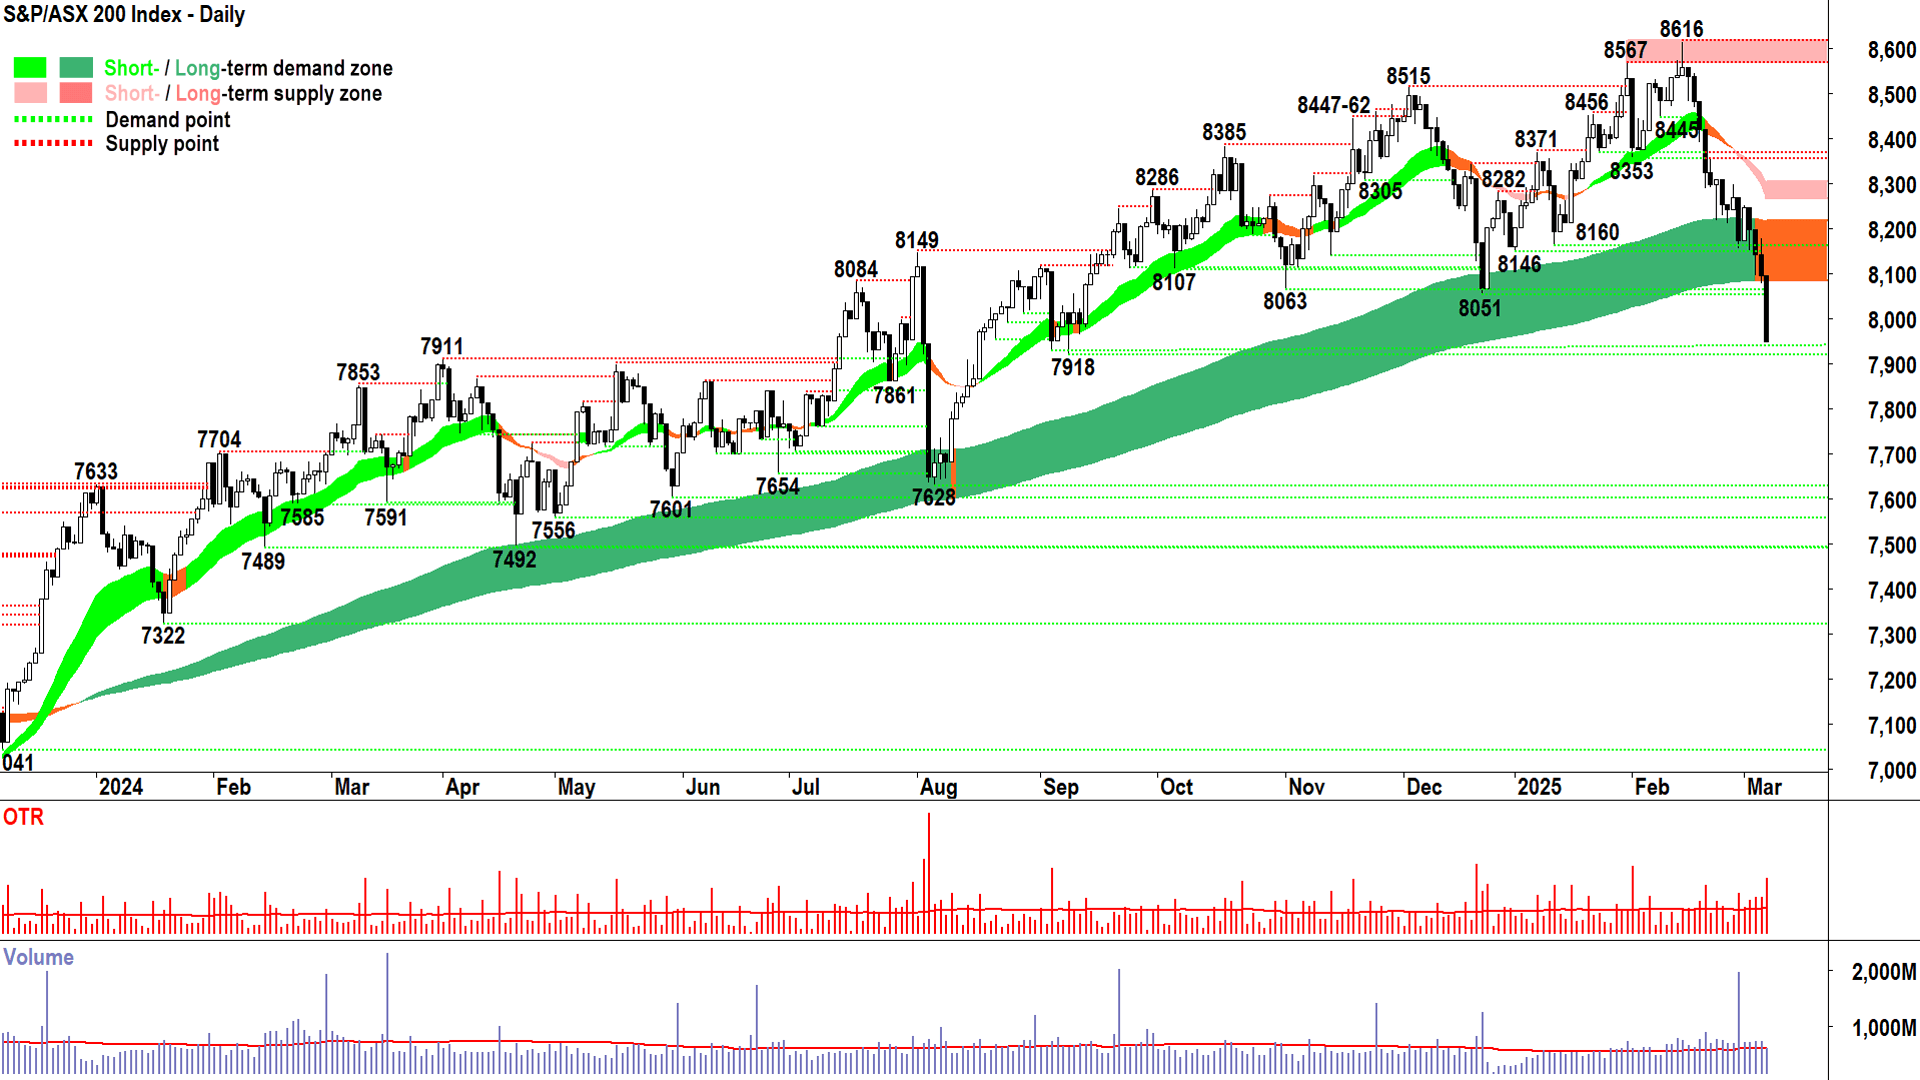
It happened much faster and with far less characteristic price action that usual – that’s the frustrating bit – but we have seen a transition in control in the XJO.
Today’s clear showing, long, black, and closing smack-bang at the session low confirms this. The bull market that has been in place on the XJO since late 2023 is over. We are in a different phase – what I call a NOT bull market phase.
This is because we now must see confirmation of whether we’ve moved into an equilibrium phase where prices are more likely to grind sideways around the long term trend ribbon, or whether that long term trend ribbon will begin to act as a zone of dynamic supply and along with continued supply-side price action (falling peaks and falling troughs), and a predominance of supply-side candles (i.e., black bodies and or upward pointing shadows), confirming therefore that we are in a long term supply-side market.
Otherwise more commonly known as a bear market.
7918 is a key static point of demand. If only because below it, it’s a long way down to the next clear point of demand at 7628. Oops. 😱
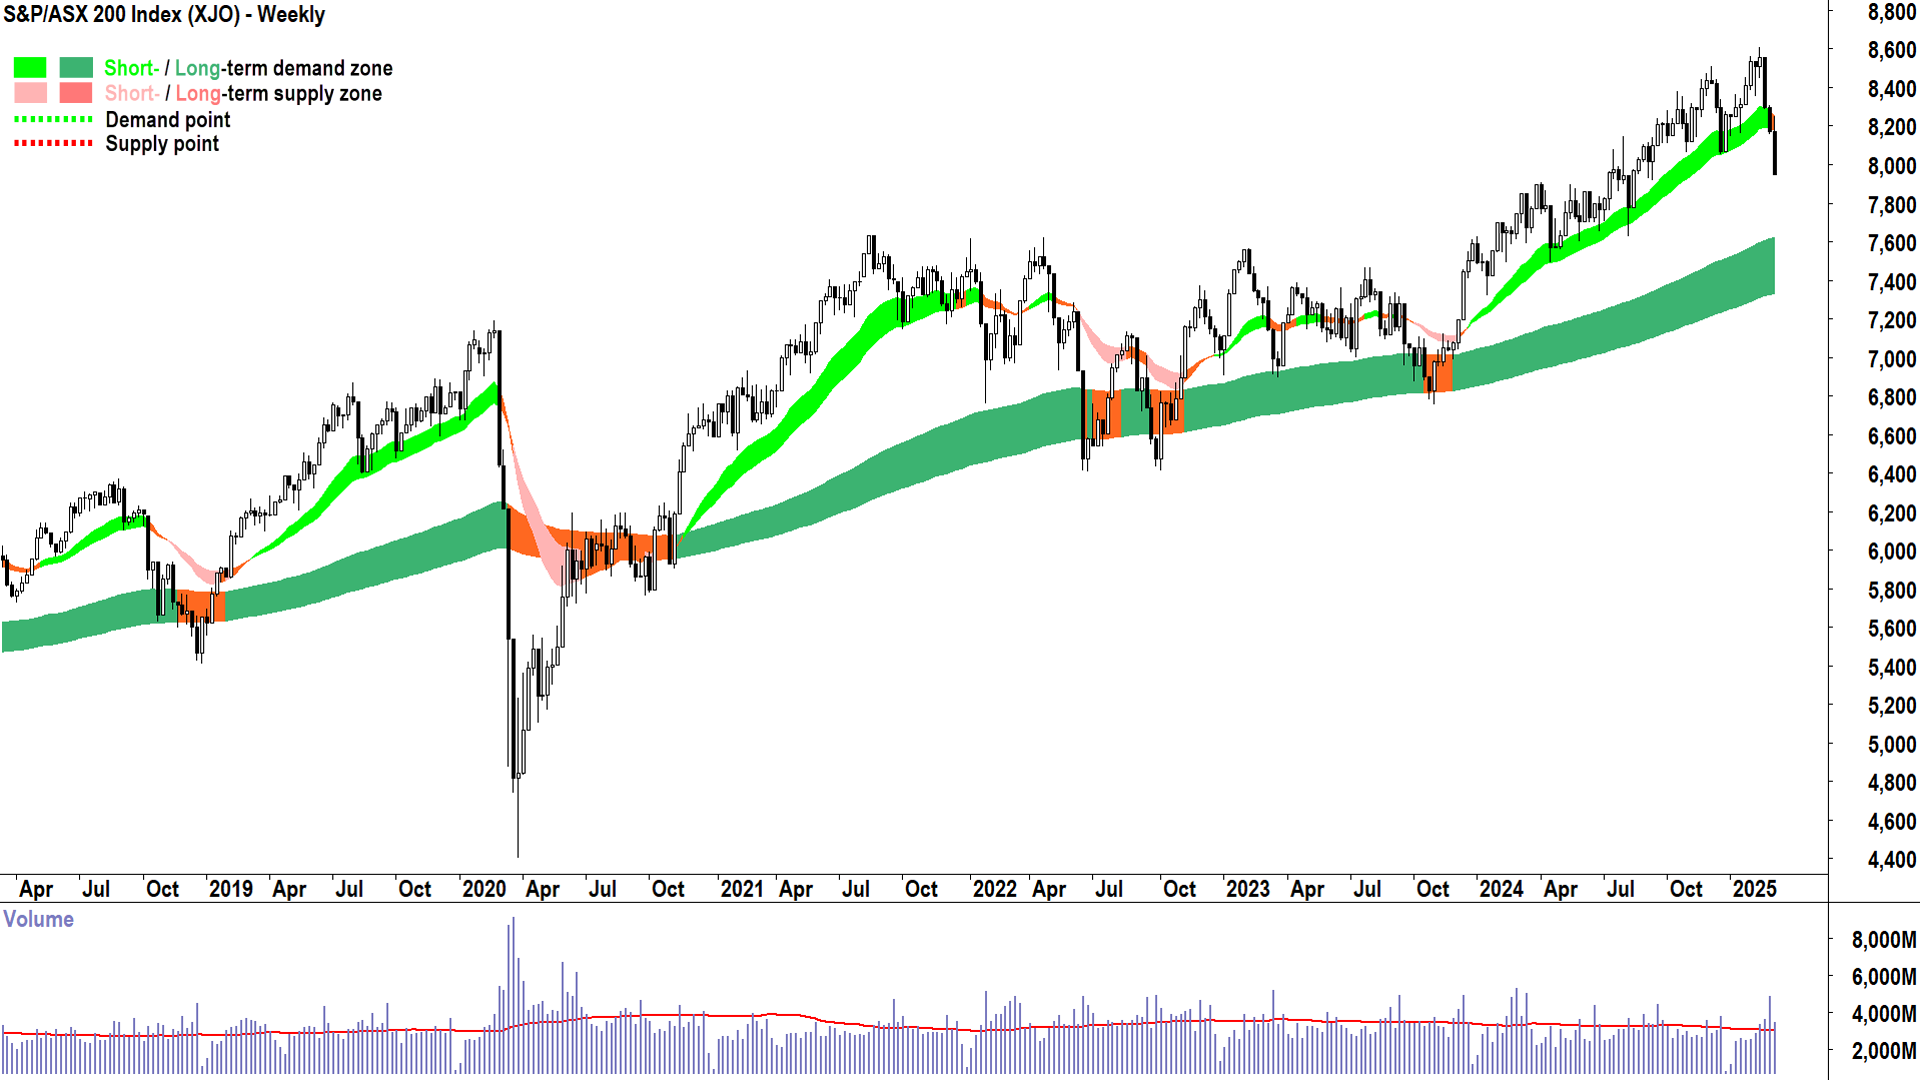
That level actually looks very interesting to me because it also coincides with the long term uptrend from the weekly chart which is presently tracking around 7335-7620.
%20weekly%20chart%207%20March%202025.png)
ASX 200 weekly chart and long term uptrend ribbon (click here for full size image)
The next candle is as always unknown. So whilst everything that has transpired over the last 15 trading sessions is consistent with substantial and persistent supply-side control, the next candle could be the beginning of the resumption of demand-side control.
We must, as always, simply watch the price action and candles, and adjust our risk accordingly. 👀
Economy
Today
CHN Trade Balance Jan-Feb y/y
-1.2% Jan-Feb y/y to RMB 6.54 trillion
Exports: +3.4% Jan-Feb y/y to RMB 3.88 trillion
Imports: -7.3% Jan-Feb y/y to RNB 2.66 trillion
All data points significantly below consensus estimates and demonstrates weak global demand (lower exports = slowest since April last year), and sharp decline in Chinese demand (big drop in imports)
Bearish data with respect to global economic growth, and likely exacerbated the sell-off today. Trump's tariffs are going to hit the global economy/Chinese economy at a time of already slowing growth.
Later this week
Saturday
00:30 USA Non-Farm Payroll Data February
Employment Change: +156,000 forecast vs +143,000 in January
Average Hourly Earnings: +0.3% m/m forecast vs +0.5% m/m in January
Unemployment Rate: 4.0% forecast vs 4.0% in January
Latest News
Interesting Movers
Trading higher
+9.9% Insignia Financial (IFL) - IFL receives revised indicative non-binding proposals, rise is consistent with prevailing short and long term uptrends, a regular in ChartWatch ASX Scans Uptrends list 🔎📈
+5.4% Global X Ultra Short Nasdaq-100 Hedge Fund ETF (SNAS) - Short-index ETF!
+5.4% Droneshield (DRO) - No news, credit where credit is due…rise is consistent with prevailing short term uptrend and rising peaks and rising troughs.
+4.7% West African Resources (WAF) - Continued positive response to 06-Feb WAF Delivers $246 Million NPAT for 2024, rise is consistent with prevailing short and long term uptrends, a regular in ChartWatch ASX Scans Uptrends list 🔎📈
+4.1% BetaShares Australian Strong Bear ETF (BBOZ) - Short-index ETF!
+3.6% Vulcan Energy Resources (VUL) - No news since 05-Feb Response to ASX Price Query, bounced in the wake of yesterday's sharp selloff.
+3.3% BetaShares US EQY Strong Bear ETF (BBUS) - Short-index ETF!
+3.0% Develop Global (DVP) - No news 🤔.
+2.9% Adriatic Metals (ADT) - No news, rise is consistent with prevailing short and long term uptrends, a regular in ChartWatch ASX Scans Uptrends list 🔎📈
Trading lower
-13.0% Polynovo (PNV) - Response to article in 'Margin Call', fall is consistent with prevailing short and long term downtrends, a regular in ChartWatch ASX Scans Downtrends list 🔎📉
-10.0% Predictive Discovery (PDI) - No news since 06-Mar Half Year Accounts, general weakness across the broader Gold sector today.
-9.9% Larvotto Resources (LRV) - No news, general weakness across the broader Gold sector today.
-6.9% BetaShares Crypto Innovators ETF (CRYP) - Most major cryptos down overnight on general risk-off market mood.
-6.7% Audinate Group (AD8) - No news, fall is consistent with prevailing short and long term downtrends, a regular in ChartWatch ASX Scans Downtrends list 🔎📉
-5.7% Capricorn Metals (CMM) - No news since 06-Mar Half Yearly Report and Accounts, downgraded to overweight from buy at Jarden.
-5.6% REA Group (REA) - No news, just a terrible day! 🤔
-5.4% Clarity Pharmaceuticals (CU6) - No news, fall is consistent with prevailing short and long term downtrends, a regular in ChartWatch ASX Scans Downtrends list 🔎📉
-5.2% Nextdc (NXT) - No news, fall is consistent with prevailing short and long term downtrends, a regular in ChartWatch ASX Scans Downtrends list 🔎📉
-5.2% Macquarie Group (MQG) - No news, general weakness across the broader Financials sector today.
-5.0% Mesoblast (MSB) - No news since 06-Mar Mesoblast Added to S&P ASX200 Index.
-5.0% Boss Energy (BOE) - N, general weakness across the broader Uranium sector today, fall is consistent with prevailing short and long term downtrends, a regular in ChartWatch ASX Scans Downtrends list 🔎📉
-4.8% Metals Acquisition (MAC) - No news, fall is consistent with prevailing short and long term downtrends, a regular in ChartWatch ASX Scans Downtrends list 🔎📉
-4.8% Goodman Group (GMG) - No news, fall is consistent with prevailing short and long term downtrends, a regular in ChartWatch ASX Scans Downtrends list 🔎📉
-4.7% Zip Co. (ZIP) - No news, fall is consistent with prevailing short and long term downtrends, a recent regular in ChartWatch ASX Scans Downtrends list 🔎📉
-4.0% Bannerman Energy (BMN) - No news since 06-Mar Half Yearly Report and Accounts, general weakness across the broader Uranium sector today, fall is consistent with prevailing short and long term downtrends, a regular in ChartWatch ASX Scans Downtrends list 🔎📉
-4.0% Paladin Energy (PDN) - No news, general weakness across the broader Uranium sector today, fall is consistent with prevailing short and long term downtrends, a regular in ChartWatch ASX Scans Downtrends list 🔎📉
Broker Moves
ALS (ALQ)
Retained at buy at Bell Potter; Price Target: $18.00 from $17.30
ASX (ASX)
Retained at sell at UBS; Price Target: $66.00
Bendigo and Adelaide Bank (BEN)
Upgraded to neutral from sell at UBS; Price Target: $37.50
BHP Group (BHP)
Retained at overweight at Morgan Stanley; Price Target: $48.50
Bannerman Energy (BMN)
Retained at buy at Canaccord Genuity; Price Target: $4.08 from $4.17
Boss Energy (BOE)
Retained at buy at Canaccord Genuity; Price Target: $5.35 from $5.65
Car Group (CAR)
Retained at buy at Citi; Price Target: $43.40
Charter Hall Group (CHC)
Downgraded to neutral from overweight at JP Morgan; Price Target: $18.50
Capricorn Metals (CMM)
Retained at buy at Canaccord Genuity; Price Target: $8.85
Downgraded to overweight from buy at Jarden; Price Target: $8.14 from $7.99
Retained at underperform at Macquarie; Price Target: $7.30
Dexus (DXS)
Retained at neutral at Citi; Price Target: $7.80
Generation Development Group (GDG)
Retained at overweight at Morgan Stanley; Price Target: $6.30
Graincorp (GNC)
Retained at outperform at RBC Capital Markets; Price Target: $9.75
Growthpoint Properties Australia (GOZ)
Retained at buy at Citi; Price Target: $2.60
Harvey Norman (HVN)
Upgraded to buy from hold at Jefferies; Price Target: $5.85 from $4.75
Image Resources (IMA)
Initiated at outperform at Macquarie; Price Target: $0.140
Incitec Pivot (IPL)
Retained at outperform at RBC Capital Markets; Price Target: $3.90
National Australia Bank (NAB)
Upgraded to neutral from sell at UBS; Price Target: $11.00
Neuren Pharmaceuticals (NEU)
Retained at buy at Ord Minnett; Price Target: $29.30
National Storage Reit (NSR)
Retained at buy at Citi; Price Target: $2.70
Nufarm (NUF)
Retained at sector perform at RBC Capital Markets; Price Target: $5.00
Orica (ORI)
Retained at overweight at Morgan Stanley; Price Target: $22.50
Retained at outperform at RBC Capital Markets; Price Target: $23.00
Perpetual (PPT)
Retained at neutral at Macquarie; Price Target: $19.74 from $21.05
Region Group (RGN)
Retained at buy at Citi; Price Target: $2.40
Rio Tinto (RIO)
Retained at neutral at Citi; Price Target: $130.00
Retained at overweight at Morgan Stanley; Price Target: $130.50
Retained at buy at Ord Minnett; Price Target: $132.00
Stockland (SGP)
Retained at buy at Citi; Price Target: $5.80
Titan Mineral (TTM)
Retained at buy at Canaccord Genuity; Price Target: $1.100
Tyro Payments (TYR)
Downgraded to neutral from overweight at Macquarie; Price Target: $0.820 from $1.400
Viva Energy Group (VEA)
Downgraded to hold from buy at Jefferies; Price Target: $1.900 from $3.30
West African Resources (WAF)
Retained at buy at Canaccord Genuity; Price Target: $3.95
Retained at outperform at Macquarie; Price Target: $2.30 from $2.20
Westpac Banking Corporation (WBC)
Retained at underweight at Morgan Stanley; Price Target: $29.20
Xero (XRO)
Retained at hold at Ord Minnett; Price Target: $180.00
Scans
Top Gainers
Code | Company | Last | % Chg |
|---|---|---|---|
| IRX | Inhalerx Ltd | $0.038 | +40.74% |
| EGN | Engenco Ltd | $0.29 | +38.10% |
| NUC | Nuchev Ltd | $0.20 | +37.93% |
| GES | Genesis Resources Ltd | $0.012 | +33.33% |
| TOU | Tlou Energy Ltd | $0.016 | +33.33% |
Top Fallers
Code | Company | Last | % Chg |
|---|---|---|---|
| RWL | Rubicon Water Ltd | $0.225 | -19.64% |
| EMN | Euro Manganese Inc | $0.038 | -17.39% |
| ARI | Arika Resources Ltd | $0.024 | -17.24% |
| BTC | BTC Health Ltd | $0.055 | -16.67% |
| CMO | Cosmo Metals Ltd | $0.015 | -16.67% |
52 Week Highs
Code | Company | Last | % Chg |
|---|---|---|---|
| EGN | Engenco Ltd | $0.29 | +38.10% |
| GES | Genesis Resources Ltd | $0.012 | +33.33% |
| IFL | Insignia Financial Ltd | $4.68 | +9.86% |
| WAF | West African Resources Ltd | $2.21 | +4.74% |
| LFSPA | Latitude Group Holdings Ltd | $99.98 | +2.48% |
52 Week Lows
Code | Company | Last | % Chg |
|---|---|---|---|
| LOM | Lucapa Diamond Company Ltd | $0.015 | -16.67% |
| GR8 | Great Dirt Resources Ltd | $0.12 | -14.29% |
| FG1 | FLYNN Gold Ltd | $0.02 | -13.04% |
| PNV | Polynovo Ltd | $1.20 | -13.04% |
| BPM | BPM Minerals Ltd | $0.039 | -11.36% |
Near Highs
Code | Company | Last | % Chg |
|---|---|---|---|
| GLDN | Ishares Physical Gold ETF | $36.74 | +0.52% |
| MTO | Motorcycle Holdings Ltd | $2.01 | +1.01% |
| JEPI | Jpmorgan EQ Prem Income Active ETF (Managed Fund) | $55.55 | -0.29% |
| GXLD | Global X Gold Bullion ETF | $46.07 | +0.17% |
| ASIA | Betashares Asia Technology Tigers ETF | $11.52 | +1.05% |
Relative Strength Index (RSI) Oversold
Code | Company | Last | % Chg |
|---|---|---|---|
| GMG | Goodman Group | $30.53 | -4.77% |
| PGC | Paragon Care Ltd | $0.42 | -8.70% |
| FLT | Flight Centre Travel Group Ltd | $15.10 | +0.53% |
| BRN | Brainchip Holdings Ltd | $0.205 | -2.38% |
| WHF | Whitefield Industrials Ltd | $5.20 | -2.26% |
