News | Market Wraps
Evening Wrap: ASX 200 slides on dividend bonanza, as BHP, Rio Tinto, Woodside Energy payouts weigh
The S&P/ASX 200 closed 46.4 points lower, down 0.57%.

Mentioned
The S&P/ASX 200 closed 46.4 points lower, down 0.57%.
The performance of gold stocks helped sneak the broader Materials (XMJ) (+0.18%), sector to a gain, but to be fair, a solid rebound in base metals and iron ore stocks helped offset ex-dividend losses from BHP Group (BHP) (-0.78%) and Rio Tinto (RIO) (-2.2%).
Gains in aluminium, copper (strong gain – see tonight’s ChartWatch below for technical analysis), lead, and zinc helped the likes of South32 (S32) (+3.7%) and Sandfire Resources (SFR) (+4.8%) to sector-leading performances.
Click/scroll through for the usual reporting of the major sector and stock-specific moves, the broker responses to them, as well as all the key upcoming economic data in tonight's Evening Wrap.
Also, I have detailed technical analysis on the NASDAQ Composite, Brent Crude Oil, and Copper in today's ChartWatch.
Let's dive in!
Today in Review
Thu 06 Mar 25, 5:01pm (AEST)
Name | Value | % Chg |
|---|---|---|
Major Indices | ||
| ASX 200 | 8,094.7 | -0.57% |
| All Ords | 8,326.4 | -0.44% |
| Small Ords | 3,094.4 | +0.50% |
| All Tech | 3,747.7 | +0.46% |
| Emerging Companies | 2,246.0 | +0.92% |
Currency | ||
| AUD/USD | 0.6335 | +0.00% |
US Futures | ||
| S&P 500 | 5,844.0 | -0.12% |
| Dow Jones | 43,047.0 | -0.04% |
| Nasdaq | 20,610.75 | -0.26% |
Name | Value | % Chg |
|---|---|---|
Sector | ||
| Materials | 16,420.7 | +0.18% |
| Communication Services | 1,708.3 | +0.14% |
| Information Technology | 2,532.5 | +0.10% |
| Real Estate | 3,703.7 | +0.02% |
| Consumer Staples | 11,477.1 | -0.29% |
| Health Care | 42,961.4 | -0.46% |
| Industrials | 7,945.2 | -0.61% |
| Financials | 8,495.3 | -0.86% |
| Consumer Discretionary | 3,966.8 | -1.12% |
| Utilities | 8,740.0 | -2.07% |
| Energy | 7,891.9 | -2.87% |
Markets

ASX 200 Session Chart
The S&P/ASX 200 (XJO) finished 46.4 points lower at 8,094.7, 1.05% from its session high and just 0.23% from its high/low. In the broader-based S&P/ASX 300 (XKO), advancers beat decliners by 149 to 123.
It looked like yet another down day today, but it probably didn’t feel so bad when you logged into check your portfolio today.
That’s because today’s 46-point fall belies the fact that over 40 stocks went ex-dividend today, paying out tens of millions of dollars to shareholders. The passing of ownership of a company’s cash to its shareholders via a dividend must be reflected at least to some extent in a lower stock price / market capitalisation.
This inevitably translates into ASX 200 index points...and don’t forget about franking credits.
So, it looked far worse than it actually was today, and the market breadth (149⬆️ vs 123⬇️) probably tells a better story of the underlying strength across the ASX today – albeit only still very modest!
For what its worth (because nearly all sectors were impacted by dividends), the Gold (XGD) sub-index (+2.7%) was the clear standout performer today – good news for those who have chosen to follow that trend – as West African Resources (ASX: WAF) (+12.0%) popped after delivering its full year results.
The performance of gold stocks helped sneak the broader Materials (XMJ) (+0.18%), sector to a gain, but to be fair, a solid rebound in base metals and iron ore stocks helped offset ex-dividend losses from BHP Group (ASX: BHP) (-0.78%) and Rio Tinto (ASX: RIO) (-2.2%).
Gains in aluminium, copper (strong gain – see tonight’s ChartWatch below for technical analysis), lead, and zinc helped the likes of South32 (ASX: S32) (+3.7%) and Sandfire Resources (ASX: SFR) (+4.8%) to sector-leading performances. Also consider that S32 went ex-dividend $0.054 fully franked – so it actually did substantially better than its +3.7% today.
Taking the bus to Struggletown, and first stop was surprise, surprise, Energy (XEJ) (-2.9%). It wasn’t all “lower commodity prices overnight” stuff though, as much of the loss was due to sector heavyweight Woodside Energy (ASX: WDS) (-4.7%) going ex-dividend.
The XEJ’s cousin, Utilities (XUJ) (-2.1%) was next-worst – but this loss was also largely sector heavyweight specific – as AGL Energy (ASX: AGL) (-4.1%) sold off after a rating downgrade to equal-weight from overweight by Morgan Stanley (see Broker Moves for more details).
ChartWatch
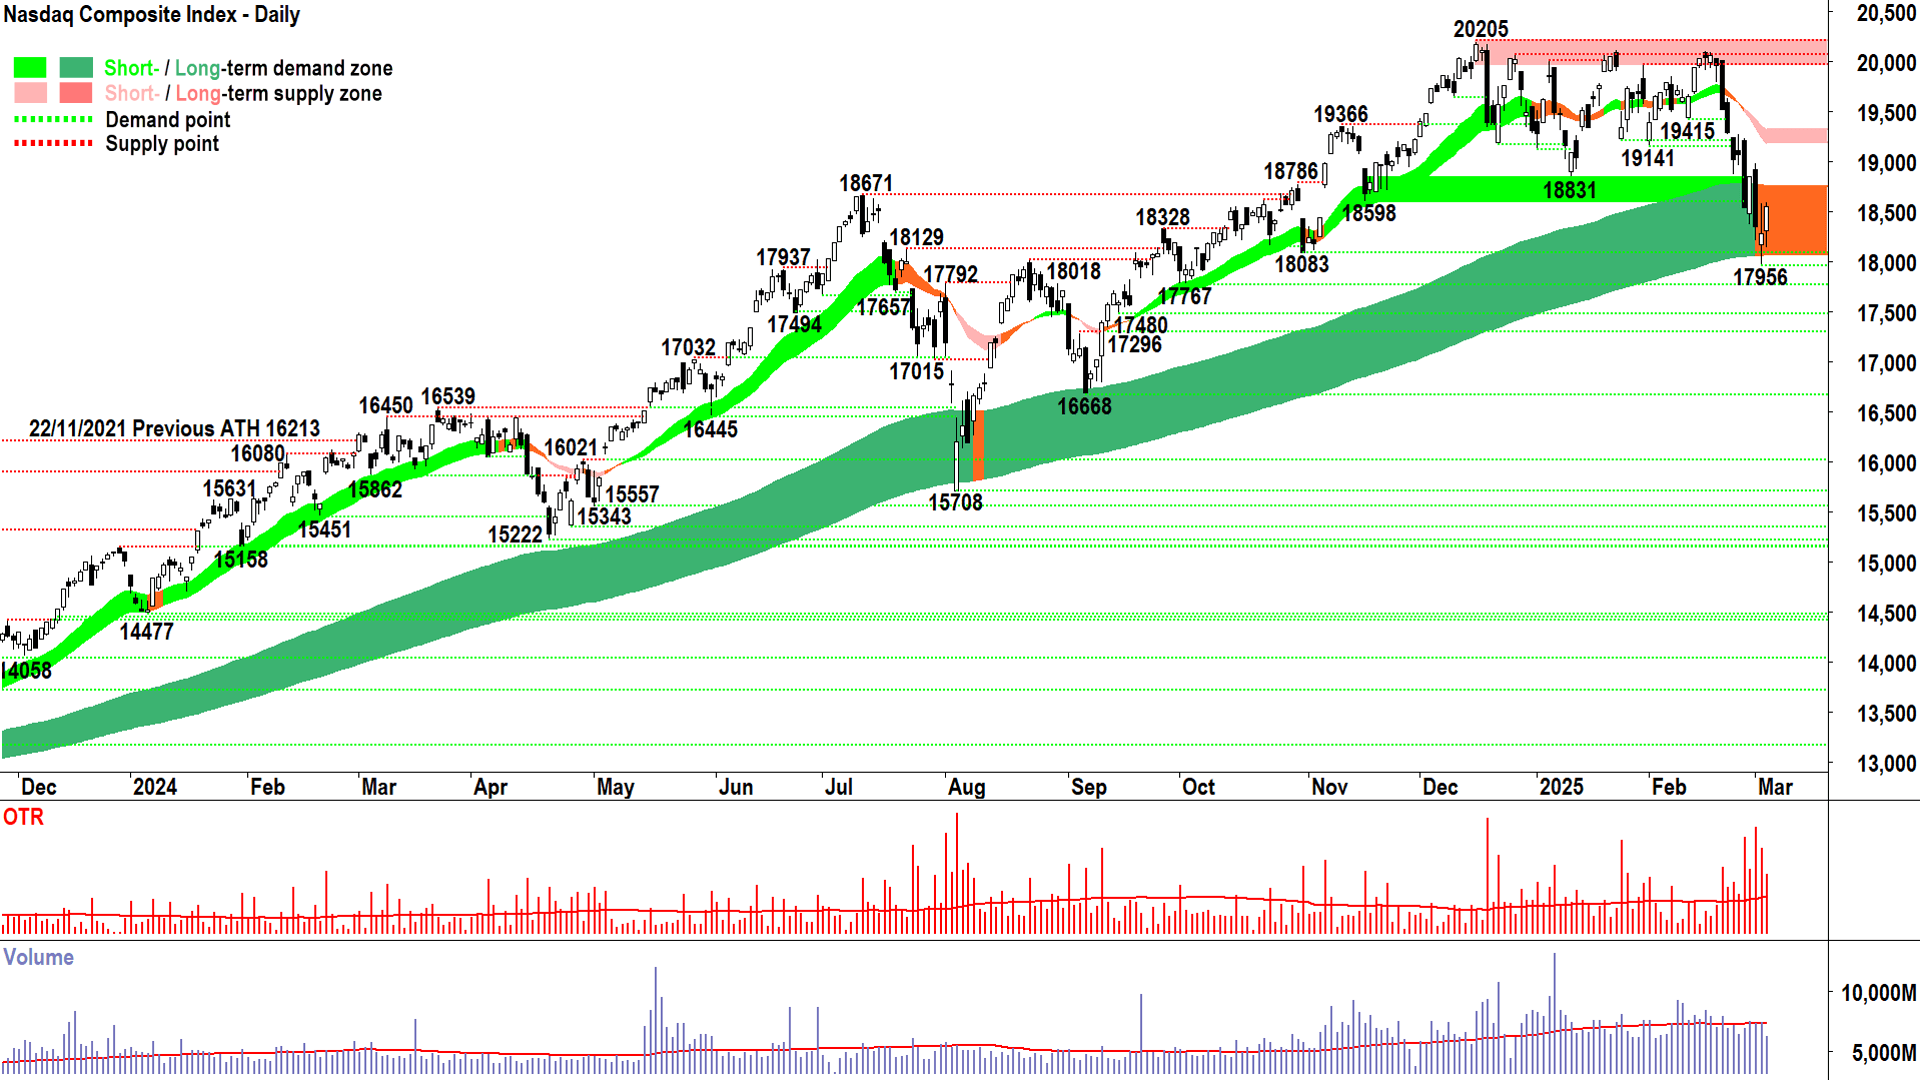
NASDAQ Composite Index

Is that the start of the rebound? 🤔 (click here for full size image)
We’ve been covering this daily for the last week as the Comp has plunged towards the long term trend ribbon. Last night's interesting and important candle earns it another look. 👀
Like it did during August-24’s test, the price action on the Comp tipped just below the long term trend ribbon before bouncing tentatively Tuesday, and far more confidently last night.
That last, Wednesday candle with its white body and downward pointing shadow, is a bona fide demand-side candle. The fact that it also took out the previous session’s high (in addition to its corresponding higher low) sets 17956 as a point of demand.
Given 17956's position in relation to the long term trend ribbon – it means the bulls unequivocally do not want to see the Comp close below it – ever!
The supply-side is no doubt still lurking and assessing their options, but it does appear from the last candle the demand-side sees some value in the market and is therefore happy to put some capital back to work.
Great. But entire last drive lower in prices is largely irrelevant going forward.
What matters from here is confirmation.
Either:
Confirmation that the demand-side remains in control of long term price action, and the bull market is intact.
Or:
Confirmation that the supply-side has grappled control of long term price action, and the bull market is history.
In the first case, we must see:
A return to rising peaks and rising troughs (i.e., demand reinforcement and supply removal)
Closing above short and long term trend ribbons and those trend ribbons acting as areas of dynamic demand
A predominance of demand-side candles (i.e., white bodies and or downward pointing shadows).
In the second case, we must see:
A continuation of falling peaks and falling troughs (i.e., supply reinforcement and demand removal)
Closing below short and long term trend ribbons and those trend ribbons acting as areas of dynamic supply
A predominance of supply-side candles (i.e., black bodies and or upward pointing shadows).
In the first case:
✅ Back in the bull. Hooray for longs!
In the second case:
❌ Not in the bull. Either an equilibrium market where price action moves sideways for an extended period of time, or a bear market, where…well – you know what! 📉
It’s crunch time. The price action and candles over the next few days and potentially up to weeks will define the path of least resistance for the next few months and possibly beyond. Stay alert, not alarmed! Let the price action and candles guide you! 🧐
Brent Crude Oil Futures (Front month, back-adjusted) ICE
%20ICE%20chart%2007%20March%202025.png)
Investors over a barrel with respect to the crude oil price 🛢️ (click here for full size image)
We’ve been tracking the demise of the ASX Energy sector for some time in Evening Wraps, and via ChartWatch ASX Scans with respect to individual stocks.
Stocks like Woodside Energy Group (ASX: WDS), Santos (ASX: STO), Whitehaven Coal (ASX: WHC), New Hope Corporation (ASX: NHC), Coronado Global Resources (ASX: CRN), Stanmore Resources (ASX: SMR), Boss Energy (ASX: BOE), Paladin Energy (ASX: PDN), Ampol (ASX: ALD), and Viva Energy Group (ASX: VEA) have each regularly featured in my Downtrends lists. 📉
Followers of that list know you prefer not to see the stocks you own in it.
I am not a prognosticator, I am a trend follower, so the appearance of any stock in my uptrends or downtrends lists is neither an endorsement or a death sentence – but history demonstrates the trends I identify often continue.
One of the reasons for the XEJ’s struggles is the chart above of Brent Crude – but we’ve also covered here in ChartWatch cascading downtrends in the charts of metallurgical and thermal coal, and uranium. That’s a decent chunk of change when it comes to what the sector is best at doing.
More broadly, however, as we have noted in the past, Brent is largely rangebound between 63.06-85.04. This latest drive has placed it closer to the bottom end of that range than the top, but I also note the prevalence of a likely solid zone of demand at 67.31-68.03.
Last night’s downward pointing shadow (second from last candle as last candle is live – so discount it) suggests there is indeed some degree of excess demand down here.
As noted in the Comp analysis above, a big/fast move is interesting – sure – but confirmation is now the key. Can the demand-side confirm their tentative return commenced in yesterday’s candle with a white-bodied showing, or at the very least another downward pointing shadow (preferably a long one).
If this is the case, then a rebound towards 73.75 is possible, with some resistance likely around the last trough at 71.92.
If this is not the case, and we see continued supply-side candles, then 67.31-68.03 is likely to be more meaningfully probed. If that area goes, then we’ll likely set up a date with 65.39. There’s no point looking any further out than that. 🤔
High Grade Copper Futures (Front month, back-adjusted) COMEX
%20COMEX%20chart%2007%20March%202025.png)
Nothing to see here...just another false start! 🚫 (I'm using reverse psychology! 🧠) (click here for full size image)
Time for some good news! Copper appears to be doing another “Hey look at me, I’m the next big thing!” move. 🤦
We’ve fallen for these in the past in ChartWatch, only to be disappointed. Does last night’s massive white candle mean this latest move has legs? (Again, discount that tiny last candle – it’s today’s live session)
For what it’s worth, I think so. That’s a nice showing from the demand-side, and it came at the perfect time and price – bouncing off the dynamic demand of the short term uptrend ribbon as well as the static 4.4355-4.5165 zone.
Of course, there’s once again the issue of 4.8775-4.9060. If last night’s demand-side price action continues, we’ll be setting up for the fourth serious test of this critical supply zone.
I like to think of each next test of a supply zone as weakening it somewhat. Usually (big usually here…) the probability of breaking through increases with each next attempt.
Again – not a prognosticator – so I don’t want to get too far ahead of myself…but let’s see how the next few candles fall. Demand-side candles right up to, or even into a supply zone, are a great indication that it’s no longer that.
Conversely, if we see the black ones, or the ones with upward pointing shadows probing the zone but ultimately demonstrating the demand-side could not hold in there – the probability of another failure increases substantially.
I think I’ve circled all the way back to: Let the price action and candles guide you! 🦮
Economy
Today
AUS Building Approvals January
+6.3% m/m actual vs -0.1% m/m forecast and +0.7% m/m in December
+14% p.a. growth driven by units (+13% m/m and whopping +41% p.a.!)
Building industry is a big employer, and building houses stimulates demand for both raw materials and household goods – so today's data is a strong sign of current economic growth – but also of likely strong growth to come
The data will weight on the RBA's next interest rate cut decision
Later this week
Friday
00:15 EUR European Central Bank (ECB) Main Refinancing Rate & Statement (2.65% forecast vs 2.9% present)
00:45 EUR ECB Press Conference
Saturday
00:30 USA Non-Farm Payroll Data February
Employment Change: +156,000 forecast vs +143,000 in January
Average Hourly Earnings: +0.3% m/m forecast vs +0.5% m/m in January
Unemployment Rate: 4.0% forecast vs 4.0% in January
Latest News
Interesting Movers
Trading higher
+12.5% EBR Systems (EBR) - No news, rise is consistent with prevailing long term uptrend 🔎📈
+11.9% West African Resources (WAF) - WAF Delivers $246 Million NPAT for 2024, general strength across the broader Gold sector today, rise is consistent with prevailing short and long term uptrends, a regular in ChartWatch ASX Scans Uptrends list 🔎📈
+7.8% Johns Lyng Group (JLG) - No news, possibly due to the substantially better than expected building approvals data…but grasping at straws here! 🤔
+7.6% Resolute Mining (RSG) - No news, general strength across the broader Gold sector today.
+7.3% Bellevue Gold (BGL) - No news, general strength across the broader Gold sector today.
+7.2% Orthocell (OCC) - No news, bounced in the wake of the recent sharp selloff.
+6.7% Catapult Group International (CAT) - No news, rise is consistent with prevailing short and long term uptrends 🔎📈
+6.7% Radiopharm Theranostics (RAD) - No news 🤔.
+6.6% Duxton Water (D2O) - D2O Executes $121.3M Sale of Water Entitlements.
+5.5% WA1 Resources (WA1) - No news, today's move is consistent with recent volatility.
+5.3% Myer (MYR) - No news, initiated at overweight at Morgan Stanley with a price target of $1.10.
+5.1% Firefly Metals (FFM) - No news, general strength across the broader Copper sector today.
+5.0% Droneshield (DRO) - No news 🤔.
+5.0% Capstone Copper Corp. (CSC) - No news, general strength across the broader Copper sector today.
+4.8% Sandfire Resources (SFR) - Becoming a substantial holder (Principal Global Investors), general strength across the broader Copper sector today, rise is consistent with prevailing short and long term uptrends, a regular in ChartWatch ASX Scans Uptrends list 🔎📈
+4.7% Integral Diagnostics (IDX) - Change in Director's Interest Notice - Dr Ian Kadish and Change in Director's Interest Notice - Toby Hall (2 x on market purchases 💰💰), upgraded to buy from neutral at Citi.
+4.6% Cochlear (COH) - No news, upgraded to buy from neutral at Citi and price target raised to $300.00 from $290.00.
Trading lower
-11.5% Vulcan Energy Resources (VUL) - Response to ASX Price Query, fall is consistent with prevailing short term downtrend and long term trend is transitioning from up to down, a regular in ChartWatch ASX Scans Downtrends list 🔎📉
-9.4% Appen (APX) - No news, fall is consistent with prevailing short term downtrend and long term trend is transitioning from up to down, a recent regular in ChartWatch ASX Scans Downtrends list 🔎📉
-8.3% Mesoblast (MSB) - Mesoblast Added to S&P ASX200 Index (hello short sellers! 👋), fall is consistent with prevailing short term downtrend and falling peaks and falling troughs 🔎📉
-7.5% Clinuvel Pharmaceuticals (CUV) - No news since 04-Mar CLINUVEL Unveils Vitiligo Program for AAD 2025, repelled perfectly from long term downtrend ribbon! 🔎📉
-5.7% Novonix (NVX) - No news, fall is consistent with prevailing short and long term downtrends, a regular in ChartWatch ASX Scans Downtrends list 🔎📉
-4.7% Woodside Energy Group (WDS) - No news, ex-div $0.831 fully franked.
-4.7% Opthea (OPT) - Continued negative response to 03-Mar Opthea Announces Phase 2b Wet AMD Publication, fall is consistent with prevailing short term downtrend and falling peaks and falling troughs 🔎📉
-4.1% Smartgroup Corporation (SIQ) - No news, ex-div $0.31 fully franked.
-4.1% AGL Energy (AGL) - No news, general weakness across the broader Utilities/Energy sectors today, downgraded to equal-weight from overweight at Morgan Stanley and price target cut to $11.88 from $12.66.
Broker Moves
29METALS (29M)
Retained at hold at Ord Minnett; Price Target: $0.320
The A2 Milk Company (A2M)
Retained at hold at Bell Potter; Price Target: $7.25
Alpha HPA (A4N)
Retained at buy at Bell Potter; Price Target: $2.00
Australian Agricultural Company (AAC)
Retained at buy at Bell Potter; Price Target: $1.950
AGL Energy (AGL)
Downgraded to equal-weight from overweight at Morgan Stanley; Price Target: $11.88 from $12.66
ARB Corporation (ARB)
Downgraded to neutral from buy at Citi; Price Target: $39.54 from $51.20
Retained at buy at Ord Minnett; Price Target: $45.00
Bega Cheese (BGA)
Retained at buy at Bell Potter; Price Target: $7.00
Bellevue Gold (BGL)
Retained at hold at Ord Minnett; Price Target: $1.350 from $1.200
BHP Group (BHP)
Retained at accumulate at Ord Minnett; Price Target: $43.00
Boss Energy (BOE)
Initiated at positive at E&P; Price Target: $3.00
Initiated at buy at Ord Minnett; Price Target: $4.85
Retained at buy at UBS; Price Target: $3.20 from $3.40
Bubs Australia (BUB)
Retained at risk at Bell Potter; Price Target: $0.155
Cobram Estate Olives (CBO)
Retained at hold at Bell Potter; Price Target: $1.950
Collins Foods (CKF)
Retained at buy at Citi; Price Target: $9.38
Capricorn Metals (CMM)
Retained at accumulate at Ord Minnett; Price Target: $9.30 from $8.10
Cochlear (COH)
Upgraded to buy from neutral at Citi; Price Target: $300.00 from $290.00
Capstone Copper Corp. (CSC)
Retained at buy at Ord Minnett; Price Target: $12.50
DGL Group (DGL)
Retained at hold at Bell Potter; Price Target: $0.480
Elders (ELD)
Retained at buy at Bell Potter; Price Target: $9.45
Emerald Resources (EMR)
Retained at sell at Ord Minnett; Price Target: $3.60 from $3.50
Graincorp (GNC)
Retained at hold at Bell Potter; Price Target: $7.45
Integral Diagnostics (IDX)
Upgraded to buy from neutral at Citi; Price Target: $2.70
Inghams Group (ING)
Retained at hold at Bell Potter; Price Target: $3.50
Ioneer (INR)
Retained at buy at Ord Minnett; Price Target: $0.300
Judo Capital (JDO)
Initiated at buy at Jarden; Price Target: $2.60
Lotus Resources (LOT)
Initiated at buy at Ord Minnett; Price Target: $0.350
Magellan Financial Group (MFG)
Retained at neutral at Macquarie; Price Target: $8.37 from $9.50
Macquarie Group (MQG)
Initiated at underweight at Jarden; Price Target: $200.00
Myer (MYR)
Initiated at overweight at Morgan Stanley; Price Target: $1.100
Newmont Corporation (NEM)
Upgraded to buy from accumulate at Ord Minnett; Price Target: $92.50 from $77.00
Noumi (NOU)
Retained at buy at Bell Potter; Price Target: $0.250
Nufarm (NUF)
Retained at buy at Bell Potter; Price Target: $4.35
Orica (ORI)
Retained at buy at Goldman Sachs; Price Target: $21.40
Paladin Energy (PDN)
Initiated at neutral at E&P; Price Target: $5.70
Initiated at buy at Ord Minnett; Price Target: $9.60
Upgraded to buy from neutral at UBS; Price Target: $9.70 from $10.00
Perseus Mining (PRU)
Retained at buy at Ord Minnett; Price Target: $3.65 from $3.30
Rural Funds Group (RFF)
Retained at buy at Bell Potter; Price Target: $2.50
Ramsay Health Care (RHC)
Retained at hold at Ord Minnett; Price Target: $37.50 from $38.60
Rio Tinto (RIO)
Retained at buy at Ord Minnett; Price Target: $132.00
Resmed Inc (RMD)
Upgraded to buy from neutral at Citi; Price Target: $44.00 from $41.00
Regis Resources (RRL)
Retained at sell at Ord Minnett; Price Target: $2.40 from $2.10
Resolute Mining (RSG)
Retained at hold at Ord Minnett; Price Target: $0.450 from $0.400
Rox Resources (RXL)
Retained at buy at Canaccord Genuity; Price Target: $0.560
South32 (S32)
Retained at buy at Ord Minnett; Price Target: $4.50 from $4.55
Select Harvests (SHV)
Retained at buy at Bell Potter; Price Target: $5.80
Synlait Milk (SM1)
Retained at hold at Bell Potter; Price Target: $0.470
Technology One (TNE)
Retained at hold at Bell Potter; Price Target: $30.50 from $29.50
West African Resources (WAF)
Retained at buy at Ord Minnett; Price Target: $2.55 from $2.00
Xero (XRO)
Retained at buy at Goldman Sachs; Price Target: $201.00
Scans
Top Gainers
Code | Company | Last | % Chg |
|---|---|---|---|
| CAG | Cape Range Ltd | $0.095 | +43.94% |
| DDB | Dynamic Group Holdings Ltd | $0.28 | +40.00% |
| RTG | RTG Mining Inc | $0.025 | +31.58% |
| AUG | Augustus Minerals Ltd | $0.043 | +30.30% |
| TG6 | TG Metals Ltd | $0.135 | +28.57% |
Top Fallers
Code | Company | Last | % Chg |
|---|---|---|---|
| APC | APC Minerals Ltd | $0.012 | -45.46% |
| AOF | Australian Unity Office Fund | $0.865 | -22.42% |
| ASQ | Australian Silica Quartz Group Ltd | $0.022 | -21.43% |
| ACU | Acumentis Group Ltd | $0.076 | -20.00% |
| ARI | Arika Resources Ltd | $0.029 | -19.44% |
52 Week Highs
Code | Company | Last | % Chg |
|---|---|---|---|
| EMP | Emperor Energy Ltd | $0.039 | +14.71% |
| FRM | Farm Pride Foods Ltd | $0.22 | +12.82% |
| AZY | Antipa Minerals Ltd | $0.40 | +12.68% |
| WAF | West African Resources Ltd | $2.11 | +11.94% |
| YOJ | Yojee Ltd | $0.17 | +6.25% |
52 Week Lows
Code | Company | Last | % Chg |
|---|---|---|---|
| AOF | Australian Unity Office Fund | $0.865 | -22.42% |
| TM1 | Terra Metals Ltd | $0.021 | -12.50% |
| WEC | White Energy Company Ltd | $0.028 | -12.50% |
| CCG | Comms Group Ltd | $0.05 | -10.71% |
| IXC | INVEX Therapeutics Ltd | $0.06 | -9.09% |
Near Highs
Code | Company | Last | % Chg |
|---|---|---|---|
| GCI | Gryphon Capital Income Trust | $2.03 | +0.50% |
| IHD | Ishares S&P/ASX DIV Opportunities Esg Screened ETF | $14.30 | +0.21% |
| BILL | Ishares Core Cash ETF | $100.73 | +0.01% |
| GLDN | Ishares Physical Gold ETF | $36.55 | -1.48% |
| MTO | Motorcycle Holdings Ltd | $1.99 | 0.00% |
Relative Strength Index (RSI) Oversold
Code | Company | Last | % Chg |
|---|---|---|---|
| STX | Strike Energy Ltd | $0.175 | -2.78% |
| EGH | Eureka Group Holdings Ltd | $0.55 | 0.00% |
| CCR | Credit Clear Ltd | $0.245 | -2.00% |
| XYZ | Block, Inc | $95.99 | -0.76% |
| JPEQ | JPM US100Q EQ Prem Inc Active ETF (Managed Fund) | $61.78 | -0.52% |
