
News | Market Wraps
Evening Wrap: ASX 200 dumps again as WDS, STO and Co. trade to 3-year lows, COL and WOW dividends drag
The S&P/ASX 200 closed 57.0 points lower, down 0.70%.

Mentioned
ASX 200 futures are down 79pts (-0.99%) as of 8:30 am AEDT.
Not dissimilar themes from what we have become accustomed to on the ASX 200 today – stronger gold stocks and weaker energy stocks. On the latter, I note they traded to their worst levels in over three years. 📉
Dividends were another major theme today, with sizeable payouts from several Consumer Staples stocks including major supermarket operators Coles Group (COL) and Woolworths (WOW). Dividends equal share price losses, and both lost substantial ground today as a result.
Click/scroll through for the usual reporting of the major sector and stock-specific moves, the broker responses to them, as well as all the key upcoming economic data in tonight's Evening Wrap.
Also, I have detailed technical analysis on the NASDAQ Composite, S&P/ASX 200, and Uranium in today's ChartWatch.
Let's dive in!
Today in Review
Wed 05 Mar 25, 5:28pm (AEST)
Name | Value | % Chg |
|---|---|---|
Major Indices | ||
| ASX 200 | 8,141.1 | -0.70% |
| All Ords | 8,363.1 | -0.69% |
| Small Ords | 3,078.9 | -0.75% |
| All Tech | 3,730.6 | -0.37% |
| Emerging Companies | 2,224.8 | -0.82% |
Currency | ||
| AUD/USD | 0.6255 | -0.29% |
US Futures | ||
| S&P 500 | 5,826.5 | +0.64% |
| Dow Jones | 42,813.0 | +0.51% |
| Nasdaq | 20,552.75 | +0.75% |
Name | Value | % Chg |
|---|---|---|
Sector | ||
| Utilities | 8,924.8 | +0.11% |
| Real Estate | 3,702.9 | +0.10% |
| Materials | 16,390.5 | -0.03% |
| Information Technology | 2,529.9 | -0.10% |
| Health Care | 43,158.5 | -0.12% |
| Communication Services | 1,705.9 | -0.28% |
| Industrials | 7,994.3 | -0.88% |
| Financials | 8,569.2 | -0.95% |
| Consumer Discretionary | 4,011.7 | -1.09% |
| Energy | 8,125.3 | -1.68% |
| Consumer Staples | 11,510.7 | -3.56% |
Markets

ASX 200 Session Chart
The S&P/ASX 200 (XJO) finished 57.0 points lower at 8,141.1, roughly at the mid-point of the session's range, 0.56% from the low and 0.70% from the high. In the broader-based S&P/ASX 300 (XKO), advancers lagged decliners by a convincing 78 to 196.
The Gold (XGD) sub-index (+0.50%) was the best performing sector today, likely in response to a modest rebound in the gold price overnight, and continued resilience in Asian trade today.
I note that several gold stocks made the gainers list in the Interesting Moves section below, and in particular stocks like West African Resources (ASX: WAF) (+6.5%), Ora Banda Mining (ASX: OBM) (+4.9%), Black Cat Syndicate (ASX: BC8) (+4.7) have each appeared regularly in my ChartWatch ASX Scans Feature Uptrends for months.
I suspect, perusing their candles for today, they will each appear again in tomorrow’s update! 📈
Also avoiding the broader-market losses were the bond-proxy duo of Real Estate Investment Trusts (XPJ) (+0.19%) and Utilities (XUJ) (+0.11%). They earned a reprieve from recent losses likely due to the fact that even though risk-free market yields steadied overnight (chart in ChartWatch section below), they remain 0.25% rate cut multiples below where they were just a couple of weeks ago.
All other major ASX sectors logged losses, the heaviest of which was suffered by Consumer Staples (XSJ) (-3.6%), as major constituents Treasury Wine Estates (ASX: TWE) (-5.6%), Coles Group (ASX: COL) (-4.4%) and Woolworths (ASX: WOW) (-3.9%) each went ex-dividend.
Elsewhere, perennial loser Energy (XEJ) (-1.7%) took another turn for the worse, trading to is lowest level in over three years as investors continued to sell down sector holdings in the wake of falls in crude oil and uranium prices. As far as I can tell, dividends were not to blame here (although I do note Woodside Energy (ASX: WDS) (-1.5%) goes ex-div tomorrow).
%20chart%2005%20March%202025.png)
S&P/ASX 200 Energy Sector Index (XEJ) – a woeful existence! 👎 (click here for full size image)

Consumer Discretionary (XDJ) (-1.1%) and Financials (XFJ) (-0.95%) rounded out the list of worst performers at a sector level. Both sectors likely to bear the brunt of any perceived economic slowdown.
ChartWatch
NASDAQ Composite Index

⚠️ AMBER ALERT!!! ⚠️ (click here for full size image)
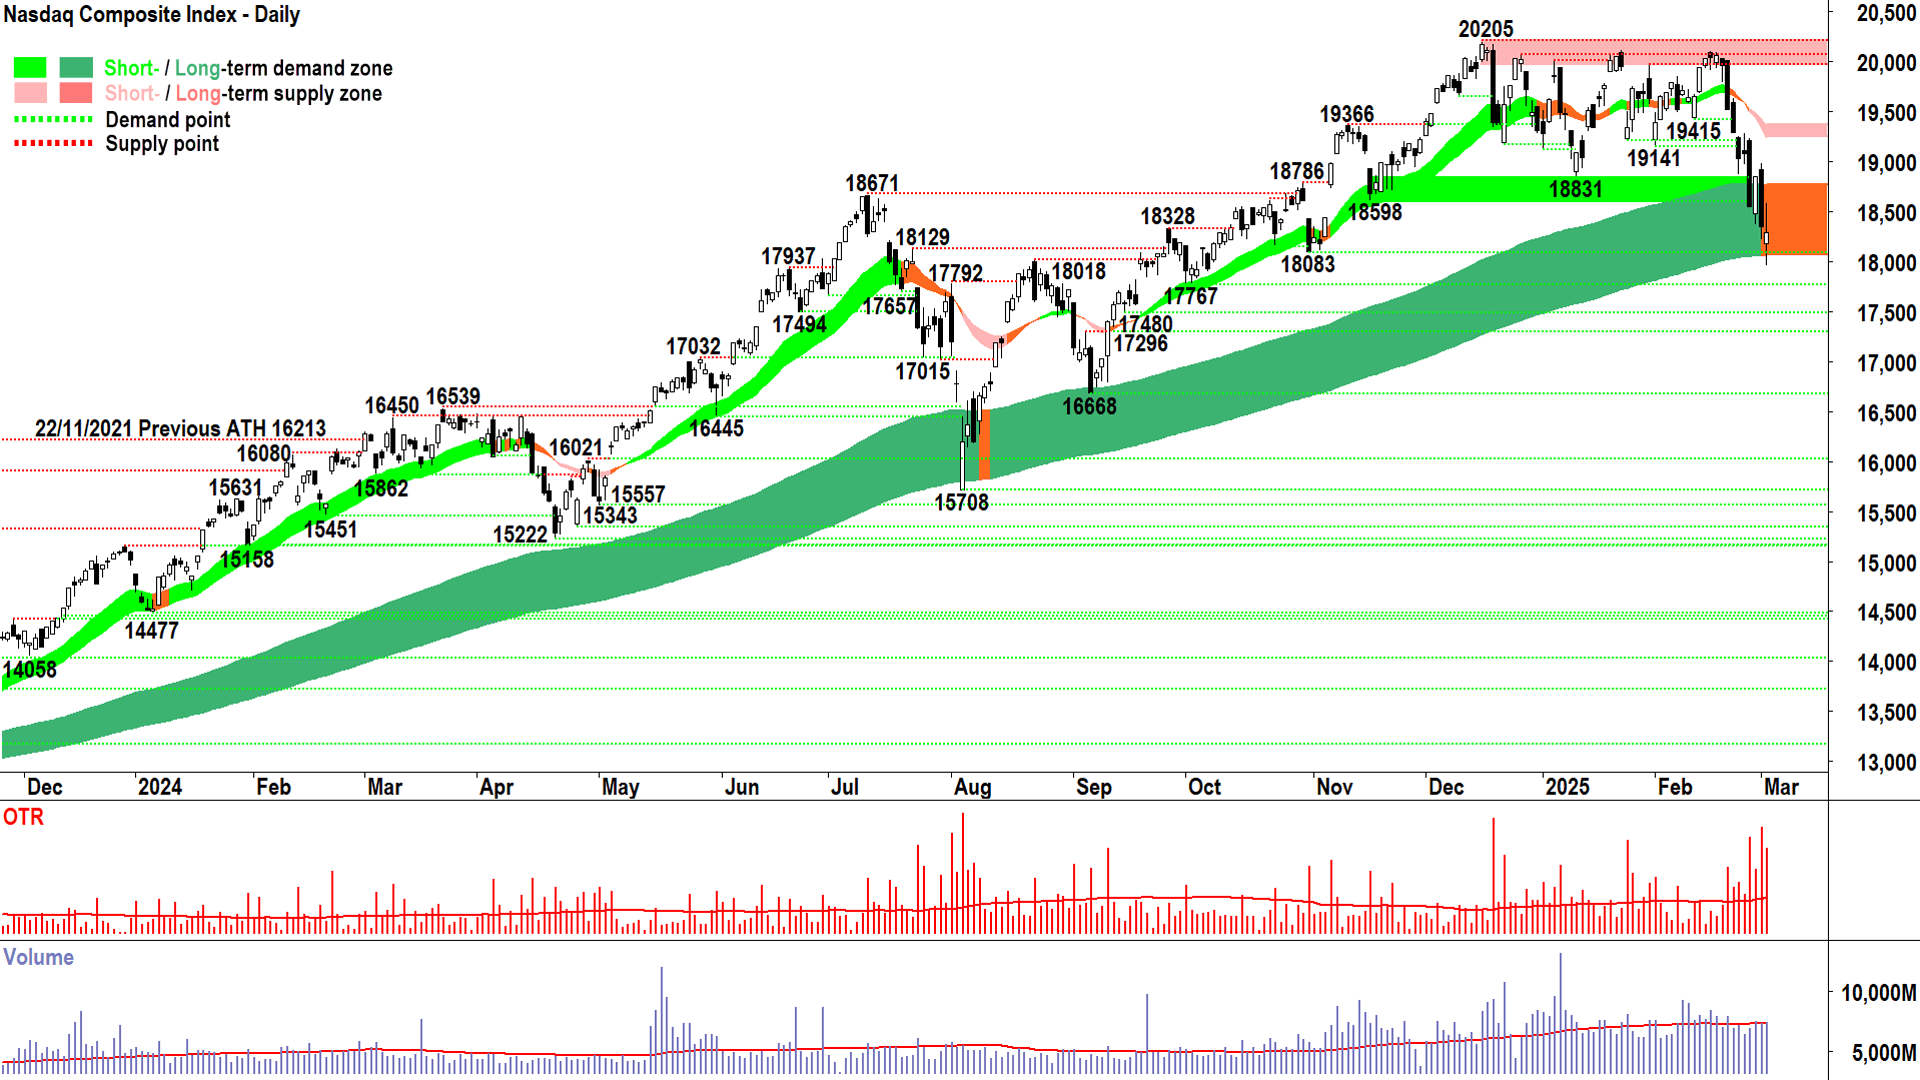
A far from convincing candle on the Comp Tuesday, and across the spectrum of major US stock indices.
Its upward pointing shadow shows early demand was quashed by continuing heavy supply. Investors still prefer the sidelines in the form of cash or bonds.
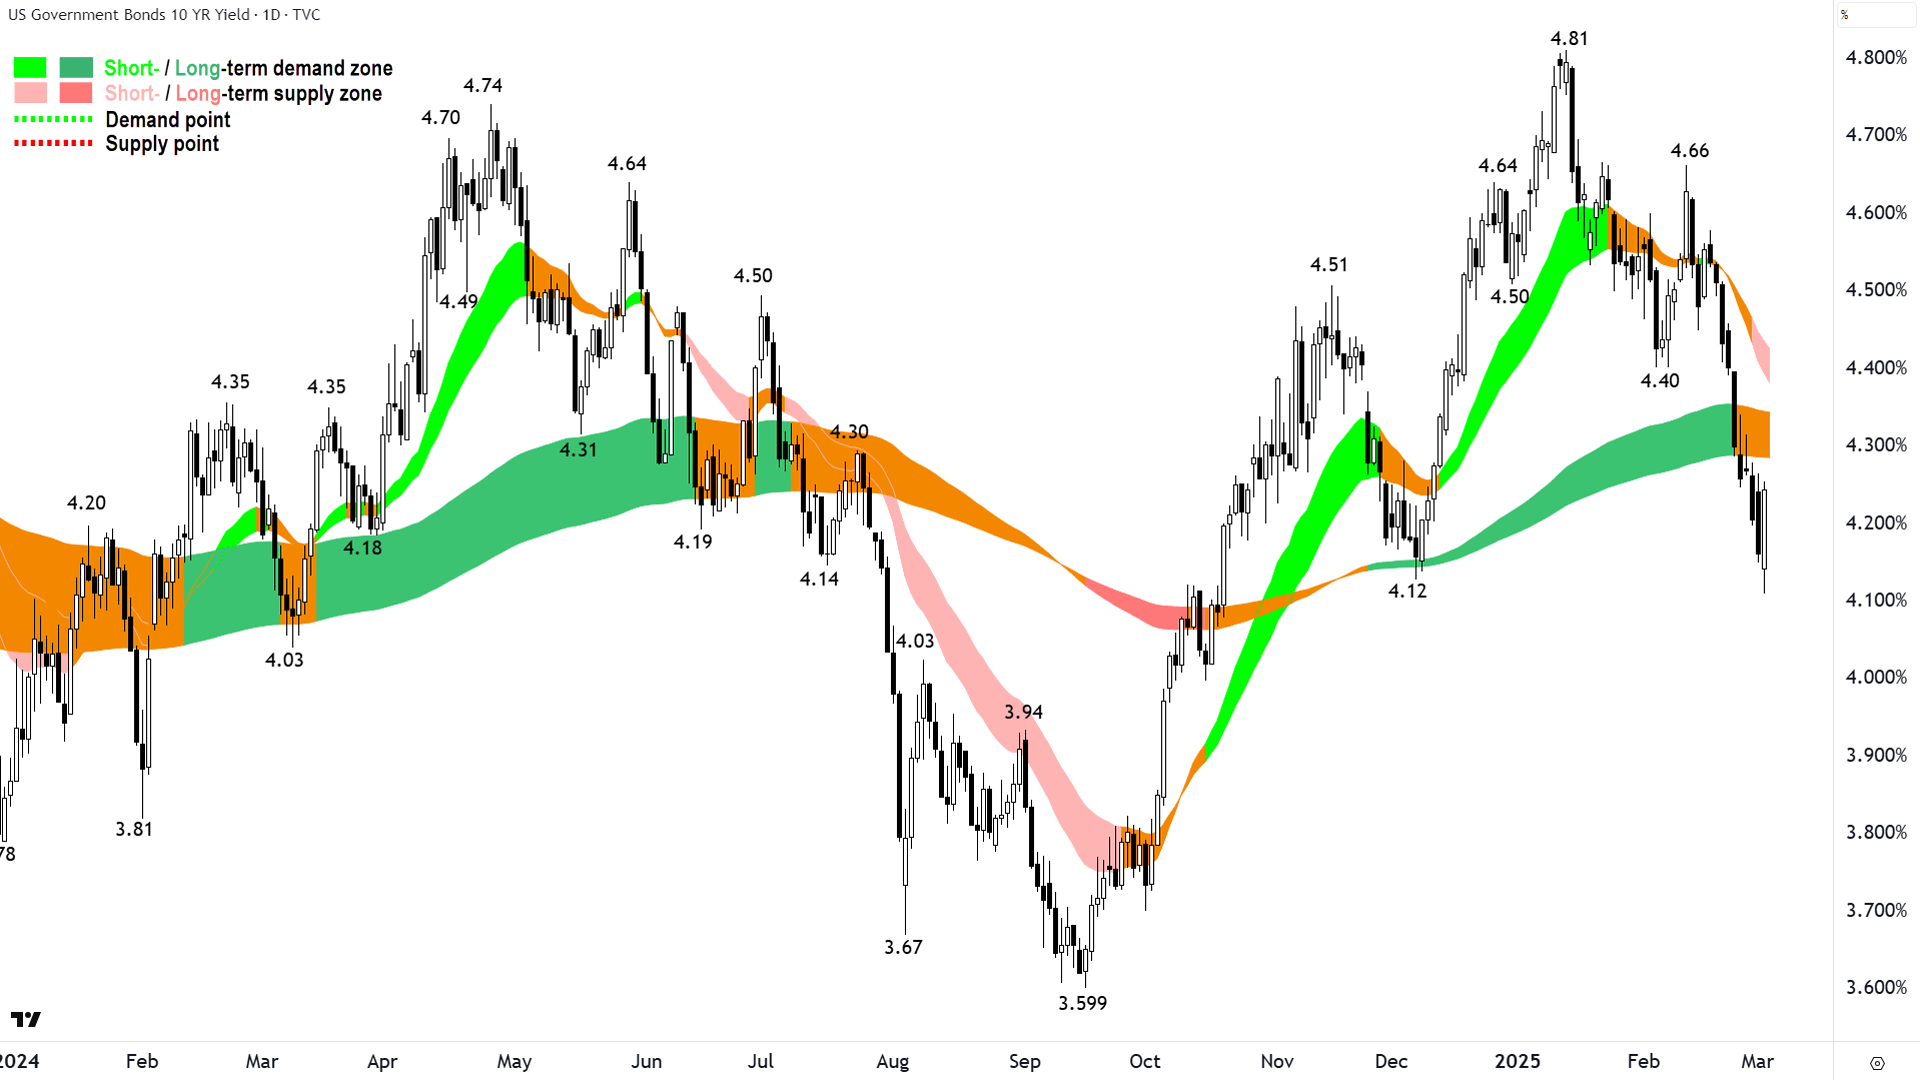
The most fascinating aspect of last night's trade was that last item…bonds. They too fell overnight (pushing risk-free market yields higher – which indicates that compared to stocks and bonds –cash was the big winner.

US 10 Year T-Bond Yield: Yields corresponds with bonds down... (click here for full size image)
So, we have over the last few weeks gone from:
Demand-side market (relatively strong economy + prospect of lower / benign rates outlook) = Demand for Stocks > Demand for Cash & Demand for Bonds
To:
Supply-side market (Trump Trade War / DOGE fears vs economy + prospect of lower rates outlook) = Demand for Stocks < Demand for Cash & Demand for Bonds
To:
Supply-side market (Trump Trade War / DOGE fears vs economy + prospect of lower rates outlook) = Demand for Cash > Demand for Stocks & Demand for Bonds
That last bit might appear only subtle – but it smacks of a market that just wants to be out of everything! Cash, as they say in the classics, is King 👑!
To be fair, though, looking at Tuesday’s candle, it did at least finish with a white body and a modest downward pointing shadow – a shadow that probed the lower depths to the long term trend ribbon.
So, the supply-side didn’t have it all their way – and that’s a smidge encouraging! 🤞
I have almost unanimously for the last 18 months, typed the word “uptrend” after the words “long term” and before the word “ribbon”.
As in: “long term uptrend ribbon”.
Note, about 3 sentences ago, I did not. As in, “long term trend ribbon”.
Yes, the “up” was omitted due to the fact the long term trend ribbon has transitioned to neutral (amber). I don’t think there’s much point in typing “long term neutral ribbon”, do you? 🤔
I will reiterate what I’ve said in the last few sessions since we entered the long term trend ribbon – we need a bounce – and we need it quick.
The longer we go without it, the more entrenched the desire to supply will become – and the more eroded the confidence among the demand-side that buying the dip (i.e., “Plan A”) is still the smartest thing to do.
White candles, downward pointing shadows – preferably big ones – preferably on some above average volume to tell us some big money soaked up some big supply. Tomorrow please, Mr. Market, or I fear we have a date with a far more sinister long term trend change! 🙏
S&P/ASX 200 (XJO)
%20chart%205%20March%202025.png)
Not an amber alert yet...but likely not far away! 🔭 (click here for full size image)
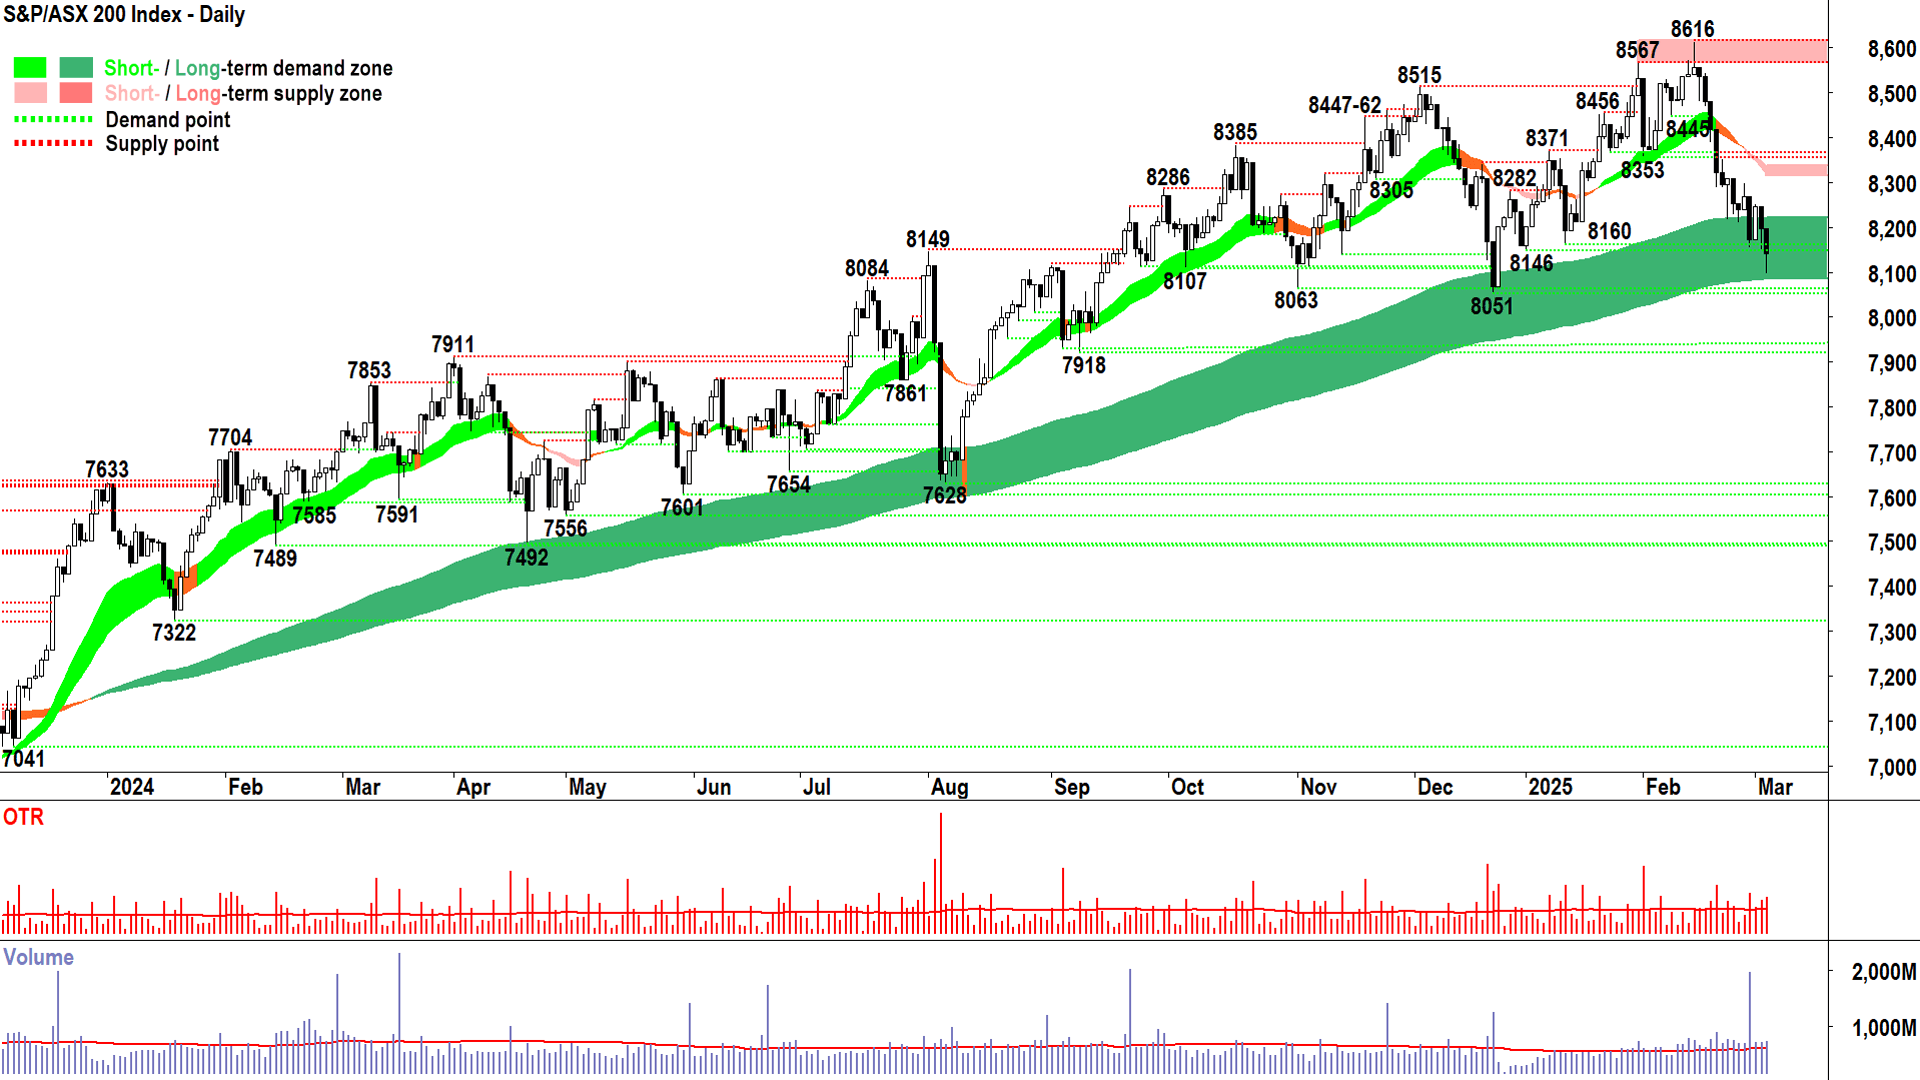
Another day, another unconvincing display from either side of the market.
Sure the supply side closed us with a black candle for the tenth time out of the last 13 candles since that Valentines Day 8616 record high (now but a distant memory!).
But, for the second day straight, and really for arguably the fifth time in the last eight candles, the demand-side showed some fight and bought the dip.
So it's somewhat of a fighting retreat by the demand-side, then. Still, points is points and the XJO has far fewer of those since this last downward move began.
The short term downtrend ribbon, price action (lower peaks and lower troughs), and candles (predominantly supply-side, i.e., black bodied and or upward pointing shadows) all suggest short term supply-side control.
The long term uptrend remains intact, although I suspect it is the better part of a week of further declines before it will, like the Comp's trend ribbon, transition to neutral.
I'd argue that so far, the long term uptrend ribbon is attempting to do its job of acting as a point of dynamic demand – granted it could be doing it better.
The steady buying post-opening-dip over the last two sessions continues to give me hope that the demand-side can grapple back control around here for at least a few candles – if only to ultimately test and fail at now-heavy points of supply that exist all the way back up to 8616.
The first of those pressure points is likely the short term downtrend ribbon, presently around 8315-35, and then there's a couple of static points to contend with at 8353-66.
If I'm wrong, and we're about to crack – I suggest a close below 8051 puts us beyond a point of no return for the long term trend.
Uranium Futures (Front month, back-adjusted) COMEX
%20COMEX%20chart%204%20March%202025.png)
Forget amber...it's all red, red, red, for uranium 🚨 (click here for full size image)
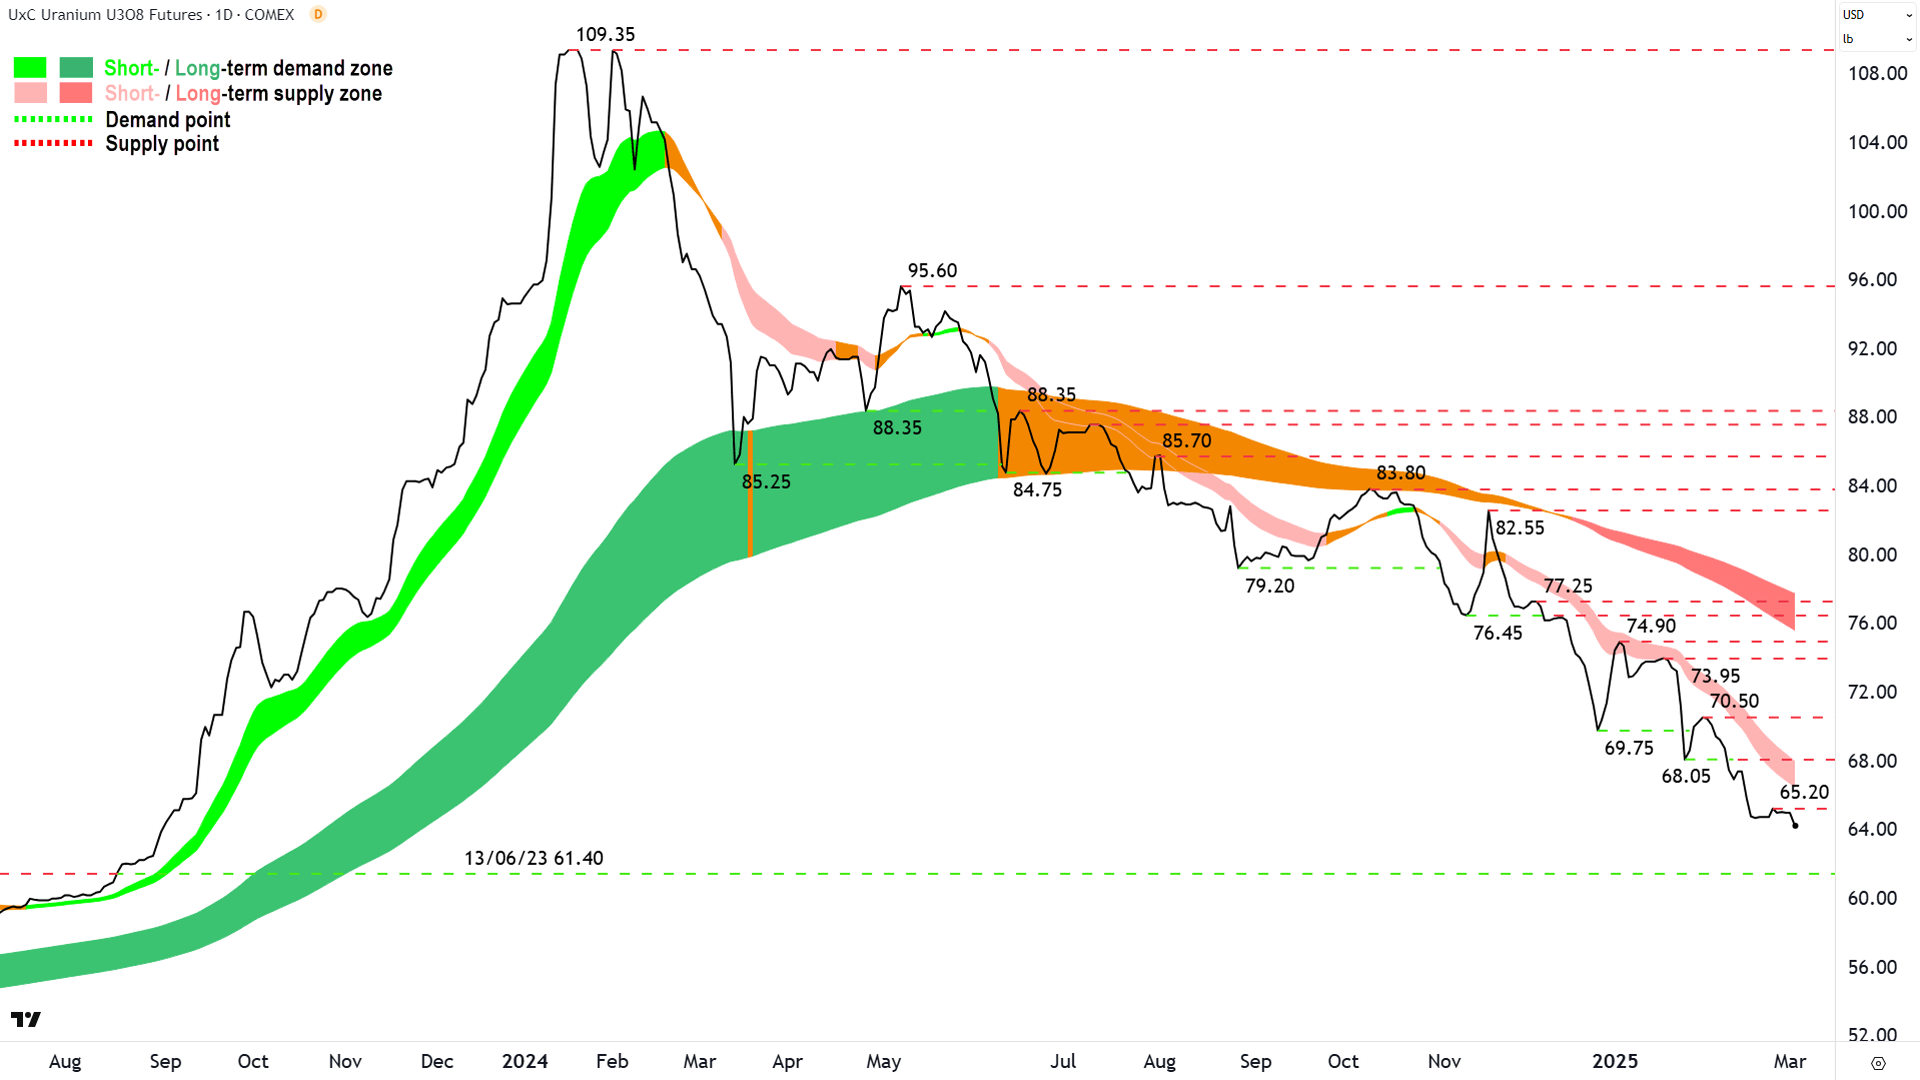
Just a quick update here because I suspect the chart requires little extra analysis compared to our last update on it in the Evening Wrap on 17 February.
But I did refer to it in last night’s Wrap, noting that uranium stocks were belted even as the uranium price shown in the chart above was relatively flat.
As I ticked through my charts this morning, I noted that as of the latest Tuesday print, the uranium price has potentially begun yet another leg down.
Short term and long term downtrends are well intact here – and both continue to do an excellent job of acting as a zone of dynamic supply.
The price action is firmly set at lower peaks and lower troughs, indicating supply reinforcement and demand removal respectively.
Until I see signs of the opposite of the above, there’s no reason to think the prevailing uranium downtrends cannot continue. It will, however, be very interesting to see what happens at the historic 61.40 point of demand. 🧐
I hope my consistent analysis on the uranium price since it turned the corner early last year has helped guide your opinion on ASX listed uranium stocks – which have almost all appeared in my ChartWatch ASX Scans Feature Downtrends lists regularly over the past several months.
The old adage “The trend is your friend” can be substantially misleading if you're of the ignore the trend persuasion – because if this is the case – it might well be your worst enemy! 🤕
Economy
Today
AUS Gross Domestic Product (GDP) December quarter
+0.6% q/q vs +0.5% q/q forecast and +0.3% q/q in September
CHN Caixin Services PMI February
51.4 vs 50.8 forecast and 51.0 in January
Readings over 50 indicate expansion in the sector, so the Chinese Services industry expanded at a faster rate than expected in February
Later this week
Thursday
02:00 USA ISM Services PMI February (53.0 forecast vs 52.8 in January)
11:30 AUS Building Approvals January (-0.1% forecast vs +0.7% in December)
Friday
00:15 EUR European Central Bank (ECB) Main Refinancing Rate & Statement (2.65% forecast vs 2.9% present)
00:45 EUR ECB Press Conference
Saturday
00:30 USA Non-Farm Payroll Data February
Employment Change: +156,000 forecast vs +143,000 in January
Average Hourly Earnings: +0.3% m/m forecast vs +0.5% m/m in January
Unemployment Rate: 4.0% forecast vs 4.0% in January
Latest News
Interesting Movers
Trading higher
+15.1% Vulcan Energy Resources (VUL) - No news, possibly this glossy love-fest: Forbes Australia – likely stoked some early interest…and the rest was probably frantic short covering!
+10.8% Appen (APX) - Becoming a substantial holder (UBS stock lending agreement usually means shorts getting added – so there's some push and shove going on more broadly speaking), but apart from that, today's move is simply consistent with recent extreme volatility.
+10.0% Novonix (NVX) - No news 🤔 (no other non-company news I could find…decent volume, left field move given prevailing trends. Interesting…perhaps some VUL shorts getting called and having to knock their exposure here also!?).
+6.8% Resolute Mining (RSG) - No news, general strength across the broader Gold sector today.
+6.5% West African Resources (WAF) - No news, general strength across the broader Gold sector today, rise is consistent with prevailing short and long term uptrends, a regular in ChartWatch ASX Scans Uptrends list 🔎📈
+6.1% Clinuvel Pharmaceuticals (CUV) - Continued positive response to 04-Mar CLINUVEL Unveils Vitiligo Program for AAD 2025.
+5.6% Liontown Resources (LTR) - No news 🤔, (seems to be consistently avoiding ongoing losses elsewhere in the sector).
+5.2% Bellevue Gold (BGL) - No news, general strength across the broader Gold sector today.
+5.0% Insignia Financial (IFL) - No news, bounced in the wake of the recent sharp selloff.
+4.9% Ora Banda Mining (OBM) - No news, general strength across the broader Gold sector today, rise is consistent with prevailing short and long term uptrends, a regular in ChartWatch ASX Scans Uptrends list 🔎📈
+4.7% Black Cat Syndicate (BC8) - No news, general strength across the broader Gold sector today, rise is consistent with prevailing short and long term uptrends, a regular in ChartWatch ASX Scans Uptrends list 🔎📈
Trading lower
-13.3% Opthea (OPT) - Continued negative response to 03-Mar Opthea Announces Phase 2b Wet AMD Publication, fall is consistent with prevailing short term downtrend and rising peaks and rising troughs 🔎📉
-11.1% Iperionx (IPX) - No news, fall is consistent with prevailing short term downtrend and rising peaks and rising troughs 🔎📉
-6.4% WA1 Resources (WA1) - No news, fall is consistent with prevailing short term downtrend and long term trend is transitioning from up to down, a regular in ChartWatch ASX Scans Downtrends list 🔎📉
-5.6% Treasury Wine Estates (TWE) - No news, ex-div $0.20 70% franked explains some of the move, fall is consistent with prevailing short and long term downtrends, a regular in ChartWatch ASX Scans Downtrends list 🔎📉
-5.4% Audinate Group (AD8) - Ceasing to be a substantial holder (State Street slipping below 5% on this notice but has been active recently, remember: stock lend equates to short sellers!), fall is consistent with prevailing short and long term downtrends, a regular in ChartWatch ASX Scans Downtrends list 🔎📉
-5.0% IDP Education (IEL) - Change in substantial holding (ditto, stock lending = shorts!), fall is consistent with prevailing short and long term downtrends, one of the most Featured (highest conviction) stocks in ChartWatch ASX Scans Downtrends list 🔎📉
-4.9% Netwealth Group (NWL) - No news, fall is consistent with prevailing short and long term downtrends, one of the most Featured (highest conviction) stocks in ChartWatch ASX Scans Downtrends list 🔎📉
-4.7% Kelsian Group (KLS) - No news since 03-Mar Response to ASX Aware Letter, fall is consistent with prevailing short and long term downtrends, one of the most Featured (highest conviction) stocks in ChartWatch ASX Scans Downtrends list 🔎📉
-4.7% Ampol (ALD) - No news, fall is consistent with prevailing short and long term downtrends, one of the most Featured (highest conviction) stocks in ChartWatch ASX Scans Downtrends list 🔎📉
-4.4% Alpha HPA (A4N) - Change of Director's Interest Notice.
-4.4% Coles Group (COL) - No news, ex-div $0.37 fully franked.
-4.3% Accent Group (AX1) - No news, fall is consistent with prevailing short and long term downtrends, a regular in ChartWatch ASX Scans Downtrends list 🔎📉
-4.2% Redox (RDX) - No news, fall is consistent with prevailing short and long term downtrends, a regular in ChartWatch ASX Scans Downtrends list 🔎📉
Broker Moves
ARN Media (A1N)
Retained at accumulate at Ord Minnett; Price Target: $0.580 from $0.640
Aristocrat Leisure (ALL)
Retained at buy at Citi; Price Target: $74.00
Articore Group (ATG)
Retained at hold at Morgans; Price Target: $0.410 from $0.580
Australian Vanadium (AVL)
Retained at buy at Shaw and Partners; Price Target: $0.080 from $0.060
American West Metals (AW1)
Retained at buy at Shaw and Partners; Price Target: $0.200 from $0.320
Antipa Minerals (AZY)
Retained at buy at Canaccord Genuity; Price Target: $0.950 from $0.700
Retained at buy at Shaw and Partners; Price Target: $0.660 from $0.360
Beforepay Group (B4P)
Retained at buy at Shaw and Partners; Price Target: $2.15
Credit Corp Group (CCP)
Retained at neutral at Macquarie; Price Target: $16.27
Charter Hall Group (CHC)
Retained at neutral at Citi; Price Target: $18.50
Coles Group (COL)
Initiated at outperform at RBC Capital Markets; Price Target: $22.00
Charter Hall Retail Reit (CQR)
Retained at buy at Citi; Price Target: $4.00
Corporate Travel Management (CTD)
Retained at overweight at Morgan Stanley; Price Target: $18.30
Core Lithium (CXO)
Initiated at buy at Argonaut Securities; Price Target: $0.000
Domino's Pizza Enterprises (DMP)
Retained at neutral at Citi; Price Target: $31.82
Endeavour Group (EDV)
Retained at neutral at Jarden; Price Target: $4.30 from $5.00
Retained at neutral at JP Morgan; Price Target: $4.80 from $4.70
Fleetpartners Group (FPR)
Upgraded to buy from hold at Canaccord Genuity; Price Target: $3.40
Healthco Healthcare and Wellness Reit (HCW)
Retained at underweight at Morgan Stanley; Price Target: $1.040
Harvey Norman (HVN)
Upgraded to buy from hold at Jefferies; Price Target: $5.85 from $4.75
Retained at overweight at JP Morgan; Price Target: $6.50 from $6.30
Medibank Private (MPL)
Downgraded to hold from buy at Jefferies; Price Target: $4.80 from $4.40
Retained at overweight at JP Morgan; Price Target: $4.75 from $4.65
NRW (NWH)
Upgraded to buy from hold at Argonaut Securities; Price Target: $3.70 from $3.95
Retained at outperform at CLSA; Price Target: $3.60 from $4.15
Downgraded to overweight from buy at Jarden; Price Target: $3.10 from $3.85
Retained at neutral at Macquarie; Price Target: $3.00 from $3.37
Orica (ORI)
Retained at outperform at Macquarie; Price Target: $20.78
Pexa Group (PXA)
Retained at outperform at CLSA; Price Target: $16.80 from $16.50
Retained at neutral at Jarden; Price Target: $15.55 from $15.30
Retained at overweight at JP Morgan; Price Target: $16.00
Retained at outperform at Macquarie; Price Target: $14.72 from $14.64
Resource Development Group (RDG)
Retained at hold at Bell Potter; Price Target: $0.015 from $0.027
RAS Technology (RTH)
Retained at buy at Ord Minnett; Price Target: $1.780 from $1.660
Reliance Worldwide Corporation (RWC)
Upgraded to overweight from neutral at Jarden; Price Target: $5.60
Scentre Group (SCG)
Retained at buy at Citi; Price Target: $3.90
Shine Justice (SHJ)
Retained at buy at Carter Bar Securities; Price Target: $1.120 from $1.390
Retained at buy at Moelis Australia; Price Target: $0.810
Retained at overweight at QValue; Price Target: $1.250 from $1.500
Santana Minerals (SMI)
Retained at buy at Canaccord Genuity; Price Target: $1.330 from $1.300
Supply Network (SNL)
Downgraded to accumulate from buy at Ord Minnett; Price Target: $36.30 from $33.00
Service Stream (SSM)
Retained at buy at Canaccord Genuity; Price Target: $1.950
Retained at outperform at CLSA; Price Target: $2.00
Retained at overweight at Macquarie; Price Target: $1.860
Upgraded to buy from hold at Ord Minnett; Price Target: $1.940 from $1.780
Retained at overweight at RBC Capital Markets; Price Target: $2.00
Strickland Metals (STK)
Retained at buy at Canaccord Genuity; Price Target: $0.180
Southern Cross Media Group (SXL)
Downgraded to accumulate from buy at Ord Minnett; Price Target: $0.700
Turaco Gold (TCG)
Retained at buy at Canaccord Genuity; Price Target: $0.750
TPG Telecom (TPG)
Retained at overweight at Jarden; Price Target: $5.20 from $5.25
Retained at hold at Jefferies; Price Target: $5.00 from $4.80
Woolworths Group (WOW)
Initiated at sector perform at RBC Capital Markets; Price Target: $31.00
Scans
Top Gainers
Code | Company | Last | % Chg |
|---|---|---|---|
| LMS | Litchfield Minerals Ltd | $0.135 | +42.11% |
| HE8 | Helios Energy Ltd | $0.017 | +41.67% |
| IMI | Infinity Mining Ltd | $0.014 | +27.27% |
| PNT | Panther Metals Ltd | $0.019 | +26.67% |
| RGT | Argent Biopharma Ltd | $0.18 | +24.14% |
Top Fallers
Code | Company | Last | % Chg |
|---|---|---|---|
| TOU | Tlou Energy Ltd | $0.012 | -20.00% |
| BEZ | Besra Gold Inc | $0.029 | -19.44% |
| SRJ | SRJ Technologies Group Plc | $0.029 | -19.44% |
| EV1 | Evolution Energy Minerals Ltd | $0.018 | -18.18% |
| OCN | Oceana Lithium Ltd | $0.023 | -17.86% |
52 Week Highs
Code | Company | Last | % Chg |
|---|---|---|---|
| BSX | Blackstone Minerals Ltd | $0.078 | +11.43% |
| APW | Aims Property Securities Fund | $2.51 | +9.13% |
| DYM | Dynamic Metals Ltd | $0.325 | +8.33% |
| WAF | West African Resources Ltd | $1.885 | +6.50% |
| BC8 | Black Cat Syndicate Ltd | $0.885 | +4.73% |
52 Week Lows
Code | Company | Last | % Chg |
|---|---|---|---|
| TOU | Tlou Energy Ltd | $0.012 | -20.00% |
| BEZ | Besra Gold Inc | $0.029 | -19.44% |
| CAG | Cape Range Ltd | $0.066 | -17.50% |
| 1AD | Adalta Ltd | $0.011 | -15.39% |
| CML | Connected Minerals Ltd | $0.15 | -14.29% |
Near Highs
Code | Company | Last | % Chg |
|---|---|---|---|
| BILL | Ishares Core Cash ETF | $100.72 | 0.00% |
| GLDN | Ishares Physical Gold ETF | $37.10 | -0.30% |
| MTO | Motorcycle Holdings Ltd | $1.99 | -0.25% |
| JEPI | Jpmorgan EQ Prem Income Active ETF (Managed Fund) | $56.25 | -2.11% |
| AGI | Ainsworth Game Technology Ltd | $0.925 | +2.78% |
Relative Strength Index (RSI) Oversold
Code | Company | Last | % Chg |
|---|---|---|---|
| STX | Strike Energy Ltd | $0.18 | -2.70% |
| EGH | Eureka Group Holdings Ltd | $0.55 | 0.00% |
| CCR | Credit Clear Ltd | $0.25 | -5.66% |
| XYZ | Block, Inc | $96.72 | -4.10% |
| DGL | DGL Group Ltd | $0.46 | 0.00% |
