News | Market Wraps
Evening Wrap: ASX 200 gains on strong performances from WBC, NST, as energy and lithium stocks sink
The S&P/ASX 200 closed 24.9 points higher, up 0.30%.

Mentioned
The S&P/ASX 200 closed 24.9 points higher, up 0.30%.
A solid performance from banking and gold stocks helped the ASX 200 to a whisker from a record close (on a total return basis). Westpac Banking Corp (WBC) (+2.7%) led the way in the banks, while Northern Star Resources (NST) (+3.2%) was the standout in gold.
Energy stocks took a breather as oil and natural gas prices dipped, but uranium stocks firmed. Elsewhere, the downturn in the lithium sector appears to be taking another painful leg down as Pilbara Minerals (ASX: PLS) (-5.7%) closed at a 4-year low.
To make sense of all the above, I have detailed technical analysis on the Nasdaq Composite, S&P/ASX 200, and Copper in today's ChartWatch.
Be sure to click/scroll through for the usual reporting of the major sector and stock-specific moves, the broker responses to them, as well as all the key upcoming economic data in tonight's Evening Wrap.
Let's dive in!
Today in Review
Fri 30 May 25, 5:18pm (AEST)
Name | Value | % Chg |
|---|---|---|
Major Indices | ||
| ASX 200 | 8,434.7 | +0.30% |
| All Ords | 8,660.3 | +0.26% |
| Small Ords | 3,229.0 | +0.45% |
| All Tech | 4,001.0 | -0.47% |
| Emerging Companies | 2,288.5 | +0.62% |
Currency | ||
| AUD/USD | 0.6444 | 0.00% |
US Futures | ||
| S&P 500 | 5,910.0 | -0.22% |
| Dow Jones | 42,213.0 | -0.13% |
| Nasdaq | 21,354.5 | -0.25% |
Name | Value | % Chg |
|---|---|---|
Sector | ||
| Utilities | 9,262.5 | +1.18% |
| Consumer Staples | 12,404.9 | +0.96% |
| Financials | 9,137.8 | +0.73% |
| Real Estate | 3,877.6 | +0.54% |
| Materials | 16,367.6 | +0.33% |
| Health Care | 42,053.1 | +0.17% |
| Industrials | 8,288.8 | +0.02% |
| Communication Services | 1,823.6 | -0.42% |
| Consumer Discretionary | 4,081.3 | -0.45% |
| Information Technology | 2,879.9 | -0.58% |
| Energy | 7,958.3 | -1.37% |
Markets
%20intraday%20chart%2030%20May%202025.png)
ASX 200 Session Chart
The S&P/ASX 200 (XJO) finished 24.9 points higher at 8,434.7, % from its session high/low and just % from its high/low. Despite what looked like a clear cut winner at benchmark level, in the broader-based S&P/ASX 300 (XKO) advancers only just pipped decliners by 147 to 133.
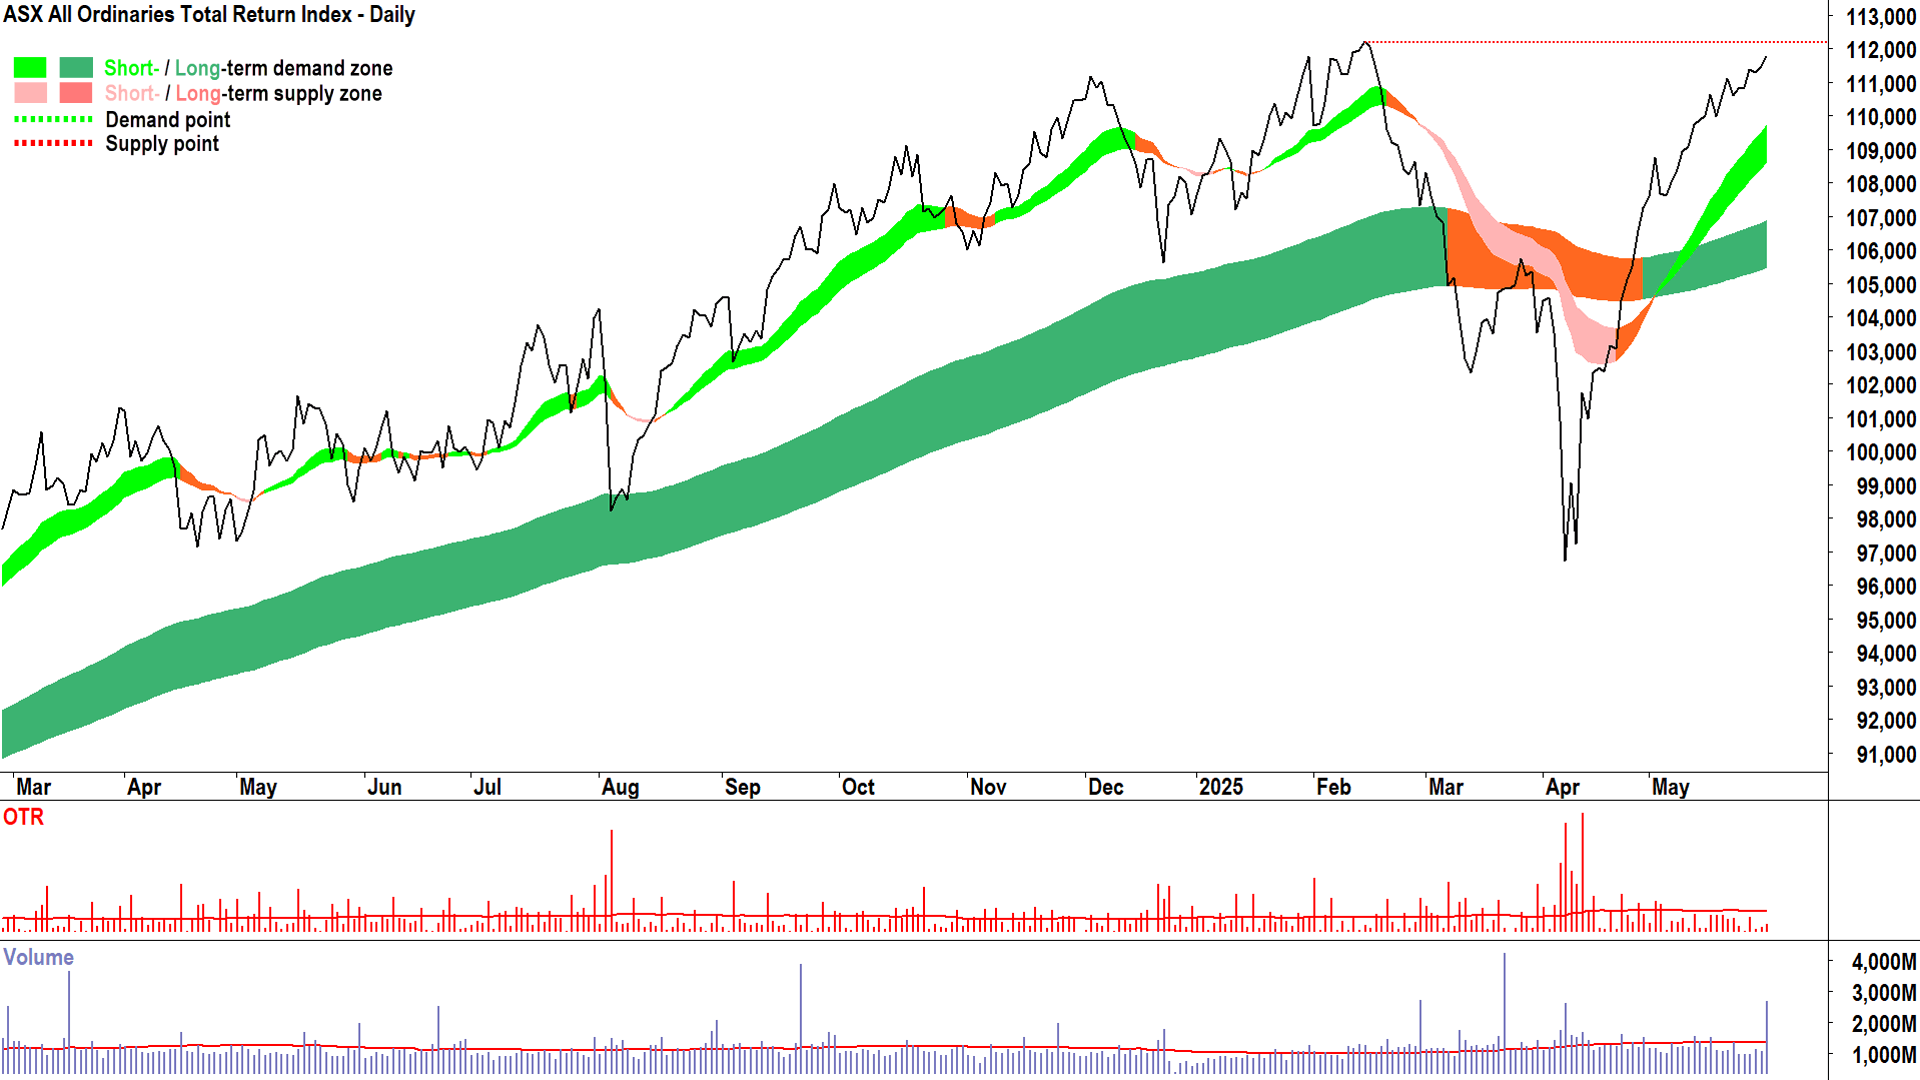
For the week, the XJO finished up 73.8 points or 0.88% higher, 1.02% from its intraweek low and just 0.22% from its intraweek high. This was the XJO's third weekly gain, and it has now risen in six of the last seven weeks for a total gain of 1,265 points, or 17.7%, from the 11 April low of 7169.2.
Not too shabby. Consider, though, that if we add back dividends, we're only 0.1% or so from making a new all time high on a total return basis. Like nothing ever happened...
%20chart%2030%20May%202025.png)
ASX All Ordinaries Total Return Index (XAOA) (click here for full size image)
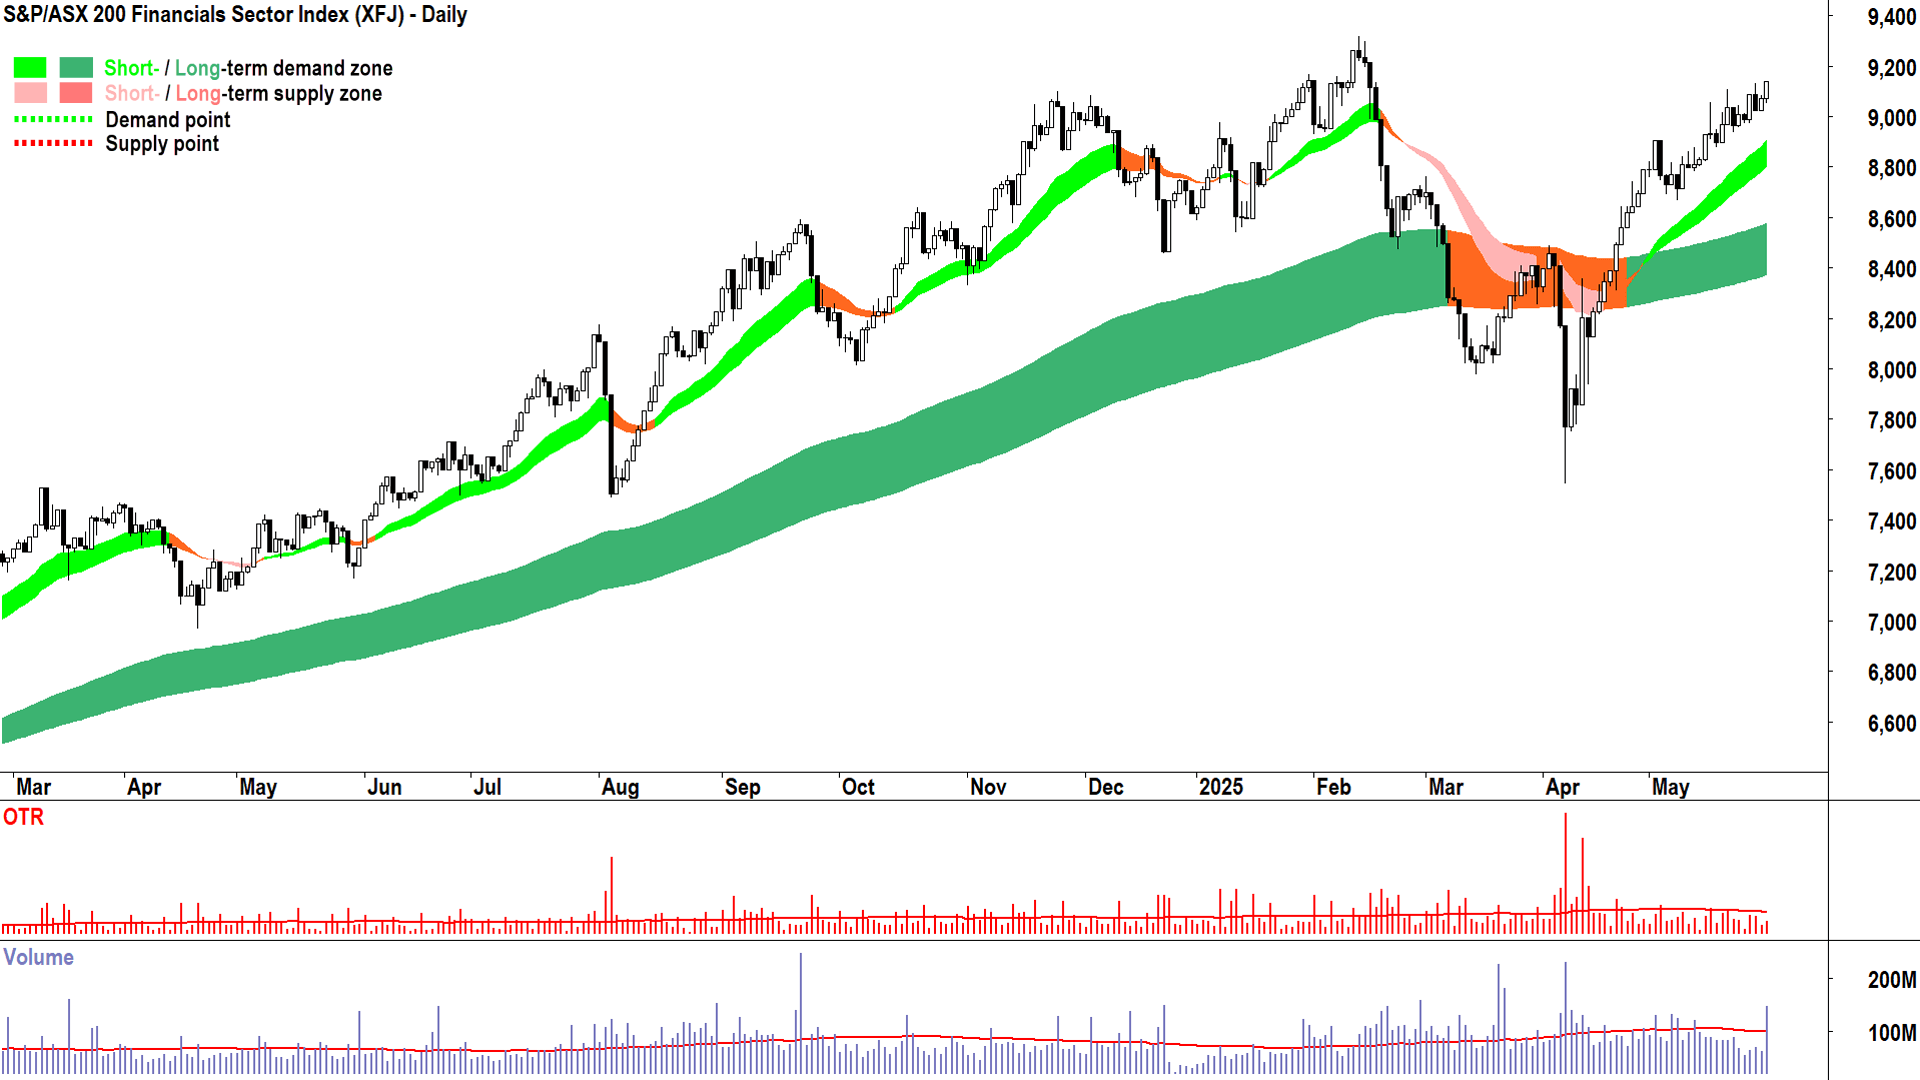
Talking about like nothing ever happened, one of the key drivers of our pre-Trump trade war success was our Financials (XFJ) (+0.73%) sector, but more specifically, this was due to our big four banks ANZ Group (ASX: ANZ) (+0.42%), Commonwealth Bank of Australia (ASX: CBA) (+0.87%), National Australia Bank (ASX: NAB) (+1.3%), and Westpac Banking Corporation (ASX: WBC) (+2.7%).
As you can see, each had a very decent day today, and due to their sheer bulk in the XJO’s weighting, it was always going to be a decent day for the benchmark. As you can also see from the chart below of the XFJ, trends, price action, and candles are looking very good here again, too.
%20chart%2030%20May%202025.png)
Financials (XFJ) (click here for full size image)
And yet, there's a continued resounding cry of "overvalued" from the value-investing fund manager establishment. If I had a dollar for every time I read about a fundie who has probably refused to buy the banks all the way up complain about overvaluations in the sector, particularly with respect to CBA, well, I'd probably have about 50 bucks 💰.
Interestingly, if I count the number of times my ChartWatch ASX Scans has run CBA as a Feature Uptrend, i.e., highest conviction over the last 12-months, I'd have exactly 53 bucks! That's roughly once a week me calling CBA out as one of the strongest uptrends on the entire ASX. Looking at today's candle, let's make that 54 bucks by Monday morning's edition 💰💰💰!
%20sub-index%20chart%2030%20May%202025.png)
Gold (XGD) sub-index (click here for full size image)
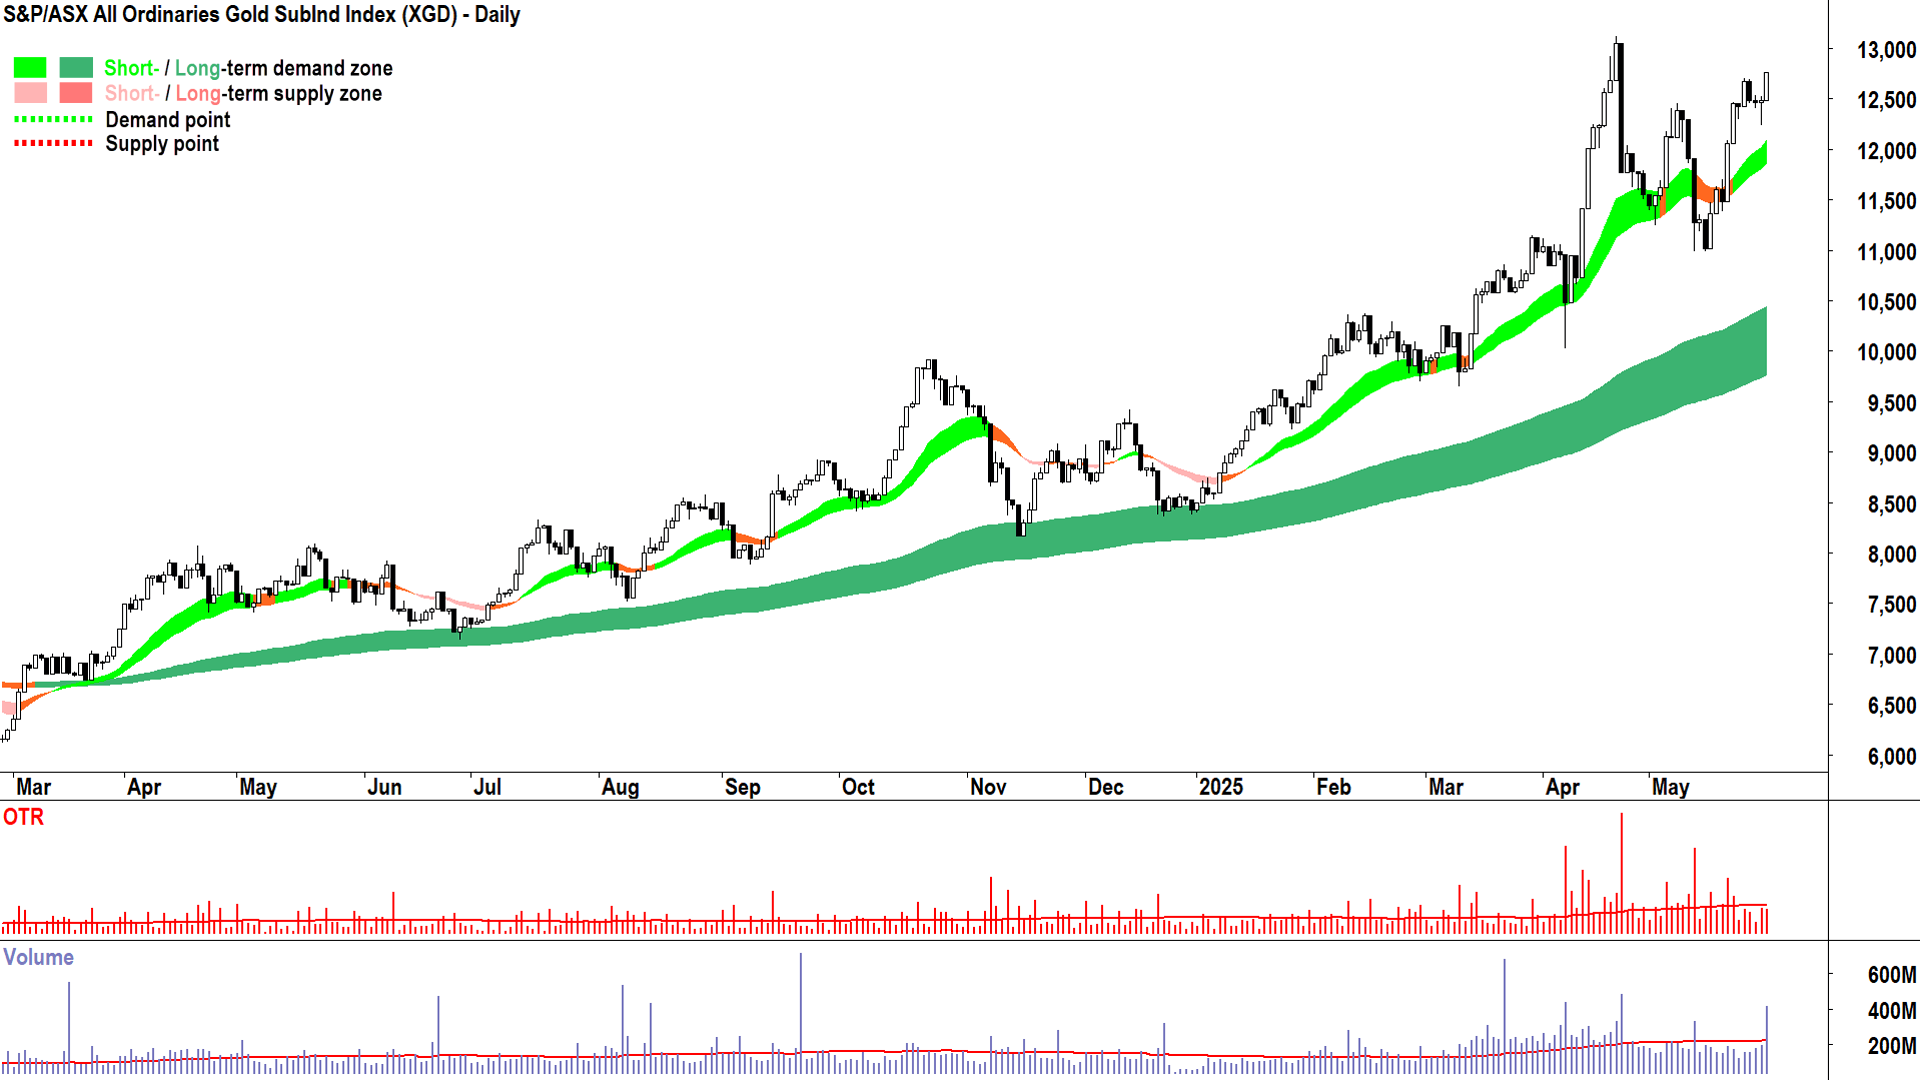
The other sector that was super strong today was the Gold (XGD) sub-index (+2.2%). The gold price was only modestly higher overnight, but that didn't prevent some very solid gains in the sector, headed up by Northern Star Resources (ASX: NST) (+3.2%). Check the Biggest Gainers table below for the rest... Let me just say that at a sector level, this chart is also looking very strong indeed.
Energy (XEJ) (-1.4%) took a backseat today on overnight falls in crude oil and natural gas prices, but the sector will end the week with an overall gain. At least uranium stocks were stronger today, with Silex Systems (ASX: SLX) (+6.8%) the best.
The same cannot be said for lithium stocks, which if they had their own sector, would most definitely have logged weekly a loss. Well, that would also be a monthly, yearly, and...ok, it's not quite decade loss...yet. As we discussed in yesterday's Wrap's ChartWatch, lithium carbonate prices are cascading (as are spodumene prices which are more important for our hard rock miners).
The end result was a new 4-year low close for Pilbara Minerals (ASX: PLS) (-5.7%), but IGO (ASX: IGO) (-5.7%) and Liontown Resources (ASX: LTR) (-3.2%) weren't far behind. It's going to be hard to shake the trends in this sector, and I can't help but take some pride over ChartWatch ASX Scans' massive success in calling these downtrends over the last 12-months.
ChartWatch
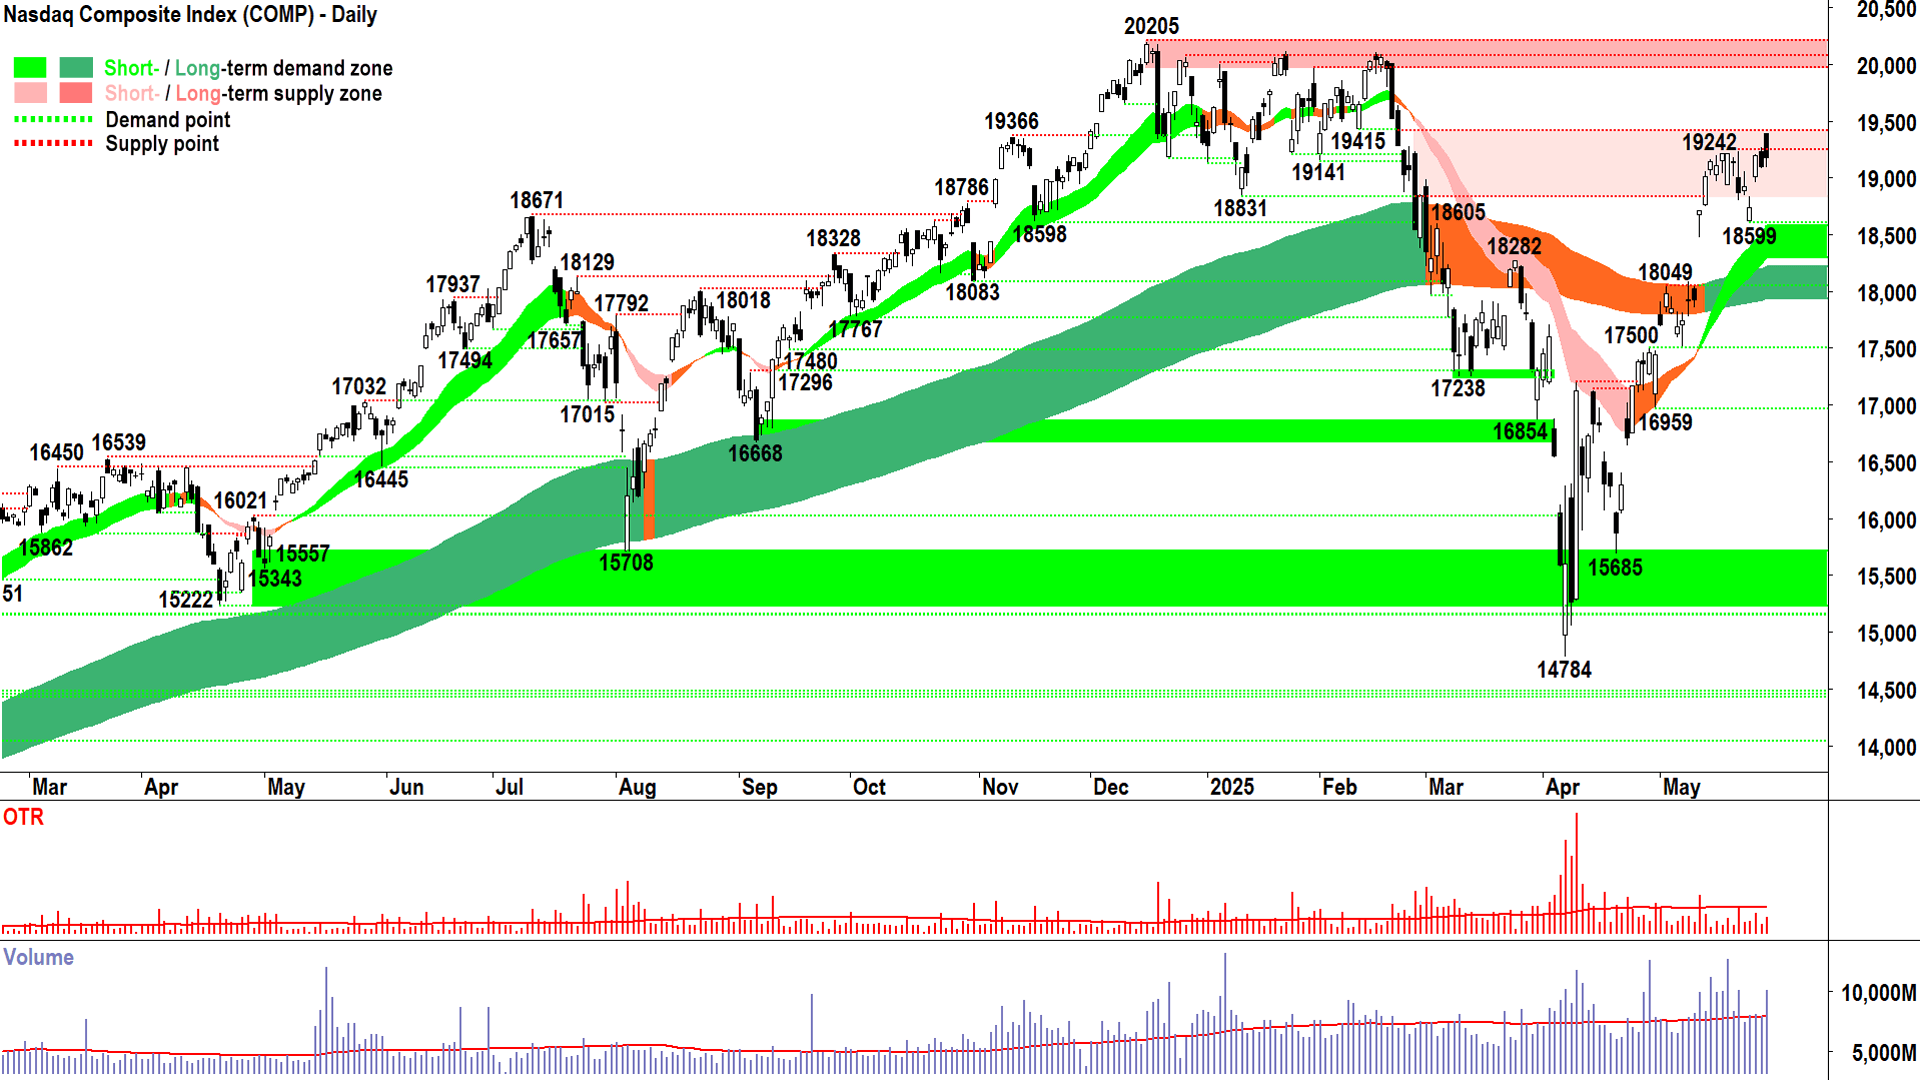
NASDAQ Composite Index

So, should we be concerned? 🤔 (click here for full size image)
A wall of supply taking advantage of elevated prices and liquidity.
That’s usually how we’d explain a candle that opens sharply higher, but then ends with a long, black body.
It demonstrates latent supply at higher prices and is typically associated with supply-side control.
If you want to know what this looks like, then take for example Thursday’s candle on the Comp.
Hey – it did have the very slight saving grace of a modest downward pointing shadow from a rally late in the day, but otherwise, it was a disappointment in terms of how at odds it is with the prevailing demand-side indicators of:
Rising short and long term trends, short and long term uptrend ribbons are acting as zones of dynamic demand (signalling both short and long term demand-side control of the price, buy the dip activity and longer term accumulation)
Rising peaks and rising troughs (signalling growing demand and diminishing supply)
A predominance of demand-side candles (i.e., those with white bodies and or downward pointing shadows) (signalling buy the dip activity and an environment of pervasive excess demand)
Worse again, Thursday’s candle adds to Wednesday’s also supply-side showing.
So, should we be concerned? 🤔
Well, in the sense that absolutely anything can happen (from alien invasion, to the next “beautiful big” executive order, to the declaration of world peace…as well as nothing interesting at all) it depends on what happens next.
Yes, that's a dumb and obvious answer. But it’s a dumb and obvious question.
You should be concerned if you are risking too much and you don’t have any way to determine when to extricate yourself from that risk.
If you are running a modest and calculated level of risk, and you can read a chart…then the answer to the above question is always “No”. Good news, that’s us! 💪
The last two candles are far from ideal. However, I don’t think they’re sufficient to indicate that the supply side has any real control at this stage. They are however, a reminder that we remain in a delicate demand-supply environment where news-related shocks can swing the balance/imbalance between demand and supply rapidly and significantly.
19415 continues to show itself as a credible point of supply (really this is more just the influence of “we’re nearly back to all time highs” than a specific point), but absolutely everything else is consistent with strong demand-side control.
And strong demand-side control more often than not facilitates a price increase.
More often than not – That’s the best I got for you!
(as well as the uptrend here is fine until the Comp closes below the short term uptrend ribbon!).
S&P/ASX 200 (XJO)
%20sub-index%20chart%2030%20May%202025.png)
C’mon XJO…you can do it!!! 📣 (click here for full size image)
You could say I’ve been rather critical of the XJO over the last couple of weeks.
Along the lines of “tin pot”, “just a few banks and mining companies”, “nothing global investors want”, or words to that effect…🥫🍲
But I take it all back now! A tidy little candle today…a nice downward pointing shadow indicating buy the dip activity, a white body, and high close indicating sustained excess demand / likely unrequited demand…and all on a Friday, mind you! 💪
Hey, we only closed 25-odd points to the better – but given the above Comp performance – it’s about as good as we could have hoped for from our little choo-choo train that can! 🚂☁️
I also note that today’s close nudges us closer to dispensing with the 8445 point of supply, and really after 8453 – there’s nothing holding us back until the all time high of 8616.
Like the Comp, the trends, price action, and candles are all solid – no pesky last two black candles for us to deal with!
No, I have a good feeling about us now…it’s going to be onwards an upwards from here…I think I can 🚂☁️, I think I can 🚂☁️, I think I can 🚂☁️…
C’mon XJO…you can do it!!! 📣
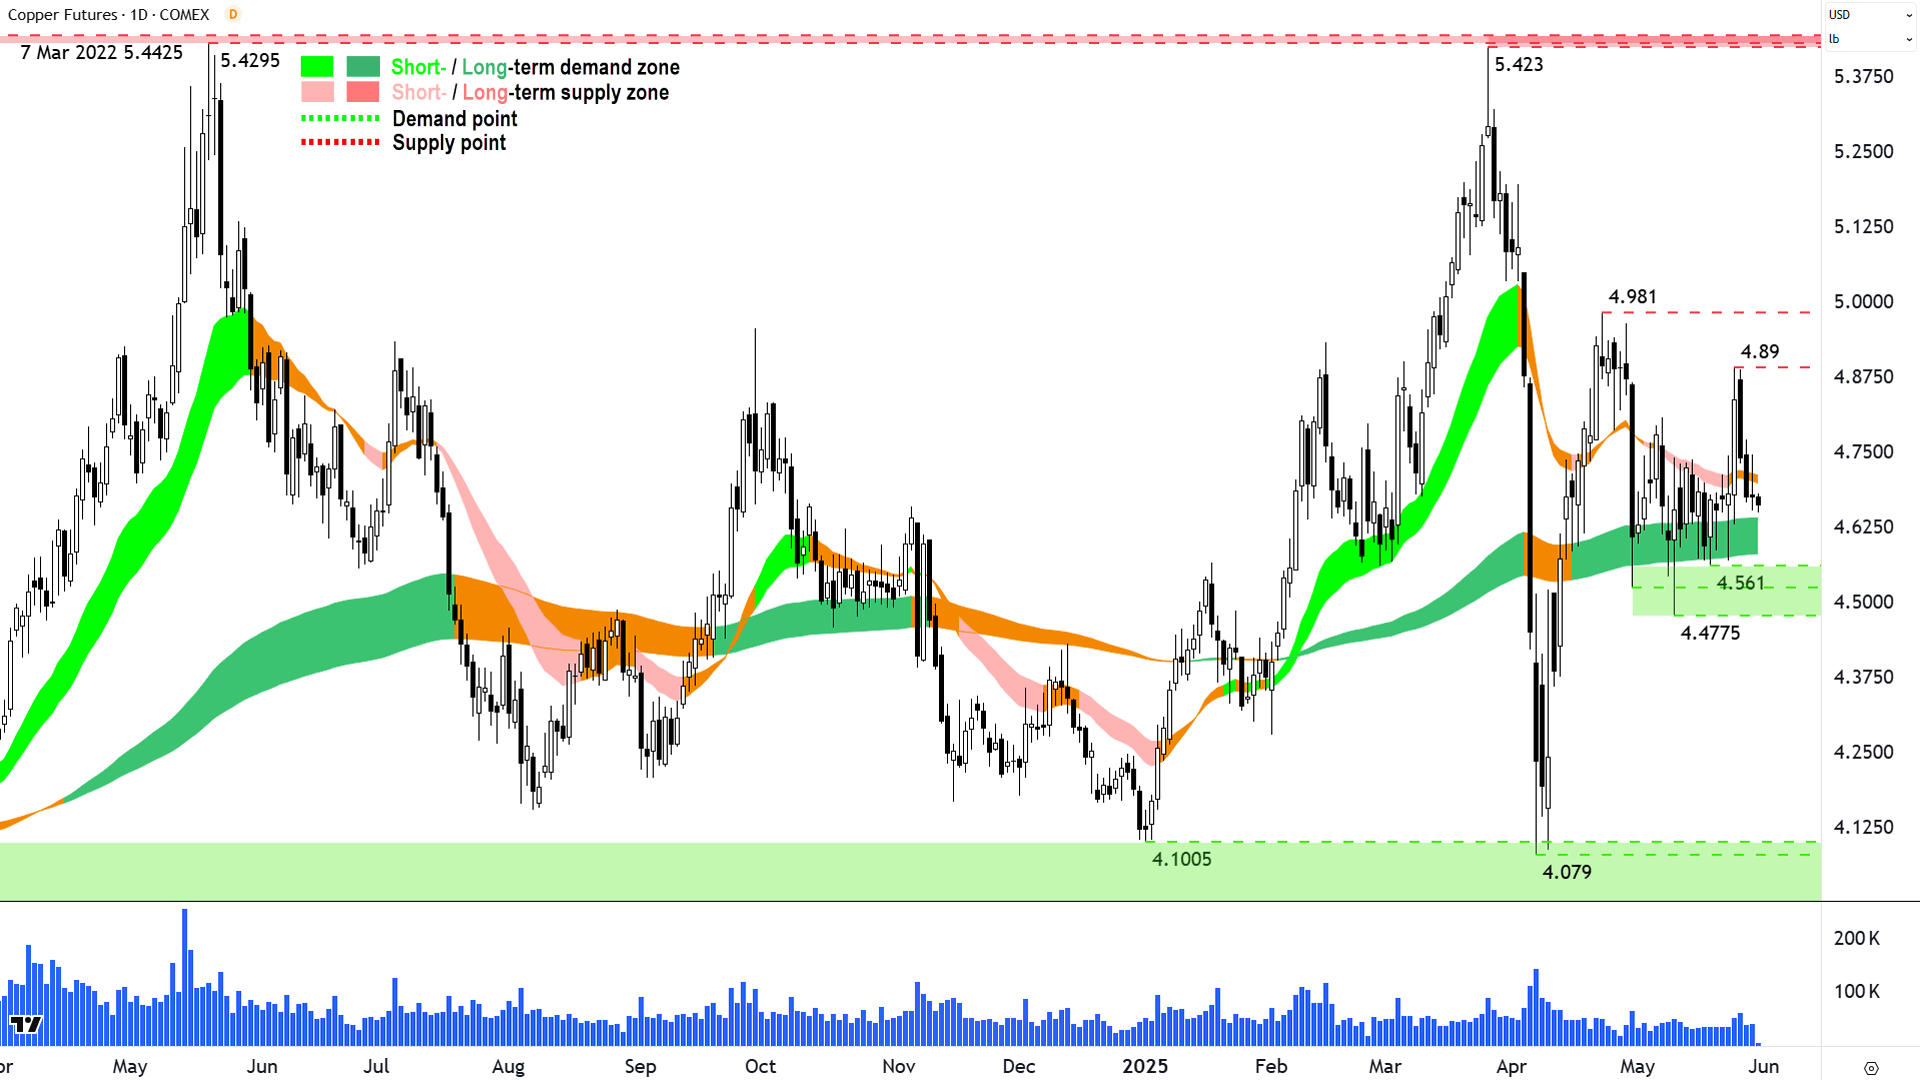
High Grade Copper Futures (Front month, back-adjusted) COMEX
%20COMEX%2030%20May%202025.png)
The fundamentals for copper are neither fantastic nor terrible ⚖️ (click here for full size image)
The last time we covered copper was in ChartWatch in the Evening Wrap on 2 April. Can you believe it’s been that long!?
April 2. Think about that Evening Wrap. It was released just a few hours before President Trump’s fateful Liberation Day trade policy announcement.
A few days before that, I’d already called the top of copper’s last run, noting over a few updates the big supply-side candles on 26-31 March had signalled a change in control from demand-to-supply-side.
I tipped that if copper closed below the short term trend ribbon, then: “it’s far more likely 2025’s big copper adventure is going to go the way of 2024’s.”
Luck, coincidence, or great foresight…it really couldn’t be more irrelevant. When anything closes below the dynamic demand that the short term trend ribbon typically affords it, then it’s rarely a good thing.
But even I couldn’t have imagined the carnage that was in store as markets convulsed in the wake of Trump’s “reciprocal” tariffs announcement.
Of course, as he was forced to back away from full and immediate implementation (remember his pause on 7 April as the bond market was melting down?), copper shot back up again. The telltale lower peak at 4.981 was yet another signal the demand-side had lost control here.
Still, the long term uptrend ribbon continues to stubbornly support copper’s price, and despite another lower peak at 4.89 and evolution of a short term downtrend, it hangs on yet…
I suspect that last pop to 4.89 might have had something to do with this news, it’s just a guess, but good news or not:
The demand-side didn’t have enough motivation and ammunition to penetrate 4.981; and
The supply-side had plenty of motivation and ammunition to repel them from it.
I don’t predict. I basically just tell you what you can see for yourself in the trends, price action, and candles.
And hopefully you can see that we’re roughly at equilibrium here – demand and supply are in a kind of choppy agreement that the fundamentals for copper are neither fantastic nor terrible.
So, we chop sideways around that long term uptrend ribbon. In which case, there’s no point making a call, anyways.
We can make the call (in terms of who has finally grappled control of the price) should copper close above 4.89 at least, but really it must knock off 4.981 (i.e., demand-side control), or if it closes below the long term uptrend ribbon at least, but really it must knock off 4.4775 (i.e. supply-side control).
Economy
Today
AUS Retail Sales April m/m: -0.1% m/m vs +0.3% m/m forecast and +0.3% m/m in March
AUS Building Approvals April m/m: -5.7% m/m vs +0.3% m/m forcast and +0.3% m/m in March
Later this week
Friday
22:30 USA Core PCE Price Index April m/m (+0.1% m/m and +2.6% p.a. vs 0.0% m/m and +2.6% p.a. in March)
Saturday
11:30 CHN Purchasing Managers Index (PMI) May
Manufacturing: 49.5 forecast vs 49.0 in April
Non-Manufacturing: 50.6 forecast vs 50.4 in April
Latest News
Interesting Movers
Trading higher
+13.4% Andean Silver (ASL) – No news since 28-May Exploration Growth Continues at Cerro Bayo, general strength across the broader Precious Metals sector today.
+13.2% Elsight (ELS) – Continued positive response to 29-May Elsight expands European contract to US$9.6M, rise is consistent with prevailing short and long term uptrends, a regular in ChartWatch ASX Scans Uptrends list 🔎📈
+12.1% MTM Critical Metals (MTM) – No news, rise is consistent with prevailing short and long term uptrends, a regular in ChartWatch ASX Scans Uptrends list 🔎📈
+11.2% Catapult Group International (CAT) – Continued positive response to 21-May FY25 Results, rise is consistent with prevailing short and long term uptrends, a regular in ChartWatch ASX Scans Uptrends list 🔎📈
+9.1% Meteoric Resources (MEI) – No news, rise is consistent with prevailing short term uptrend and long term trend is transitioning from down to up 🔎📈
+8.9% Regal Partners (RPL) – 2025 Annual General Meeting Voting Results.
+7.9% Healthco Healthcare and Wellness Reit (HCW) – Healthscope Update.
+7.5% Ora Banda Mining (OBM) – No news, general strength across the broader Gold sector today, rise is consistent with prevailing short and long term uptrends 🔎📈
+7.4% Meeka Metals (MEK) – Murchison Development Update - May 2025, general strength across the broader Gold sector today, rise is consistent with prevailing long term uptrend 🔎📈
+6.8% Silex Systems (SLX) – No news, general strength across the broader Uranium sector today.
+6.1% Southern Cross Gold (SX2) – No news, general strength across the broader Gold sector today, rise is consistent with prevailing short and long term uptrends, a regular in ChartWatch ASX Scans Uptrends list 🔎📈
+5.9% Ramsay Health Care (RHC) – Appointment of Non-Executive Director.
+5.8% Develop Global (DVP) – No news since 29-May Substantial Commencement at Sulphur Springs, rise is consistent with prevailing short and long term uptrends, a regular in ChartWatch ASX Scans Uptrends list 🔎📈
+5.6% West African Resources (WAF) – No news, general strength across the broader Gold sector today, rise is consistent with prevailing short and long term uptrends, a regular in ChartWatch ASX Scans Uptrends list 🔎📈
+5.4% Dateline Resources (DTR) – No news, general strength across the broader Gold sector today, rise is consistent with prevailing short and long term uptrends, a regular in ChartWatch ASX Scans Uptrends list 🔎📈
+5.4% Lotus Resources (LOT) – No news, general strength across the broader Uranium sector today.
+5.3% Fisher & Paykel Healthcare Corporation (FPH) – No news since 28-May Preliminary Final Report, rise is consistent with prevailing long term uptrend 🔎📈
+4.8% Electro Optic Systems (EOS) – No news, rise is consistent with prevailing short term uptrend and long term trend is transitioning from down to up, a recent regular in ChartWatch ASX Scans Uptrends list 🔎📈
Trading lower
-12.0% Coronado Global Resources (CRN) – No news, general weakness across the broader Energy sector today, fall is consistent with prevailing short and long term downtrends, one of the most Featured (highest conviction) stocks in ChartWatch ASX Scans Downtrends list 🔎📉
-9.9% Weebit Nano (WBT) – Weebit Nano Q3 FY25 Activities Report and Appendix 4C.
-8.9% Findi (FND) – FND March 2025 Appendix 4E.
-7.0% Avita Medical (AVH) – No news, fall is consistent with prevailing short and long term downtrends, a regular in ChartWatch ASX Scans Downtrends list 🔎📉
-6.3% 4DS Memory (4DS) – No news, today's move is consistent with recent volatility.
-6.3% Appen (APX) – No news, fall is consistent with prevailing long term downtrend 🔎📉
-5.9% OFX Group (OFX) – No news, fall is consistent with prevailing short and long term downtrends, a regular in ChartWatch ASX Scans Downtrends list 🔎📉
-5.7% Pilbara Minerals (PLS) – No news, general weakness across the broader Battery Materials sector today, fall is consistent with prevailing short and long term downtrends, one of the most Featured (highest conviction) stocks in ChartWatch ASX Scans Downtrends list 🔎📉
-5.6% Novonix (NVX) – No news, general weakness across the broader Battery Materials sector today, fall is consistent with prevailing short and long term downtrends, a regular in ChartWatch ASX Scans Downtrends list 🔎📉
-5.4% IGO (IGO) – No news, general weakness across the broader Battery Materials sector today, fall is consistent with prevailing short and long term downtrends, a regular in ChartWatch ASX Scans Downtrends list 🔎📉
-3.2% Liontown Resources (LTR) – No news, general weakness across the broader Battery Materials sector today, fall is consistent with prevailing short and long term downtrends, a regular in ChartWatch ASX Scans Downtrends list 🔎📉
-3.2% Iluka Resources (ILU) – No news, fall is consistent with prevailing short and long term downtrends, one of the most Featured (highest conviction) stocks in ChartWatch ASX Scans Downtrends list 🔎📉
-3.1% Jumbo Interactive (JIN) – No news, fall is consistent with prevailing short and long term downtrends, a regular in ChartWatch ASX Scans Downtrends list 🔎📉
-3.0% Vulcan Energy Resources (VUL) – No news, general weakness across the broader Battery Materials sector today, fall is consistent with prevailing short and long term downtrends, a regular in ChartWatch ASX Scans Downtrends list 🔎📉
Broker Moves
AI-Media Technologies (AIM)
Retained at add at Morgans; Price Target: $1.000
APA Group (APA)
Retained at outperform at Macquarie; Price Target: $8.14
Aroa Biosurgery (ARX)
Retained at buy at Bell Potter; Price Target: $0.850
Retained at speculative buy at Morgans; Price Target: $0.770 from $0.930
Atturra (ATA)
Retained at add at Morgans; Price Target: $1.000
Boss Energy (BOE)
Retained at buy at Citi; Price Target: $4.60 from $3.30
Catapult Group International (CAT)
Retained at overweight at Morgan Stanley; Price Target: $6.00 from $4.45
Champion Iron (CIA)
Retained at buy at Bell Potter; Price Target: $5.80 from $6.20
Retained at buy at Citi; Price Target: $7.30
Retained at outperform at Macquarie; Price Target: $6.10
Capstone Copper Corp. (CSC)
Retained at outperform at Macquarie; Price Target: $11.60
GQG Partners (GQG)
Retained at add at Morgans; Price Target: $2.65 from $2.63
Hub24 (HUB)
Retained at hold at Morgans; Price Target: $83.10 from $73.80
Ikegps Group (IKE)
Retained at buy at Shaw and Partners; Price Target: $1.200 from $1.100
IPD Group (IPG)
Retained at buy at Bell Potter; Price Target: $4.10 from $4.60
Iress (IRE)
Retained at add at Morgans; Price Target: $10.15 from $10.05
Jumbo Interactive (JIN)
Retained at add at Morgans; Price Target: $11.20 from $13.60
Mineral Resources (MIN)
Retained at neutral at Citi; Price Target: $20.00
Retained at buy at Ord Minnett; Price Target: $31.00 from $32.00
Megaport (MP1)
Retained at add at Morgans; Price Target: $15.50 from $14.00
Medibank Private (MPL)
Retained at neutral at Citi; Price Target: $4.85
Retained at equal-weight at Morgan Stanley; Price Target: $4.50
National Australia Bank (NAB)
Retained at equal-weight at Morgan Stanley; Price Target: $35.00
NIB (NHF)
Retained at neutral at Citi; Price Target: $6.90
Retained at equal-weight at Morgan Stanley; Price Target: $6.65
Netwealth Group (NWL)
Retained at hold at Morgans; Price Target: $31.00 from $29.00
Objective Corporation (OCL)
Retained at hold at Morgans; Price Target: $20.50 from $16.75
Paladin Energy (PDN)
Retained at buy at Citi; Price Target: $10.10 from $10.20
Pinnacle Investment Management Group (PNI)
Retained at add at Morgans; Price Target: $23.80
QBE Insurance Group (QBE)
Retained at equal-weight at Morgan Stanley; Price Target: $24.60
Steadfast Group (SDF)
Retained at equal-weight at Morgan Stanley; Price Target: $6.71
Siteminder (SDR)
Retained at hold at Morgans; Price Target: $4.90 from $6.40
Sandfire Resources (SFR)
Retained at neutral at Macquarie; Price Target: $11.50 from $10.90
Select Harvests (SHV)
Retained at buy at Bell Potter; Price Target: $6.05 from $5.80
Upgraded to outperform from hold at CLSA; Price Target: $5.00 from $4.85
Retained at buy at Ord Minnett; Price Target: $5.65 from $5.60
Santana Minerals (SMI)
Retained at buy at Bell Potter; Price Target: $1.300
Smartpay (SMP)
Retained at buy at Bell Potter; Price Target: $1.300 from $1.330
Suncorp Group (SUN)
Retained at equal-weight at Morgan Stanley; Price Target: $22.75
The Lottery Corporation (TLC)
Downgraded to hold from add at Morgans; Price Target: $5.50 from $5.60
Technology One (TNE)
Retained at hold at Morgans; Price Target: $43.50 from $36.85
TPG Telecom (TPG)
Retained at hold at Morgans; Price Target: $5.00 from $4.70
Westpac Banking Corporation (WBC)
Retained at underweight at Morgan Stanley; Price Target: $27.30
WEB Travel Group (WEB)
Upgraded to buy from neutral at Citi; Price Target: $6.60 from $5.50
Superloop (SLC)
Retained at add at Morgans; Price Target: $3.00 from $2.60
Scans
Top Gainers
Code | Company | Last | % Chg |
|---|---|---|---|
| LOC | Locate Technologies Ltd | $0.115 | +64.29% |
| TAS | Tasman Resources Ltd | $0.025 | +38.89% |
| TRI | Trivarx Ltd | $0.013 | +30.00% |
| ESR | Estrella Resources Ltd | $0.044 | +22.22% |
| NHE | Noble Helium Ltd | $0.011 | +22.22% |
Top Fallers
Code | Company | Last | % Chg |
|---|---|---|---|
| MGA | Metalsgrove Mining Ltd | $0.066 | -18.52% |
| DBO | Diablo Resources Ltd | $0.014 | -17.65% |
| CLE | Cyclone Metals Ltd | $0.056 | -16.42% |
| CML | Connected Minerals Ltd | $0.13 | -16.13% |
| CDX | Cardiex Ltd | $0.042 | -16.00% |
52 Week Highs
Code | Company | Last | % Chg |
|---|---|---|---|
| LOC | Locate Technologies Ltd | $0.115 | +64.29% |
| ESR | Estrella Resources Ltd | $0.044 | +22.22% |
| LKY | Locksley Resources Ltd | $0.08 | +21.21% |
| BNZ | BENZ Mining Corp | $0.47 | +16.05% |
| ELS | Elsight Ltd | $0.77 | +13.24% |
52 Week Lows
Code | Company | Last | % Chg |
|---|---|---|---|
| CDX | Cardiex Ltd | $0.042 | -16.00% |
| T88 | Taiton Resources Ltd | $0.08 | -15.79% |
| SRJ | SRJ Technologies Group Plc | $0.013 | -13.33% |
| CRN | Coronado Global Resources Inc | $0.11 | -12.00% |
| OCT | Octava Minerals Ltd | $0.031 | -11.43% |
Near Highs
Code | Company | Last | % Chg |
|---|---|---|---|
| OZBD | Betashares Australian Composite Bond ETF | $45.11 | +0.29% |
| WVOL | Ishares MSCI World Ex Aust Minimum Volatility ETF | $44.24 | -0.23% |
| AII | Almonty Industries Inc | $2.97 | +2.77% |
| STK | Strickland Metals Ltd | $0.145 | +3.57% |
| IAGPF | Insurance Australia Group Ltd | $104.69 | +0.11% |
Relative Strength Index (RSI) Oversold
Code | Company | Last | % Chg |
|---|---|---|---|
| KMD | KMD Brands Ltd | $0.275 | 0.00% |
| AVH | Avita Medical Inc | $1.86 | -7.00% |
| IPG | Ipd Group Ltd | $3.06 | -2.55% |
| CRN | Coronado Global Resources Inc | $0.11 | -12.00% |
| AOF | Australian Unity Office Fund | $0.475 | 0.00% |
