ChartWatch ASX Scans: It's starting to look a lot like a bull market again with Life360, CAT, MP1, MQG, NWL, SLC, TNE, XRO
Your daily dose of the most interesting uptrends and downtrends on the ASX with technical analysis from an expert.


Source: Shutterstock
Mentioned
KEY POINTS
- Interesting uptrends in today's Scans: Life360 ( 360), Bravura Solutions ( BVS), Catapult International ( CAT), Global Defence ETF ( DFND), Locksley Resources ( LKY), Megaport ( MP1), Native Mineral Resources ( NMR), Technology One ( TNE), Xero ( XRO).
- Interesting downtrends in today's Scans: Collins Foods ( CKF), Coronado Resources ( CRN), Cettire ( CTT), Clarity Pharma ( CU6), Healius ( HLS), Lifestyle Communities ( LIC), Macquarie Technology ( MAQ), Nufarm ( NUF), Novonix ( NVX), Vulcan Energy ( VUL).
Happy birthday ChartWatch ASX Scans! 🎂🥳
This week is Birthday Week for ChartWatch ASX Scans which has just turned 1-year old. Each day this week, we've recapped some of the major hits (i.e., best longs and best shorts) and misses (chop-chop-chop!) in the analysis presented here over the past 12-months.
Today, I'd like to discuss the second of the two major ChartWatch setups, the turnaround setup (yesterday we looked at the other major ChartWatch setup, the continuation setup).
The turnaround setup, as the name suggests, occurs after a long term trend has transitioned from down to up or up to down. It's so early in the new trend, that the long term trend ribbon is likely still neutral. Don't worry if this sounds a little confusing, it'll become clearer with some rules and case studies.
First, the rules. Let's start with a "long" turnaround setup, where we're looking to buy a stock. This occurs when the price of a stock is transitioning from a neutral long term trend to a long term uptrend, from an earlier state of long term downtrend.
Long term trend ribbon is neutral (amber) or up (dark green), i.e., it cannot be down (dark pink)
Short term trend ribbon is up (light green)
Price action is rising peaks and rising troughs
The price has closed above the long term trend ribbon, and has set a trough in or above it
Predominance of demand-side candles (i.e., those with white bodies and or downward pointing shadows)
A strong demand-side candle (i.e., a relatively long demand-side candle)
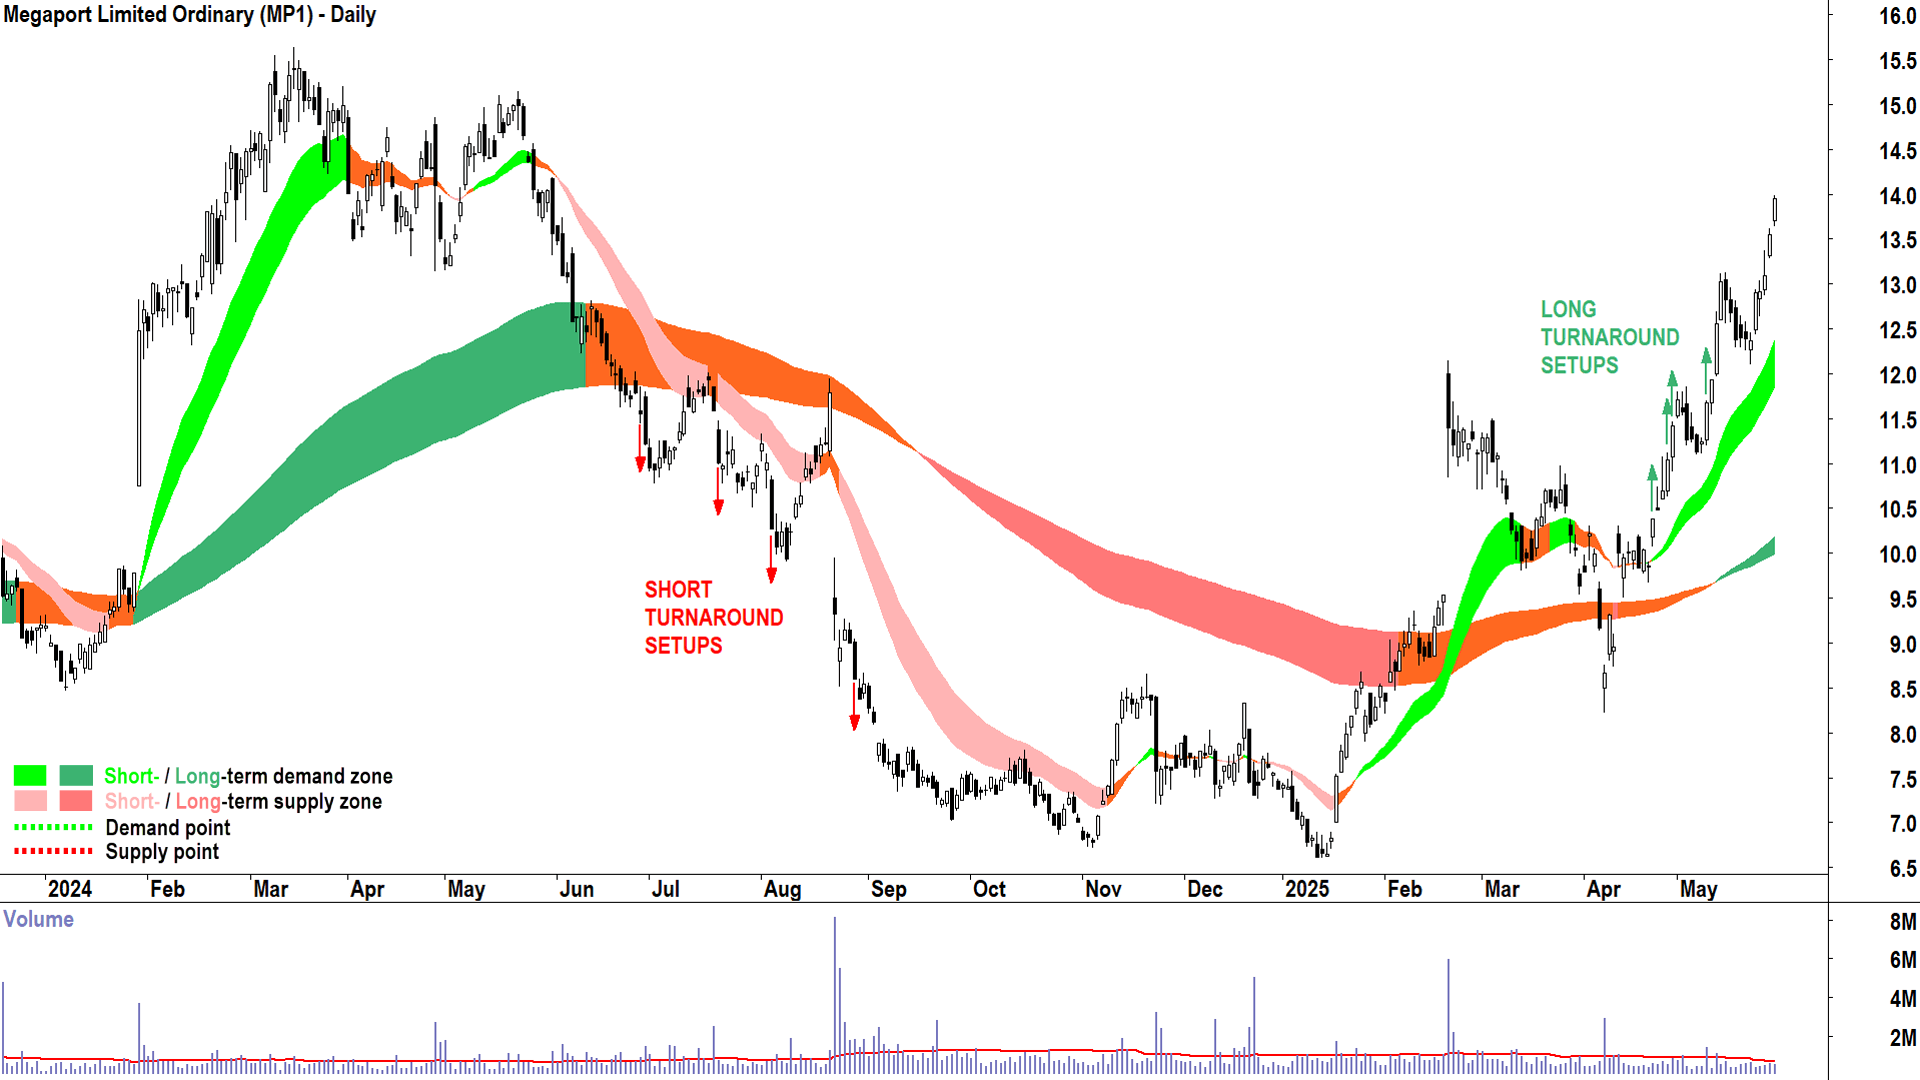
Here's a case study using Megaport (ASX: MP1) showing a few long turnaround setups. Each of the green arrows corresponded with a Feature Uptrend appearance in the relevant edition of ChartWatch ASX Scans. Feature Uptrends are my highest conviction uptrends.
%20chart,%20case%20study%20of%20a%20long%20turnaround%20setup.png)
Megaport (ASX-MP1) chart, case study of a long turnaround setup (click here for full size image)
You might have noticed MP1 is a really great case study because it shows both long and short turnaround setups. Note that each of the red arrows in the MP1 chart corresponded with a Feature Downtrend appearance in the relevant edition of ChartWatch ASX Scans. Feature Downtrends are my highest conviction downtrends.
Let's specifically define my criteria for a "short" turnaround setup now, and remember, when we "go short" we want the price of the stock to go down!
In a short turnaround setup, the price of a stock is transitioning from a neutral long term trend to a long term downtrend, from an earlier state of long term uptrend.
Long term trend ribbon is neutral (amber) or down (dark pink), i.e., it cannot be up (dark green)
Short term trend ribbon is down (light pink)
Price action is falling peaks and falling troughs
The price has closed below the long term trend ribbon, and has set a peak in or below it
Predominance of supply-side candles (i.e., those with black bodies and or upward pointing shadows)
A strong supply-side candle (i.e., a relatively long supply-side candle)
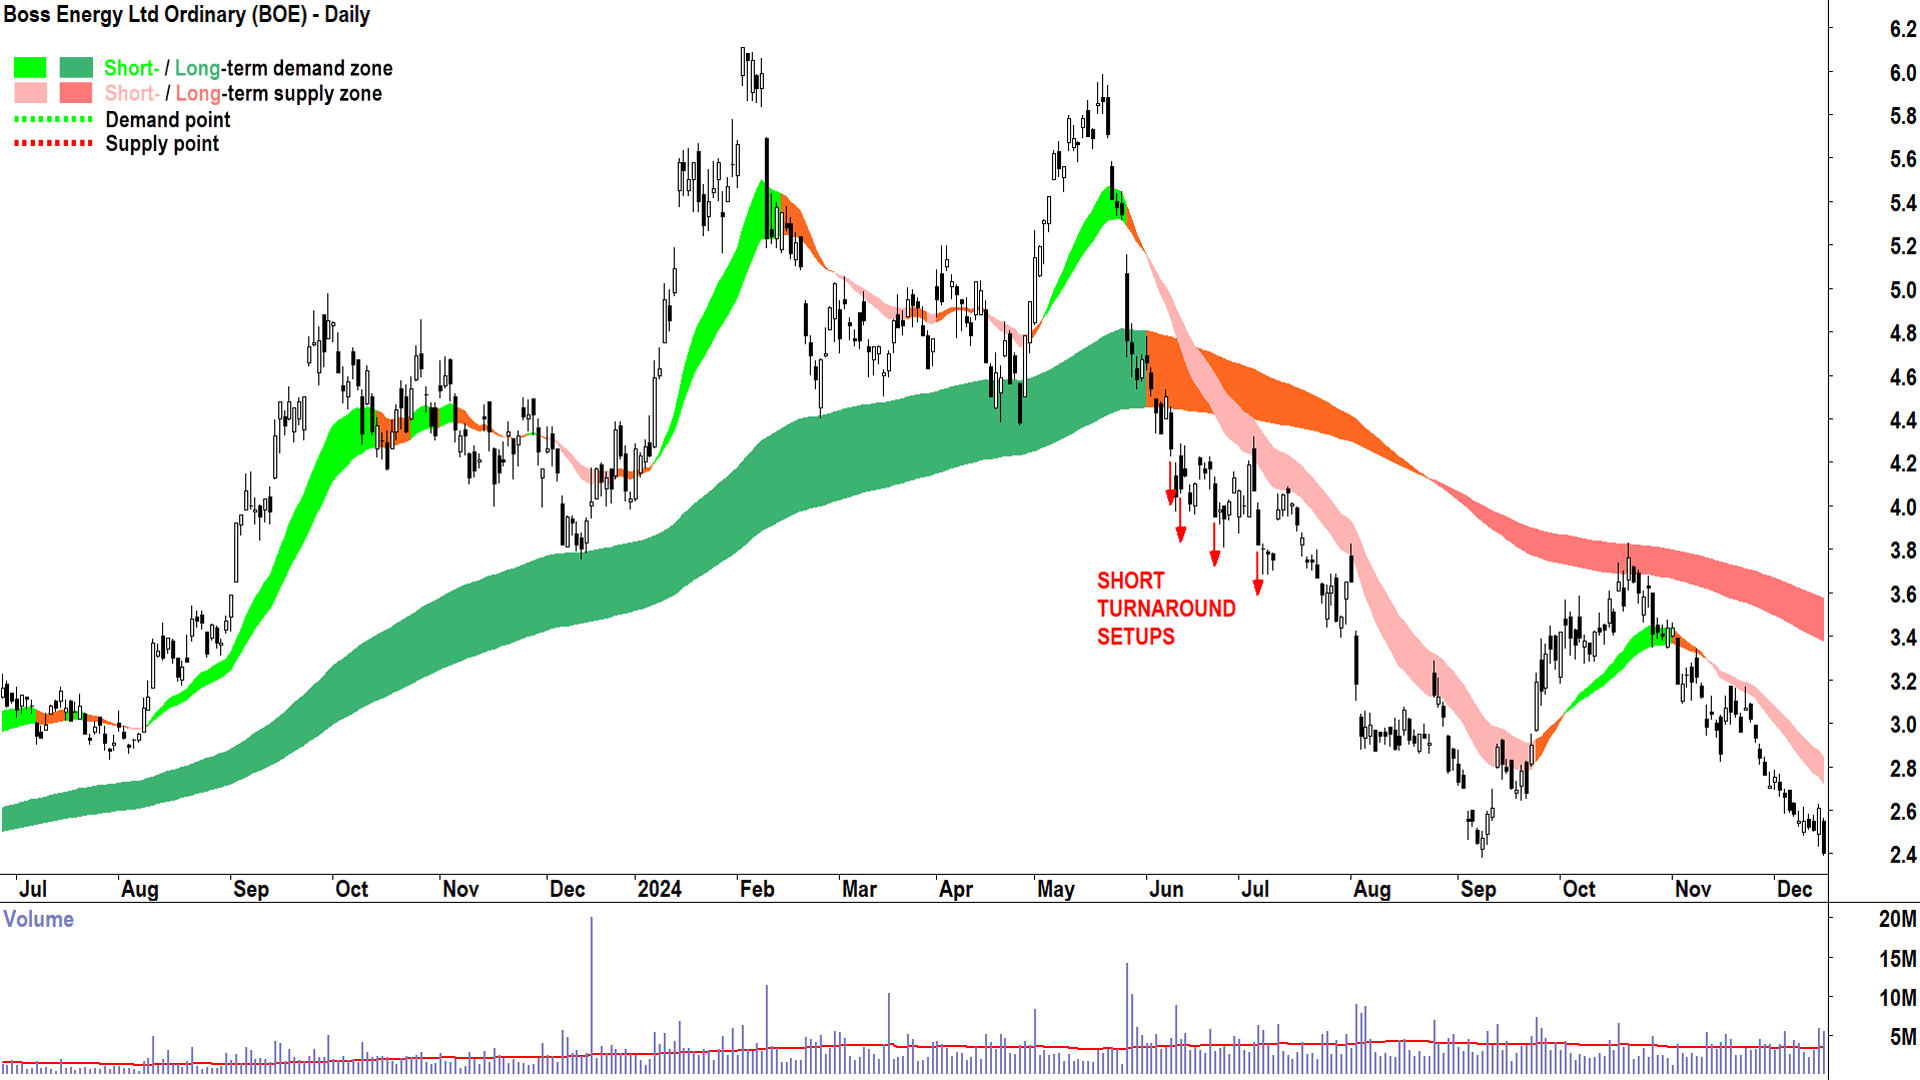
Here's another case study using Boss Energy (ASX: BOE) showing a few more short turnaround setups. Again, each of the red arrows corresponded to a Feature Downtrend appearance in the relevant edition of ChartWatch ASX Scans.
%20chart,%20case%20study%20of%20short%20turnaround%20setup.png)
Boss Energy (ASX-BOE) chart, case study of a short turnaround setup (click here for full size image)
Welcome to my ChartWatch Daily ASX Scans series. Here I present scan lists based on my trend following technical analysis methodology. My goal is to alert you to the best uptrends and downtrends on the ASX.
Feel free to get your favourite AI to convert the tables below into lists you can upload to your favourite trading platform like TradingView. Then you'll be able to skip from chart to chart and quickly and easily see the best uptrends and downtrends on the ASX.
Some investors prefer to buy those stocks in strong uptrends, and avoid, sell, or short sell those stocks in strong downtrends – but how you use the lists is really up to you!
Note, many stocks in both lists have appeared there many times before. As long as they keep meeting my criteria – they'll keep appearing. But note, there won't be any notifications when they don't, so you'll have to do your own research on when a particular trend changes!
Uptrends Scan List
Company | Code | Last Price | 1mo % | 1yr % |
|---|---|---|---|---|
Life360 | 360 | $33.37 | +52.1% | +121.9% |
African Gold | A1G | $0.165 | +32.0% | +396.4% |
Astral Resources | AAR | $0.175 | +9.4% | +116.0% |
Ainsworth Game Technology | AGI | $0.950 | -1.0% | -21.5% |
Antipodes Global Shares ETF | AGX1 | $6.95 | +5.9% | +15.6% |
BetaShares Asia Technology Tigers ETF | ASIA | $11.16 | +9.5% | +23.9% |
Bravura Solutions | BVS | $2.48 | +13.2% | +126.8% |
Catapult Group International | CAT | $5.26 | +28.6% | +235.0% |
Vaneck Global Defence ETF | DFND | $34.45 | +11.2% | 0% |
Dateline Resources | DTR | $0.092 | +820.0% | +557.1% |
EDU | EDU | $0.280 | +93.1% | +86.7% |
Emerald Resources | EMR | $4.59 | +14.5% | +21.1% |
Energy One | EOL | $14.96 | +19.2% | +256.2% |
Electro Optic Systems | EOS | $1.760 | +43.7% | +27.1% |
Eroad | ERD | $1.350 | +60.7% | +75.3% |
Evolution Mining | EVN | $8.86 | +13.2% | +125.4% |
EVT | EVT | $16.20 | +14.7% | +34.4% |
Global X Fang+ ETF | FANG | $33.92 | +14.6% | +30.8% |
Firefly Metals | FFM | $1.070 | +33.8% | +39.0% |
Genesis Minerals | GMD | $4.52 | +17.1% | +143.7% |
Global X Artificial Intelligence ETF | GXAI | $12.57 | +12.2% | +24.2% |
BetaShares Global Cybersecurity ETF | HACK | $15.38 | +9.5% | +33.3% |
iShares MSCI Emerging Markets ETF | IEM | $72.43 | +5.6% | +11.9% |
iShares MSCI South Korea ETF | IKO | $98.81 | +9.1% | -1.4% |
Jupiter Mines | JMS | $0.205 | +36.7% | -34.9% |
Kingsgate Consolidated | KCN | $2.05 | +22.0% | +14.5% |
L1 Capital International Fund ETF | L1IF | $6.85 | +7.5% | +19.3% |
Locksley Resources | LKY | $0.066 | +288.2% | +88.6% |
Loftus Peak Global Disruption Fund ETF | LPGD | $5.48 | +13.0% | +20.4% |
Munro Global Growth Fund ETF | MAET | $7.00 | +9.2% | +12.0% |
Megaport | MP1 | $13.95 | +22.2% | -0.7% |
Macquarie Group | MQG | $213.61 | +10.4% | +10.3% |
Native Mineral Resources | NMR | $0.195 | +5.4% | +875.0% |
Northern Star Resources | NST | $20.33 | +6.0% | +40.5% |
Netwealth Group | NWL | $31.77 | +13.4% | +56.0% |
News Corporation | NWS | $51.85 | +5.0% | +24.5% |
Nexgen Energy | NXG | $10.08 | +21.3% | -13.7% |
Objective Corporation | OCL | $18.98 | +21.3% | +52.6% |
Ophir High Conviction Fund | OPH | $3.16 | +11.3% | +17.9% |
Plato Global Alpha Fund Complex Etf | PGA1 | $11.68 | +9.4% | 0% |
Regis Healthcare | REG | $8.02 | +17.8% | +104.1% |
Ramelius Resources | RMS | $2.83 | +7.6% | +38.0% |
Global X Robo Global Robotics & Automation ETF | ROBO | $78.85 | +13.0% | +5.6% |
St Barbara | SBM | $0.320 | +10.3% | +12.3% |
Superloop | SLC | $2.70 | +8.0% | +88.2% |
Spartan Resources | SPR | $2.20 | +8.4% | +205.6% |
Servcorp | SRV | $5.49 | +8.9% | +36.9% |
Strickland Metals | STK | $0.140 | +53.8% | +27.3% |
Southern Cross Gold | SX2 | $6.10 | +8.9% | 0% |
Global X Morningstar Global Technology ETF | TECH | $113.78 | +12.5% | +10.3% |
Technology One | TNE | $40.77 | +35.6% | +128.9% |
Temple & Webster Group | TPW | $21.90 | +23.0% | +122.8% |
Unibail-Rodamco-Westfield | URW | $7.30 | +11.1% | +12.8% |
Vanguard MSCI Index International Shares (Hedged) ETF | VGAD | $109.09 | +7.7% | +6.1% |
Vanguard MSCI International Small Companies Index ETF | VISM | $68.57 | +7.2% | +8.9% |
Global X Copper Miners ETF | WIRE | $13.10 | +7.7% | -12.4% |
Xero | XRO | $185.75 | +13.1% | +38.5% |
Today's Uptrends Scan List
Feature Charts from today's Uptrends List 🔎📈
The stocks that I feel are showing the strongest excess demand from today's Uptrends List are: Life360 (ASX: 360), Bravura Solutions (ASX: BVS), Catapult Group International (ASX: CAT), Vaneck Global Defence ETF (ASX: DFND), Energy One (ASX: EOL), EVT (ASX: EVT), BetaShares Global Cybersecurity ETF (ASX: HACK), Locksley Resources (ASX: LKY), Megaport (ASX: MP1), Native Mineral Resources (ASX: NMR), Netwealth Group (ASX: NWL), Ophir High Conviction Fund (ASX: OPH), Regis Healthcare (ASX: REG), Global X Robo Global Robotics & Automation ETF (ASX: ROBO), Superloop (ASX: SLC), Strickland Metals (ASX: STK), Southern Cross Gold (ASX: SX2), Technology One (ASX: TNE), Temple & Webster Group (ASX: TPW), Unibail-Rodamco-Westfield (ASX: URW), Vanguard MSCI International Small Companies Index ETF (ASX: VISM), Xero (ASX: XRO).
Charts of each below:
%20daily%20chart%2029%20May%202025.png)
%20daily%20chart%2029%20May%202025.png)
%20daily%20chart%2029%20May%202025.png)
%20daily%20chart%2029%20May%202025.png)
%20daily%20chart%2029%20May%202025.png)
%20daily%20chart%2029%20May%202025.png)
%20daily%20chart%2029%20May%202025.png)
%20daily%20chart%2029%20May%202025.png)
%20daily%20chart%2029%20May%202025.png)
%20daily%20chart%2029%20May%202025.png)
%20daily%20chart%2029%20May%202025.png)
%20daily%20chart%2029%20May%202025.png)
%20daily%20chart%2029%20May%202025.png)
%20daily%20chart%2029%20May%202025.png)
%20daily%20chart%2029%20May%202025.png)
%20daily%20chart%2029%20May%202025.png)
%20daily%20chart%2029%20May%202025.png)
%20daily%20chart%2029%20May%202025.png)
%20daily%20chart%2029%20May%202025.png)
%20daily%20chart%2029%20May%202025.png)
%20daily%20chart%2029%20May%202025.png)
%20daily%20chart%2029%20May%202025.png)
Downtrends Scan List
Company | Code | Last Price | 1mo % | 1yr % |
|---|---|---|---|---|
Australian Clinical Labs | ACL | $2.92 | -6.4% | +32.1% |
Champion Iron | CIA | $4.27 | -6.6% | -42.0% |
Collins Foods | CKF | $7.87 | -4.5% | -17.0% |
Coronado Global Resources | CRN | $0.125 | -35.9% | -88.8% |
Cettire | CTT | $0.405 | -10.0% | -84.5% |
Clarity Pharmaceuticals | CU6 | $2.16 | -1.8% | -51.6% |
Dexus | DXS | $6.98 | -7.2% | +1.5% |
Healius | HLS | $0.880 | -17.4% | -7.5% |
Lifestyle Communities | LIC | $7.01 | -2.1% | -44.9% |
Macquarie Technology Group | MAQ | $59.50 | +0.4% | -30.3% |
Nufarm | NUF | $2.34 | -39.2% | -48.7% |
Novonix | NVX | $0.445 | +4.7% | -46.1% |
Patriot Battery Metals | PMT | $0.235 | -14.5% | -73.1% |
Smartgroup Corporation | SIQ | $7.29 | -6.8% | -13.3% |
Skycity Entertainment Group | SKC | $0.865 | -18.4% | -47.3% |
Vulcan Steel | VSL | $6.41 | -13.0% | -11.1% |
Vulcan Energy Resources | VUL | $4.00 | -17.5% | -27.8% |
Today's Downtrends Scan List
Feature Charts from today's Downtrends List 🔎📉
The stocks that I feel are showing the strongest excess supply from today's Downtrends List are: Collins Foods (ASX: CKF), Coronado Global Resources (ASX: CRN), Cettire (ASX: CTT), Clarity Pharmaceuticals (ASX: CU6), Healius (ASX: HLS), Lifestyle Communities (ASX: LIC), Macquarie Technology Group (ASX: MAQ), Nufarm (ASX: NUF), Novonix (ASX: NVX), Smartgroup Corporation (ASX: SIQ), Skycity Entertainment Group (ASX: SKC), Vulcan Steel (ASX: VSL), Vulcan Energy Resources (ASX: VUL).
Charts of each below:
%20daily%20chart%2029%20May%202025.png)
%20daily%20chart%2029%20May%202025.png)
%20daily%20chart%2029%20May%202025.png)
%20daily%20chart%2029%20May%202025.png)
%20daily%20chart%2029%20May%202025.png)
%20daily%20chart%2029%20May%202025.png)
%20daily%20chart%2029%20May%202025.png)
%20daily%20chart%2029%20May%202025.png)
%20daily%20chart%2029%20May%202025.png)
%20daily%20chart%2029%20May%202025.png)
%20daily%20chart%2029%20May%202025.png)
%20daily%20chart%2029%20May%202025.png)
%20daily%20chart%2029%20May%202025.png)
Important considerations when using the ChartWatch Daily ASX Scans:
1. The future is unknown. Anything can happen to change the trends in the lists above. A stock in a perfect uptrend or downtrend may not remain that way by the close of trading today. 2. These lists are not exhaustive, they are curated by Carl. You will find that certain stocks might not appear in a particular list on consecutive days but might reappear when Carl feels it deserves to return to the list. 3. This is not a recommendation service, merely an aid to help you better understand the workings of Carl’s technical analysis model in a practical way. Carl will not alert you to stocks that have dropped off a list because their trend has changed – it is up to you to apply the criteria to determine why a particular stock might not still be included. 4. This is general, educational information only – always do your own research.
