ChartWatch ASX Scans: Blue chip bonanza, CBA, NAB, XRO, BXB, QAN, QBE, WES, PME, RMD, LOV
Your daily dose of the most interesting uptrends and downtrends on the ASX with technical analysis from an expert.


Source: Shutterstock
Mentioned
Happy birthday ChartWatch ASX Scans! 🎂🥳
This week is Birthday Week for ChartWatch ASX Scans, which turned 1 on Friday.
On Monday, I recapped the best performing uptrends as picked here, and yesterday I recapped the best performing downtrends. Nailed it, and um, nailed it 💯!
But no system – technical analysis derived or otherwise – gets it right all the time. As a trend follower, I aim to identify and follow the strongest trends, but I have no idea what the outcome of my calls will be. Why? 🤔
How can I? The future is unknown 🔮. Not every trend continues after it’s identified here, not even the highest conviction Feature trends.
Today I wanted to discuss two stocks that I feel I was rarely on the right side of over the last 12 months. When you see their charts, you’ll understand why! 🤦
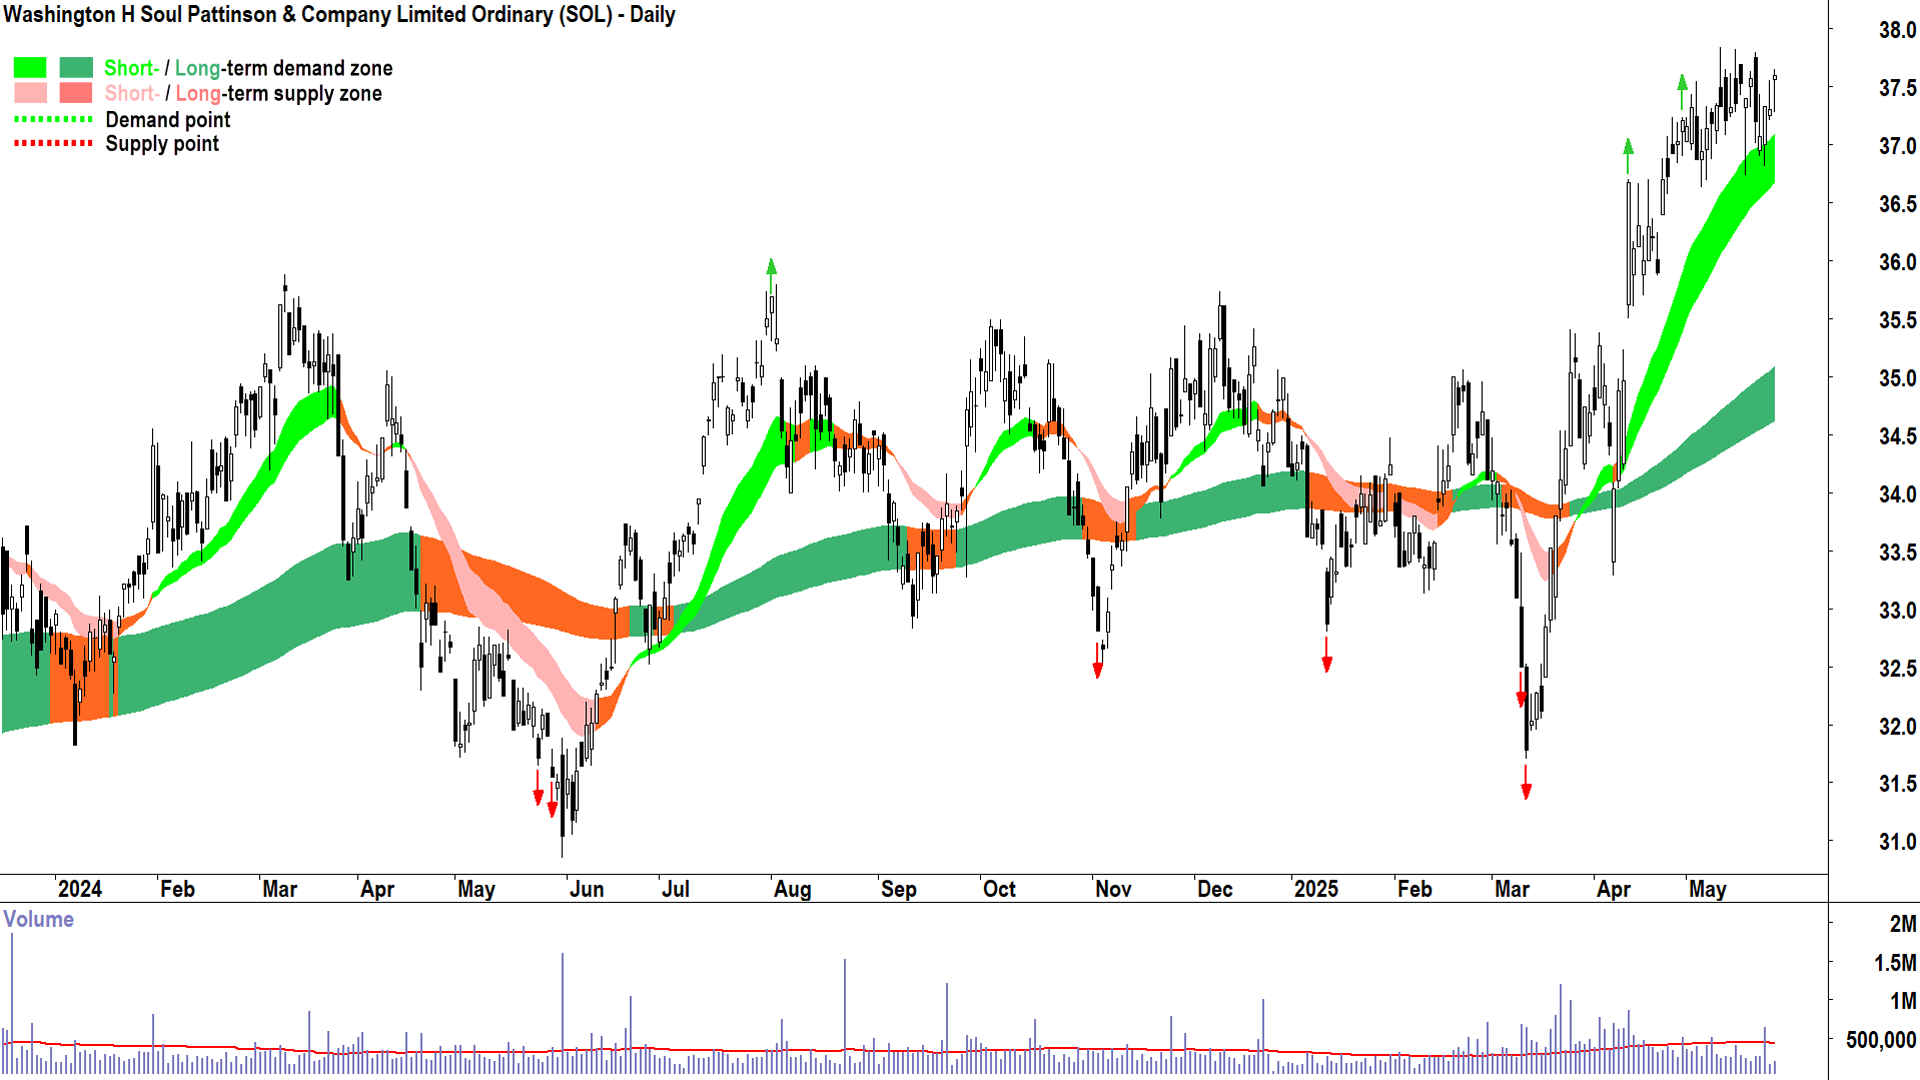
1. Washington H Soul Pattinson & Company (ASX-SOL)
I couldn't have gotten this stock any more wrong, although, I hope with the last couple of long-side entries I may be able to make amends! But just look at those first 7 short and long calls – almost perfectly at the exact wrong time.
.png)
Washington H Soul Pattinson & Company (ASX-SOL) (click here for full size image)
In my defence, look closely at the SOL chart. It’s a series of sharp Vs and As – chop, chop, chop! Each time I thought a new trend had established itself, the price turned on a dime and went back the other way just enough to signal a new trend in the opposite direction!
There’s an old saying in trend trading: In choppy markets, trend trades get chopped up! 🪓
I certainly got chopped up by going back to the SOL well these last 12-months! 😭
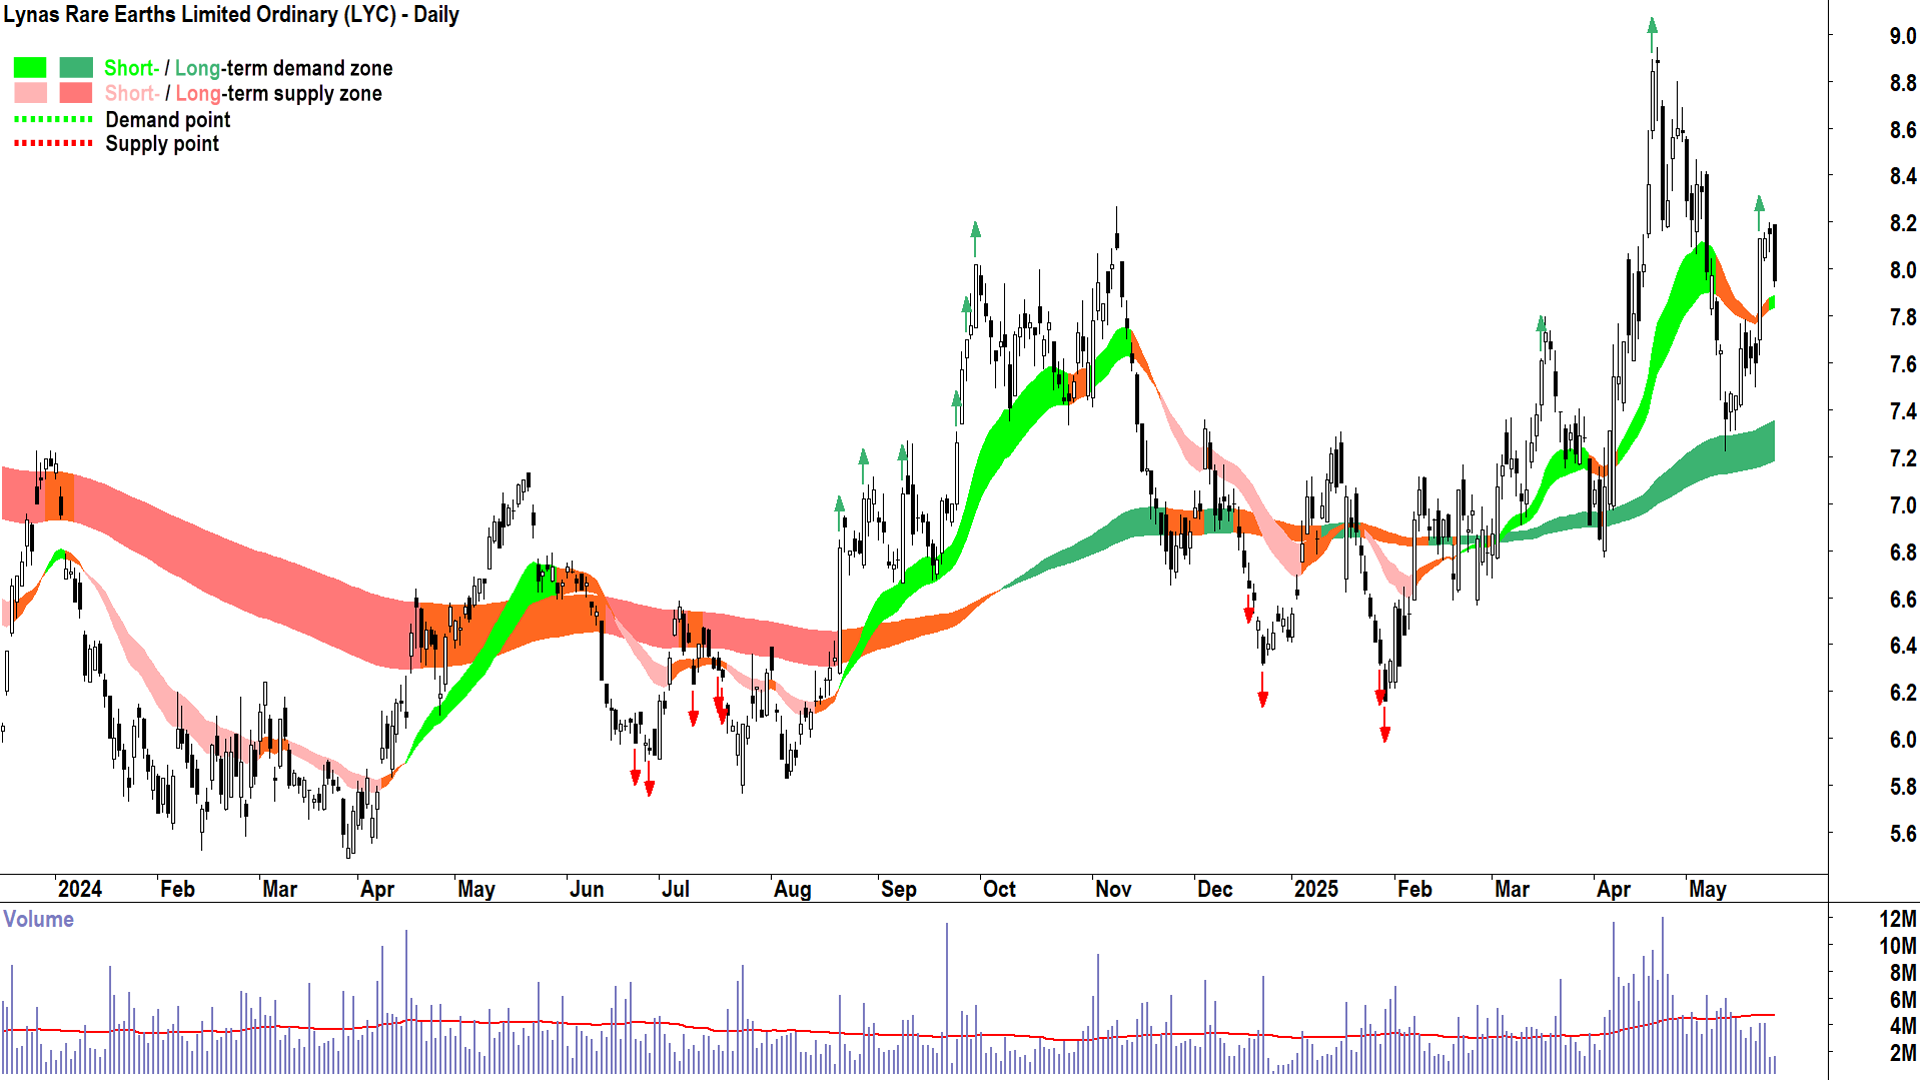
2. Lynas Rare Earths (ASX-LYC)
This is another choppy chart that springs to mind when I think about my worst calls over the last 12-months. Over that time, LYC made Feature Downtrend and Feature Uptrend 9 times each! As you can see on the chart below, the timing on most those calls was terrible.
.png)
Lynas Rare Earths (ASX-LYC) (click here for full size image)
Traders should always analyse their worst trades on a periodic basis. This is how you spot potential weaknesses in your strategy. The lesson I takeaway from the SOL and LYC charts is to refrain from jumping into trends too early, particularly those that are chopping above and below their long term trend ribbons 🚫.
Welcome to my ChartWatch Daily ASX Scans series. Here I present scan lists based on my trend following technical analysis methodology. My goal is to alert you to the best uptrends and downtrends on the ASX.
Feel free to get your favourite AI to convert the tables below into lists you can upload to your favourite trading platform like TradingView. Then you'll be able to skip from chart to chart and quickly and easily see the best uptrends and downtrends on the ASX.
Some investors prefer to buy those stocks in strong uptrends, and avoid, sell, or short sell those stocks in strong downtrends – but how you use the lists is really up to you!
Note, many stocks in both lists have appeared there many times before. As long as they keep meeting my criteria – they'll keep appearing. But note, there won't be any notifications when they don't, so you'll have to do your own research on when a particular trend changes!
Uptrends Scan List
Company | Code | Last Price | 1mo % | 1yr % |
|---|---|---|---|---|
Life360 | 360 | $32.28 | +56.3% | +104.0% |
Adriatic Metals | ADT | $5.15 | +30.7% | +8.4% |
Australian Finance Group | AFG | $2.18 | +23.9% | +55.2% |
Antipodes Global Shares ETF | AGX1 | $6.88 | +5.5% | +12.6% |
Almonty Industries | AII | $2.80 | +6.1% | +378.6% |
AMA Group | AMA | $0.096 | +50.0% | +119.1% |
BetaShares Australian Quality ETF | AQLT | $32.47 | +8.6% | +14.1% |
BetaShares Global Defence ETF | ARMR | $22.51 | +9.7% | 0% |
Austal | ASB | $5.29 | +1.3% | +117.7% |
AUB Group | AUB | $35.12 | +11.0% | +15.1% |
Aurum Resources | AUE | $0.505 | +44.3% | +55.4% |
Bluebet | BBT | $0.390 | +23.8% | +66.0% |
Bendigo and Adelaide Bank | BEN | $11.95 | +7.8% | +8.7% |
Barton Gold | BGD | $0.780 | +81.4% | +136.4% |
Bank of Queensland | BOQ | $7.74 | +4.3% | +32.3% |
Bravura Solutions | BVS | $2.29 | +15.7% | +106.0% |
Brambles | BXB | $22.81 | +15.0% | +58.5% |
Commonwealth Bank of Australia | CBA | $175.34 | +7.7% | +45.2% |
Cobram Estate Olives | CBO | $2.04 | +10.3% | +14.6% |
Cash Converters International | CCV | $0.275 | +14.6% | +31.0% |
Dalrymple Bay Infrastructure/Notes | DBI | $4.16 | +5.9% | +40.1% |
EDU | EDU | $0.200 | +42.9% | +33.3% |
EML Payments | EML | $1.035 | +12.5% | +4.0% |
EVT | EVT | $15.54 | +14.3% | +29.3% |
Fisher & Paykel Healthcare Corporation | FPH | $34.12 | +6.7% | +31.0% |
Firetrail Aust Small Companies Fund ETF | FSML | $1.850 | +10.1% | 0% |
BetaShares Geared Australian Equity Fund ETF | GEAR | $33.02 | +12.9% | +15.0% |
iShares Core MSCI Australia ESG ETF | IESG | $32.11 | +6.7% | +11.3% |
Iperionx | IPX | $3.90 | +19.6% | +80.6% |
Lindian Resources | LIN | $0.130 | +18.2% | +8.3% |
Lovisa | LOV | $29.14 | +20.9% | -10.1% |
National Australia Bank | NAB | $37.75 | +5.7% | +9.7% |
Neuren Pharmaceuticals | NEU | $14.05 | +27.8% | -33.4% |
Netwealth Group | NWL | $31.07 | +16.8% | +52.9% |
OOH!Media | OML | $1.695 | +14.5% | +13.0% |
Orica | ORI | $18.69 | +16.4% | 0% |
Pro Medicus | PME | $278.59 | +27.4% | +141.1% |
Peet | PPC | $1.660 | +16.9% | +38.9% |
Peak Minerals | PUA | $0.021 | +110.0% | +771.2% |
Qantas Airways | QAN | $10.41 | +20.6% | +70.7% |
QBE Insurance Group | QBE | $23.75 | +10.6% | +31.6% |
Resmed Inc | RMD | $38.13 | +3.2% | +16.1% |
Sigma Healthcare | SIG | $3.17 | +5.3% | +153.6% |
SRG Global | SRG | $1.490 | +15.1% | +66.5% |
Suncorp Group | SUN | $20.85 | +5.9% | +31.3% |
Turaco Gold | TCG | $0.470 | +16.0% | +108.9% |
Telstra Group | TLS | $4.75 | +6.0% | +37.3% |
Temple & Webster Group | TPW | $20.70 | +19.6% | +108.0% |
Unibail-Rodamco-Westfield | URW | $7.01 | +7.8% | +8.2% |
Vanguard Ethically Conscious Australian ETF | VETH | $69.08 | +6.0% | +12.5% |
Wesfarmers | WES | $82.90 | +7.9% | +25.0% |
WIA Gold | WIA | $0.235 | +23.7% | +91.8% |
Xero | XRO | $183.57 | +15.1% | +36.1% |
Today's Uptrends Scan List
Feature Charts from today's Uptrends List 🔎📈
The stocks that I feel are showing the strongest excess demand from today's Uptrends List are: Life360 (ASX: 360), Adriatic Metals (ASX: ADT), Australian Finance Group (ASX: AFG), AMA Group (ASX: AMA), Barton Gold (ASX: BGD), Bravura Solutions (ASX: BVS), Brambles (ASX: BXB), Commonwealth Bank of Australia (ASX: CBA), Cash Converters International (ASX: CCV), Iperionx (ASX: IPX), Lindian Resources (ASX: LIN), Lovisa (ASX: LOV), Qantas Airways (ASX: QAN), QBE Insurance Group (ASX: QBE), Turaco Gold (ASX: TCG), Temple & Webster Group (ASX: TPW), Unibail-Rodamco-Westfield (ASX: URW), Xero (ASX: XRO).
Charts of each below:
%20daily%20chart%2027%20May%202025.png)
%20daily%20chart%2027%20May%202025.png)
%20daily%20chart%2027%20May%202025.png)
%20daily%20chart%2027%20May%202025.png)
%20daily%20chart%2027%20May%202025.png)
%20daily%20chart%2027%20May%202025.png)
%20daily%20chart%2027%20May%202025.png)
%20daily%20chart%2027%20May%202025.png)
%20daily%20chart%2027%20May%202025.png)
%20daily%20chart%2027%20May%202025.png)
%20daily%20chart%2027%20May%202025.png)
%20daily%20chart%2027%20May%202025.png)
%20daily%20chart%2027%20May%202025.png)
%20daily%20chart%2027%20May%202025.png)
%20daily%20chart%2027%20May%202025.png)
%20daily%20chart%2027%20May%202025.png)
%20daily%20chart%2027%20May%202025.png)
%20daily%20chart%2027%20May%202025.png)
Downtrends Scan List
Company | Code | Last Price | 1mo % | 1yr % |
|---|---|---|---|---|
Australian Clinical Labs | ACL | $2.93 | -3.3% | +32.6% |
Amotiv | AOV | $7.77 | +1.7% | -27.5% |
Avita Medical | AVH | $1.950 | -35.6% | -26.7% |
Helloworld Travel | HLO | $1.455 | +1.0% | -37.3% |
Healius | HLS | $0.885 | -13.6% | -8.0% |
Nufarm | NUF | $2.36 | -39.3% | -50.1% |
Pilbara Minerals | PLS | $1.340 | -7.6% | -66.5% |
Skycity Entertainment Group | SKC | $0.875 | -17.8% | -45.8% |
Vulcan Energy Resources | VUL | $4.07 | -14.3% | -20.2% |
Today's Downtrends Scan List
Feature Charts from today's Downtrends List 🔎📉
The stocks that I feel are showing the strongest excess supply from today's Downtrends List are: Avita Medical (ASX: AVH), Healius (ASX: HLS), Nufarm (ASX: NUF), Pilbara Minerals (ASX: PLS).
Charts of each below:
%20daily%20chart%2027%20May%202025.png)
%20daily%20chart%2027%20May%202025.png)
%20daily%20chart%2027%20May%202025.png)
%20daily%20chart%2027%20May%202025.png)
Important considerations when using the ChartWatch Daily ASX Scans:
1. The future is unknown. Anything can happen to change the trends in the lists above. A stock in a perfect uptrend or downtrend may not remain that way by the close of trading today. 2. These lists are not exhaustive, they are curated by Carl. You will find that certain stocks might not appear in a particular list on consecutive days but might reappear when Carl feels it deserves to return to the list. 3. This is not a recommendation service, merely an aid to help you better understand the workings of Carl’s technical analysis model in a practical way. Carl will not alert you to stocks that have dropped off a list because their trend has changed – it is up to you to apply the criteria to determine why a particular stock might not still be included. 4. This is general, educational information only – always do your own research.
