ChartWatch ASX Scans: FMG in trouble with ILU, LIC, LTR and TWE, as investors pivot to big tech TNE, MP1 and FANG
Your daily dose of the most interesting uptrends and downtrends on the ASX with technical analysis from an expert.


Source: Shutterstock
Mentioned
KEY POINTS
- Interesting uptrends in today's Scans: Bank of Queensland (BOQ), Dateline Resources (DTR), EML Payments (EML), EVT (EVT), Goodman (GMG), Lindian Resources (LIN), Megaport (MP1), Native Mineral Resources (NMR), Turaco Gold (TCG), Temple & Webster (TPW).
- Interesting downtrends in today's Scans: Cettire (CTT), Elders (ELD), Humm Group (HUM), IDP Education (IEL), Iluka Resources (ILU), Jumbo Interactive (JIN), Kogan.Com (KGN), Redox (RDX), Treasury Wine Estates (TWE).
Happy birthday ChartWatch ASX Scans! 🎂🥳
This week is Birthday Week for ChartWatch ASX Scans which has just turned 1-year old. Each day this week, we've recapped some of the major hits (i.e., best longs and shorts) and misses (chop-chop-chop!) in the analysis presented here over the past 12-months.
Today, I'd like to look one of the two major ChartWatch setups, the continuation setup. Tomorrow, in the final Birthday Week edition, we'll look at the second major setup, the turnaround setup.
The continuation setup, as the name suggests, occurs in a continuing trend. This could be either up or down. A "long" continuation setup occurs in a well established long term uptrend. It's important to distinguish between "long" as in "expecting the price to rise", and "long" as in how long a trend has been in place (i.e. for the "long term").
%20chart%2018%20June%202024.png)
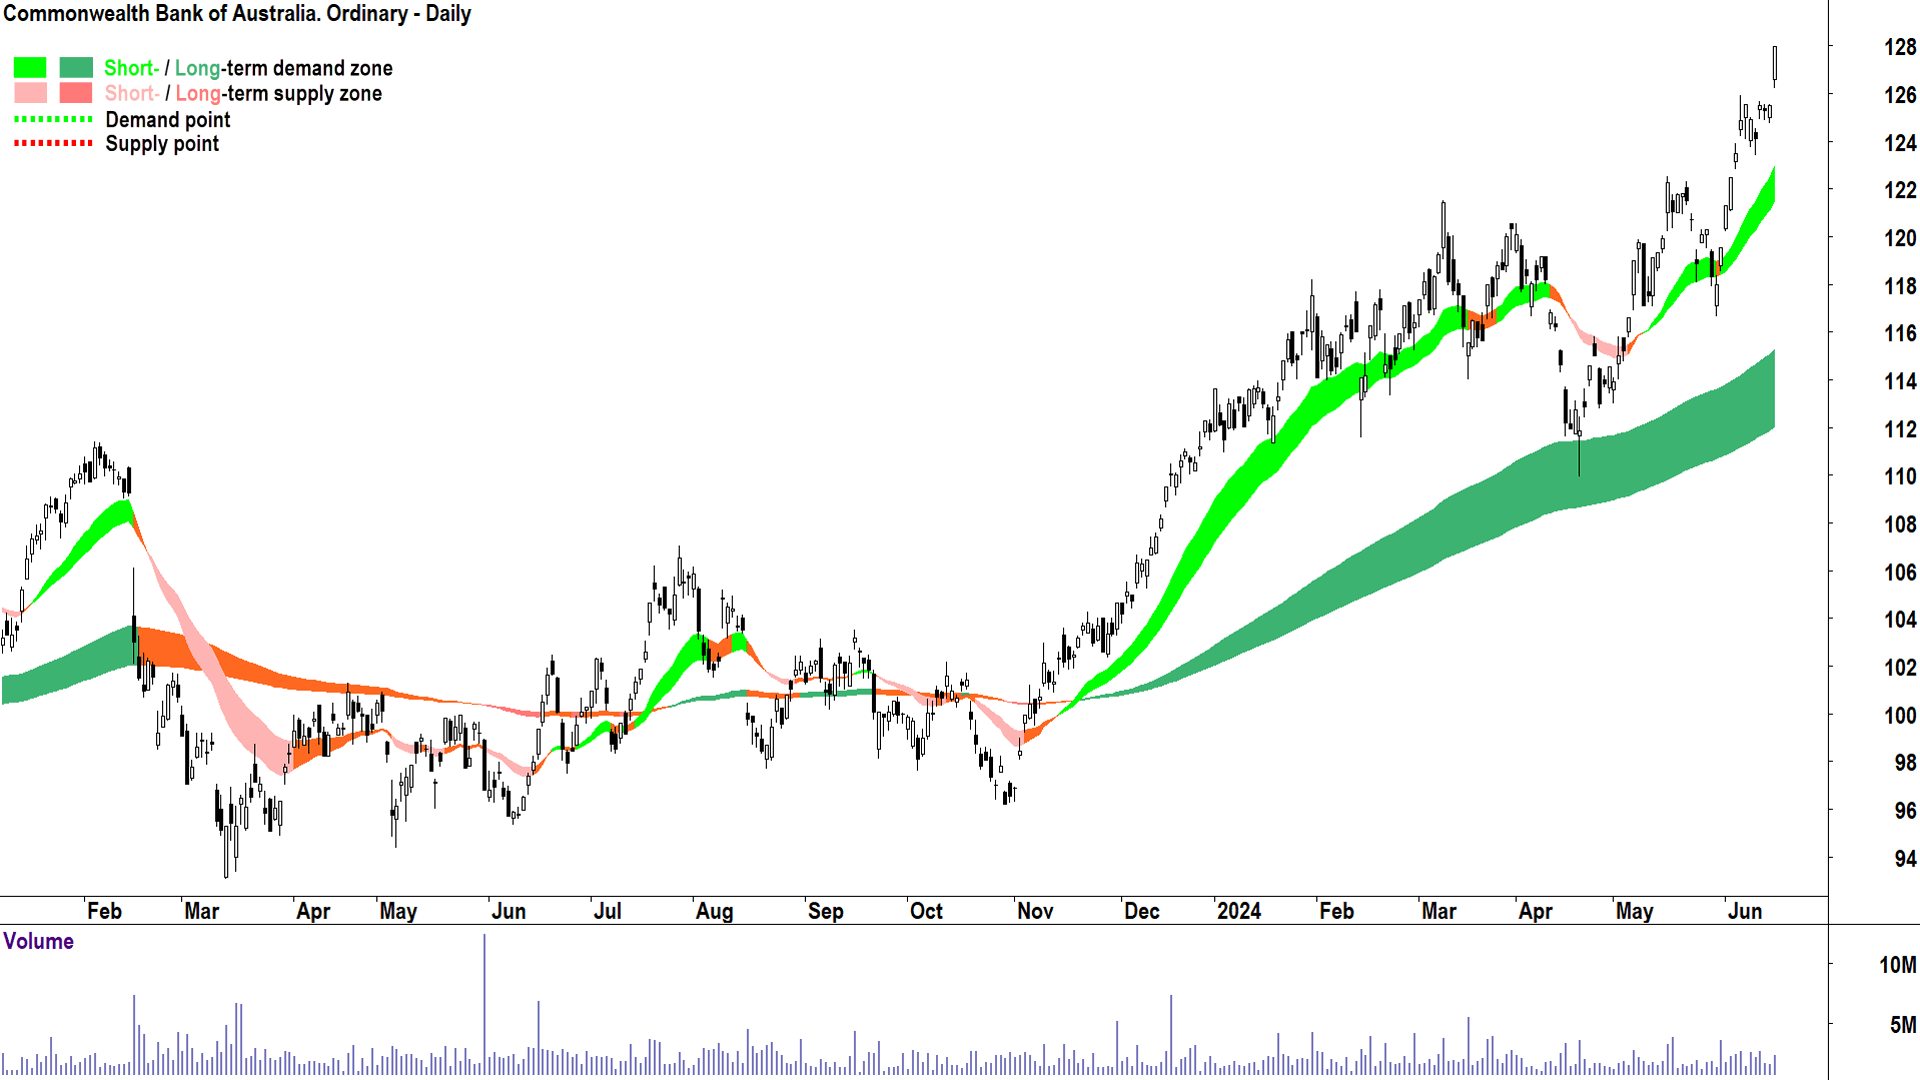
Typical long Continuation Setup, Commonwealth Bank of Australia (CBA), 18 June 2024 (click here for full size image)
The chart above of Commonwealth Bank of Australia (CBA) on 18 June 2024 shows a typical long continuation setup. It has the following characteristics:
Long term uptrend (long term trend ribbon (dark green) is rising)
Short term uptrend (short term trend ribbon (light green) is rising)
Demand-side price action (i.e., rising peaks and rising troughs)
Predominance of demand-side candles (i.e., those with white bodies and or downward pointing shadows)
A strong demand-side candle (i.e., a relatively long demand-side candle)
As you know from Monday's discussion, CBA is the most Featured (i.e., highest conviction) stock in ChartWatch ASX Scans for potential longs since this series started. The 18 June 2024 candle constituted the fifth setup out of 53 times CBA has been run as a Feature Uptrend.
A "short" continuation setup occurs in a well established long term downtrend. We can see from this definition that "short" in this context doesn't refer to the duration of the setup, but rather it refers to the direction the setup expects the price to go. Here, short is referring to down. Short sellers aim to profit from a fall in a stock's price by selling at a higher price and then buying back at a lower price.
%20chart%202%20September%202024.png)
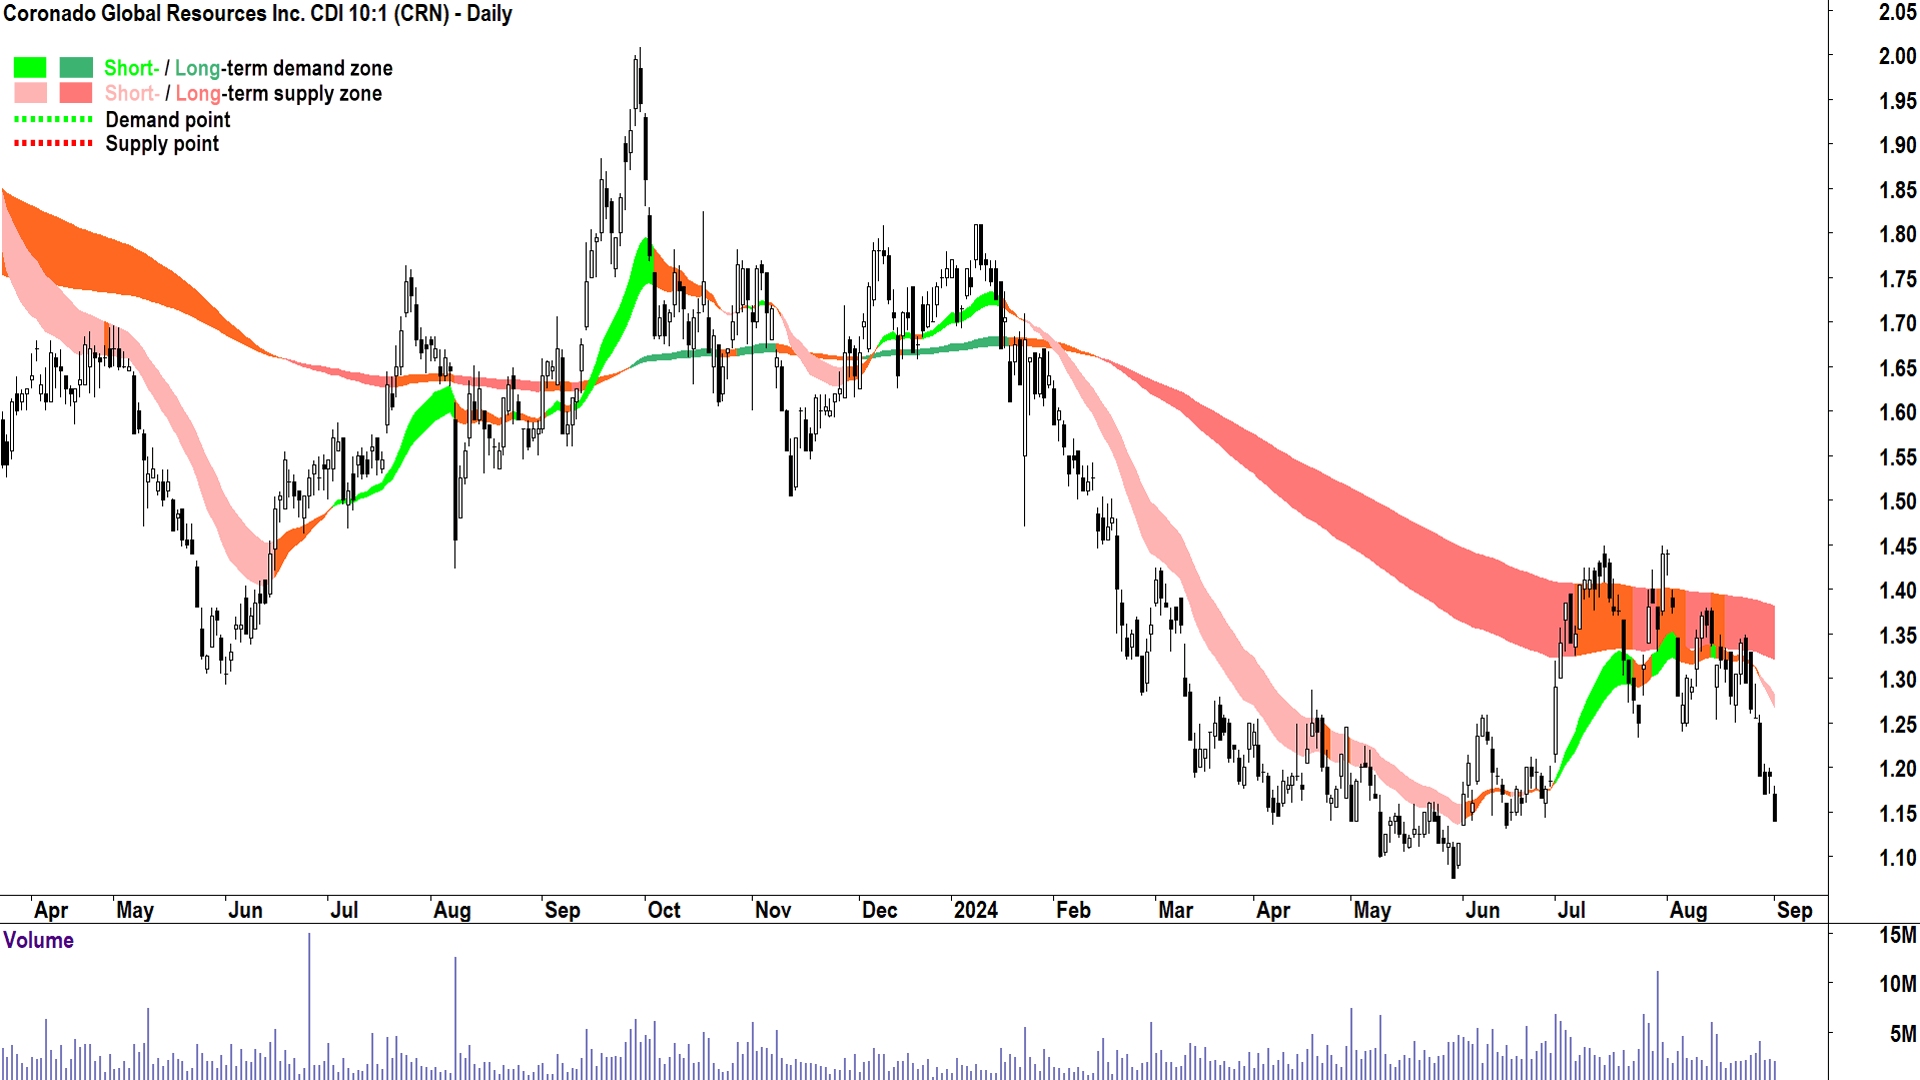
Typical short Continuation Setup, Coronado Global Resources (CRN), 18 June 2024 (click here for full size image)
The chart above of Coronado Global Resources (CRN) on 3 September 2024 shows a typical short continuation setup. It has the following characteristics:
Long term downtrend (long term trend ribbon (dark pink) is falling)
Short term downtrend (short term trend ribbon (light pink) is falling)
Supply-side price action (i.e., falling peaks and falling troughs)
Predominance of supply-side candles (i.e., those with black bodies and or upward pointing shadows)
A strong supply-side candle (i.e., a relatively long supply-side candle)
As you know from Tuesday's discussion, CRN is the most Featured (i.e., highest conviction) stock in ChartWatch ASX Scans for potential shorts since this series started. The 3 September 2024 candle also constituted the fifth setup for CRN, but this time out of a whopping 62 times this stock has been run as a Feature Downtrend.
The continuation setup tends to yields lower risk outcomes as it aims to follow the prevailing short and long term trends. It tends to deliver the bulk of the opportunities identified here in ChartWatch ASX Scans, as one will often find that a stock can be featured many times over a long period of time as it's trend continues.
Welcome to my ChartWatch Daily ASX Scans series. Here I present scan lists based on my trend following technical analysis methodology. My goal is to alert you to the best uptrends and downtrends on the ASX.
Feel free to get your favourite AI to convert the tables below into lists you can upload to your favourite trading platform like TradingView. Then you'll be able to skip from chart to chart and quickly and easily see the best uptrends and downtrends on the ASX.
Some investors prefer to buy those stocks in strong uptrends, and avoid, sell, or short sell those stocks in strong downtrends – but how you use the lists is really up to you!
Note, many stocks in both lists have appeared there many times before. As long as they keep meeting my criteria – they'll keep appearing. But note, there won't be any notifications when they don't, so you'll have to do your own research on when a particular trend changes!
Uptrends Scan List
Company | Code | Last Price | 1mo % | 1yr % |
|---|---|---|---|---|
Ainsworth Game Technology | AGI | $0.950 | -1.6% | -20.2% |
AMA Group | AMA | $0.098 | +46.3% | +128.3% |
Aspen Group | APZ | $3.45 | +9.2% | +104.1% |
Bank of Queensland | BOQ | $7.79 | +4.0% | +33.4% |
Brambles | BXB | $22.96 | +14.1% | +59.7% |
Cobram Estate Olives | CBO | $2.08 | +11.8% | +15.9% |
Cuscal Group | CCL | $2.91 | +16.4% | 0% |
Charter Hall Group | CHC | $18.29 | +9.1% | +48.5% |
Centuria Industrial Reit | CIP | $3.12 | +4.7% | -1.9% |
Charter Hall Long Wale Reit | CLW | $4.19 | +9.4% | +21.4% |
Charter Hall Retail Reit | CQR | $4.01 | +7.5% | +19.3% |
Cleanaway Waste Management | CWY | $2.76 | +4.9% | -0.7% |
Dateline Resources | DTR | $0.094 | +944.4% | +623.1% |
EDU | EDU | $0.200 | +42.9% | +33.3% |
EML Payments | EML | $1.080 | +14.3% | +8.0% |
EVT | EVT | $16.04 | +13.9% | +34.1% |
Global X Fang+ ETF | FANG | $33.15 | +12.1% | +28.4% |
Generation Development Group | GDG | $5.44 | +30.1% | +151.8% |
Goodman Group | GMG | $32.96 | +12.0% | -3.5% |
Global X Artificial Intelligence ETF | GXAI | $12.40 | +10.4% | +22.8% |
iShares MSCI South Korea ETF | IKO | $97.29 | +8.2% | -2.3% |
Karoon Energy | KAR | $1.660 | +16.1% | -8.3% |
Kaiser Reef | KAU | $0.195 | +8.3% | +50.0% |
Lindian Resources | LIN | $0.135 | +22.7% | +8.0% |
Megaport | MP1 | $13.55 | +22.7% | -5.6% |
Metcash | MTS | $3.40 | +4.9% | -8.6% |
Native Mineral Resources | NMR | $0.190 | +5.6% | +763.6% |
Netwealth Group | NWL | $31.38 | +13.9% | +55.0% |
News Corporation | NWS | $51.02 | +4.2% | +25.4% |
Ophir High Conviction Fund | OPH | $3.11 | +9.9% | +16.5% |
Regis Healthcare | REG | $7.97 | +19.7% | +93.9% |
Rpmglobal | RUL | $3.04 | +8.2% | +21.6% |
Servcorp | SRV | $5.48 | +9.8% | +35.6% |
Turaco Gold | TCG | $0.505 | +23.2% | +124.4% |
Global X Morningstar Global Technology ETF | TECH | $112.20 | +10.9% | +8.4% |
Technology One | TNE | $40.06 | +36.5% | +125.3% |
Temple & Webster Group | TPW | $21.49 | +20.5% | +122.7% |
Unibail-Rodamco-Westfield | URW | $7.10 | +7.9% | +10.6% |
Today's Uptrends Scan List
Feature Charts from today's Uptrends List 🔎📈
The stocks that I feel are showing the strongest excess demand from today's Uptrends List are: AMA Group (ASX: AMA), Bank of Queensland (ASX: BOQ), Dateline Resources (ASX: DTR), EML Payments (ASX: EML), EVT (ASX: EVT), Generation Development Group (ASX: GDG), Goodman Group (ASX: GMG), Lindian Resources (ASX: LIN), Megaport (ASX: MP1), Native Mineral Resources (ASX: NMR), Ophir High Conviction Fund (ASX: OPH), Regis Healthcare (ASX: REG), Rpmglobal (ASX: RUL), Turaco Gold (ASX: TCG), Temple & Webster Group (ASX: TPW).
Charts of each below:
%20daily%20chart%2028%20May%202025.png)
%20daily%20chart%2028%20May%202025.png)
%20daily%20chart%2028%20May%202025.png)
%20daily%20chart%2028%20May%202025.png)
%20daily%20chart%2028%20May%202025.png)
%20daily%20chart%2028%20May%202025.png)
%20daily%20chart%2028%20May%202025.png)
%20daily%20chart%2028%20May%202025.png)
%20daily%20chart%2028%20May%202025.png)
%20daily%20chart%2028%20May%202025.png)
%20daily%20chart%2028%20May%202025.png)
%20daily%20chart%2028%20May%202025.png)
%20daily%20chart%2028%20May%202025.png)
%20daily%20chart%2028%20May%202025.png)
%20daily%20chart%2028%20May%202025.png)
Downtrends Scan List
Company | Code | Last Price | 1mo % | 1yr % |
|---|---|---|---|---|
Amotiv | AOV | $7.80 | +1.4% | -25.9% |
Avita Medical | AVH | $1.910 | -38.8% | -23.6% |
Champion Iron | CIA | $4.25 | -7.8% | -42.6% |
Collins Foods | CKF | $7.83 | -5.5% | -15.8% |
Cettire | CTT | $0.415 | -10.8% | -82.6% |
Clarity Pharmaceuticals | CU6 | $2.15 | -2.3% | -50.6% |
EBR Systems | EBR | $1.105 | -9.1% | -2.3% |
Elders | ELD | $6.20 | -0.8% | -25.2% |
Fortescue | FMG | $15.55 | -5.0% | -41.9% |
HMC Capital | HMC | $4.95 | +0.4% | -29.8% |
Humm Group | HUM | $0.455 | -7.1% | 0% |
Horizon Oil | HZN | $0.170 | -5.6% | -5.6% |
IDP Education | IEL | $7.90 | -10.3% | -51.6% |
Insignia Financial | IFL | $3.35 | -12.1% | +50.9% |
Iluka Resources | ILU | $3.79 | -9.8% | -49.3% |
Jumbo Interactive | JIN | $9.90 | -2.6% | -40.1% |
Kogan.Com | KGN | $3.94 | -15.1% | -13.2% |
Liberty Financial Group | LFG | $3.10 | -6.9% | -19.7% |
Lifestyle Communities | LIC | $7.10 | -4.1% | -43.3% |
Larvotto Resources | LRV | $0.615 | -29.3% | +434.8% |
Liontown Resources | LTR | $0.605 | +6.1% | -55.8% |
Monash IVF Group | MVF | $0.760 | -8.4% | -45.7% |
Myer | MYR | $0.720 | +2.1% | +19.2% |
Nufarm | NUF | $2.37 | -40.0% | -48.1% |
Novonix | NVX | $0.455 | +1.1% | -44.8% |
Patriot Battery Metals | PMT | $0.235 | -14.5% | -74.2% |
Platinum Asset Management | PTM | $0.550 | -6.8% | -31.5% |
Redox | RDX | $2.73 | -6.2% | -15.0% |
Treasury Wine Estates | TWE | $8.11 | -9.0% | -29.5% |
Wildcat Resources | WC8 | $0.145 | -27.5% | -71.0% |
Today's Downtrends Scan List
Feature Charts from today's Downtrends List 🔎📉
The stocks that I feel are showing the strongest excess supply from today's Downtrends List are: Cettire (ASX: CTT), Elders (ASX: ELD), Humm Group (ASX: HUM), IDP Education (ASX: IEL), Iluka Resources (ASX: ILU), Jumbo Interactive (ASX: JIN), Kogan.Com (ASX: KGN), Redox (ASX: RDX), Treasury Wine Estates (ASX: TWE).
Charts of each below:
%20daily%20chart%2028%20May%202025.png)
%20daily%20chart%2028%20May%202025.png)
%20daily%20chart%2028%20May%202025.png)
%20daily%20chart%2028%20May%202025.png)
%20daily%20chart%2028%20May%202025.png)
%20daily%20chart%2028%20May%202025.png)
%20daily%20chart%2028%20May%202025.png)
%20daily%20chart%2028%20May%202025.png)
%20daily%20chart%2028%20May%202025.png)
Important considerations when using the ChartWatch Daily ASX Scans:
1. The future is unknown. Anything can happen to change the trends in the lists above. A stock in a perfect uptrend or downtrend may not remain that way by the close of trading today. 2. These lists are not exhaustive, they are curated by Carl. You will find that certain stocks might not appear in a particular list on consecutive days but might reappear when Carl feels it deserves to return to the list. 3. This is not a recommendation service, merely an aid to help you better understand the workings of Carl’s technical analysis model in a practical way. Carl will not alert you to stocks that have dropped off a list because their trend has changed – it is up to you to apply the criteria to determine why a particular stock might not still be included. 4. This is general, educational information only – always do your own research.
