
News | Market Wraps
Evening Wrap: ASX 200 rally stalls as mining and energy shares dumped ahead of Trump Liberation Day speech
The S&P/ASX 200 closed 9.3 points higher, up 0.12%.

Mentioned
The S&P/ASX 200 closed 9.3 points higher, up 0.12%.
On surface, a quiet day for Aussie stocks. But this could not be further from the case! There were equally big winners and losers across the major sectors today.
Winners included interest rate sensitives like Property, Financials, Technology, and Consumer Discretionary.
On the other hand, economic cyclicals like Resources and Energy got burnt today because of ongoing fears over the impact of the escalating trade war on the global economy.
On that last point, there's a massive pressure point in this looming in the shape of President Trump's "Liberation Day" policy speech due at 7am tomorrow morning.
Today's ChartWatch: Detailed technical analysis on the NASDAQ Composite, S&P/ASX 200 and Copper.
Click/scroll through for the usual reporting of the major sector and stock-specific moves, the broker responses to them, as well as all the key upcoming economic data like President Trump's speech in tonight's Evening Wrap 👇.
Let's dive in!
Today in Review
Wed 02 Apr 25, 5:17pm (AEST)
Name | Value | % Chg |
|---|---|---|
Major Indices | ||
| ASX 200 | 7,934.5 | +0.12% |
| All Ords | 8,133.1 | +0.08% |
| Small Ords | 2,986.4 | -0.53% |
| All Tech | 3,367.1 | +0.12% |
| Emerging Companies | 2,208.2 | -0.98% |
Currency | ||
| AUD/USD | 0.6294 | +0.25% |
US Futures | ||
| S&P 500 | 5,664.25 | -0.18% |
| Dow Jones | 42,193.0 | -0.11% |
| Nasdaq | 19,558.25 | -0.24% |
Name | Value | % Chg |
|---|---|---|
Sector | ||
| Real Estate | 3,616.8 | +1.63% |
| Communication Services | 1,664.9 | +0.80% |
| Financials | 8,457.6 | +0.72% |
| Health Care | 41,101.4 | +0.69% |
| Consumer Discretionary | 3,838.6 | +0.68% |
| Information Technology | 2,308.7 | +0.65% |
| Industrials | 7,792.8 | -0.01% |
| Utilities | 9,223.2 | -0.09% |
| Consumer Staples | 11,649.4 | -0.97% |
| Energy | 7,915.2 | -1.29% |
| Materials | 15,886.1 | -1.61% |
Markets

ASX 200 Session Chart
The S&P/ASX 200 (XJO) finished 9.3 points higher at 7,934.5, 0.52% from its session high and just 0.15% from its low. Despite the benchmark index sneaking a gain, and in keeping with today’s upward pointing shadow (see ChartWatch), in the broader-based S&P/ASX 300 (XKO), advancers lagged decliners by 118 to 154.
Before I write this part of the Evening Wrap each day – the bit where I try to explain why some stuff went up and why some stuff went down – I always check the best/worst sectors list (basically the ASX 200 sector indices ordered from best to worst by percentage move on the day).
Sector Index | Last Price | Change % | 1mo % | 1yr % |
|---|---|---|---|---|
S&P/ASX 200 A-REIT Index | 1653.8 | +1.6% | -2.3% | -4.3% |
S&P/ASX 200 Communication Services Sector Index | 1664.9 | +0.8% | -2.7% | +6.5% |
S&P/ASX 200 Financials Sector Index | 8457.6 | +0.7% | -2.2% | +13.6% |
S&P/ASX 200 Health Care Sector Index | 41101.4 | +0.7% | -4.9% | -4.5% |
S&P/ASX 200 Consumer Discretionary Sector Index | 3838.6 | +0.7% | -5.4% | +7.0% |
S&P/ASX 200 Information Technology Sector Index | 2308.7 | +0.6% | -8.8% | +2.0% |
S&P/ASX 200 Index | 7934.5 | +0.1% | -3.2% | +0.6% |
S&P/ASX 200 Industrials Sector Index | 7792.8 | 0.0% | -3.4% | +9.3% |
S&P/ASX 200 Utilities Sector Index | 9223.2 | -0.1% | +3.5% | +10.9% |
S&P/ASX 200 Consumer Staples Sector Index | 11649.4 | -1.0% | -2.4% | -5.1% |
S&P/ASX 200 Energy Sector Index | 7915.2 | -1.3% | -4.2% | -27.0% |
S&P/ASX 200 Materials Sector Index | 15886.1 | -1.6% | -3.1% | -12.4% |
S&P/ASX 200 Resources Index | 5068.7 | -1.6% | -2.2% | -14.7% |
S&P/ASX All Ordinaries Gold SubInd Index | 10852.1 | -1.7% | +9.2% | +44.8% |
S&P/ASX 200 Sector Performance Table, best to worst by percentage
I find I can usually at a glance, figure out what the big funds were thinking on the day. This is nothing special, it’s more than likely the same thing they were thinking yesterday – as broad themed fund sector rotations last for weeks and months – but it also usually boils down to "risk-on" or "risk-off" and/or something to do with changes in risk-free yields.
"Risk-on" is all about high-PE, high momentum, high growth, and usually economic cyclicals (so mining and energy stocks – but not always!).
"Risk-off" is all about low-PE, defensive, and economically resilient.
The edges of these two themes can get blurred a little at times – but basically, that’s pretty much it in terms of what the big funds are thinking on any one day: Offence or defence.
Overriding everything is the "price of money" concept that drives much of what is perceived to be risk on and risk off. I am of course referring to the yields available on risk-free assets like benchmark government bonds – US Treasury bonds being the most influential.

US 10 Year T-Bond Yield chart - another big drop in yields overnight (click here for full size image)
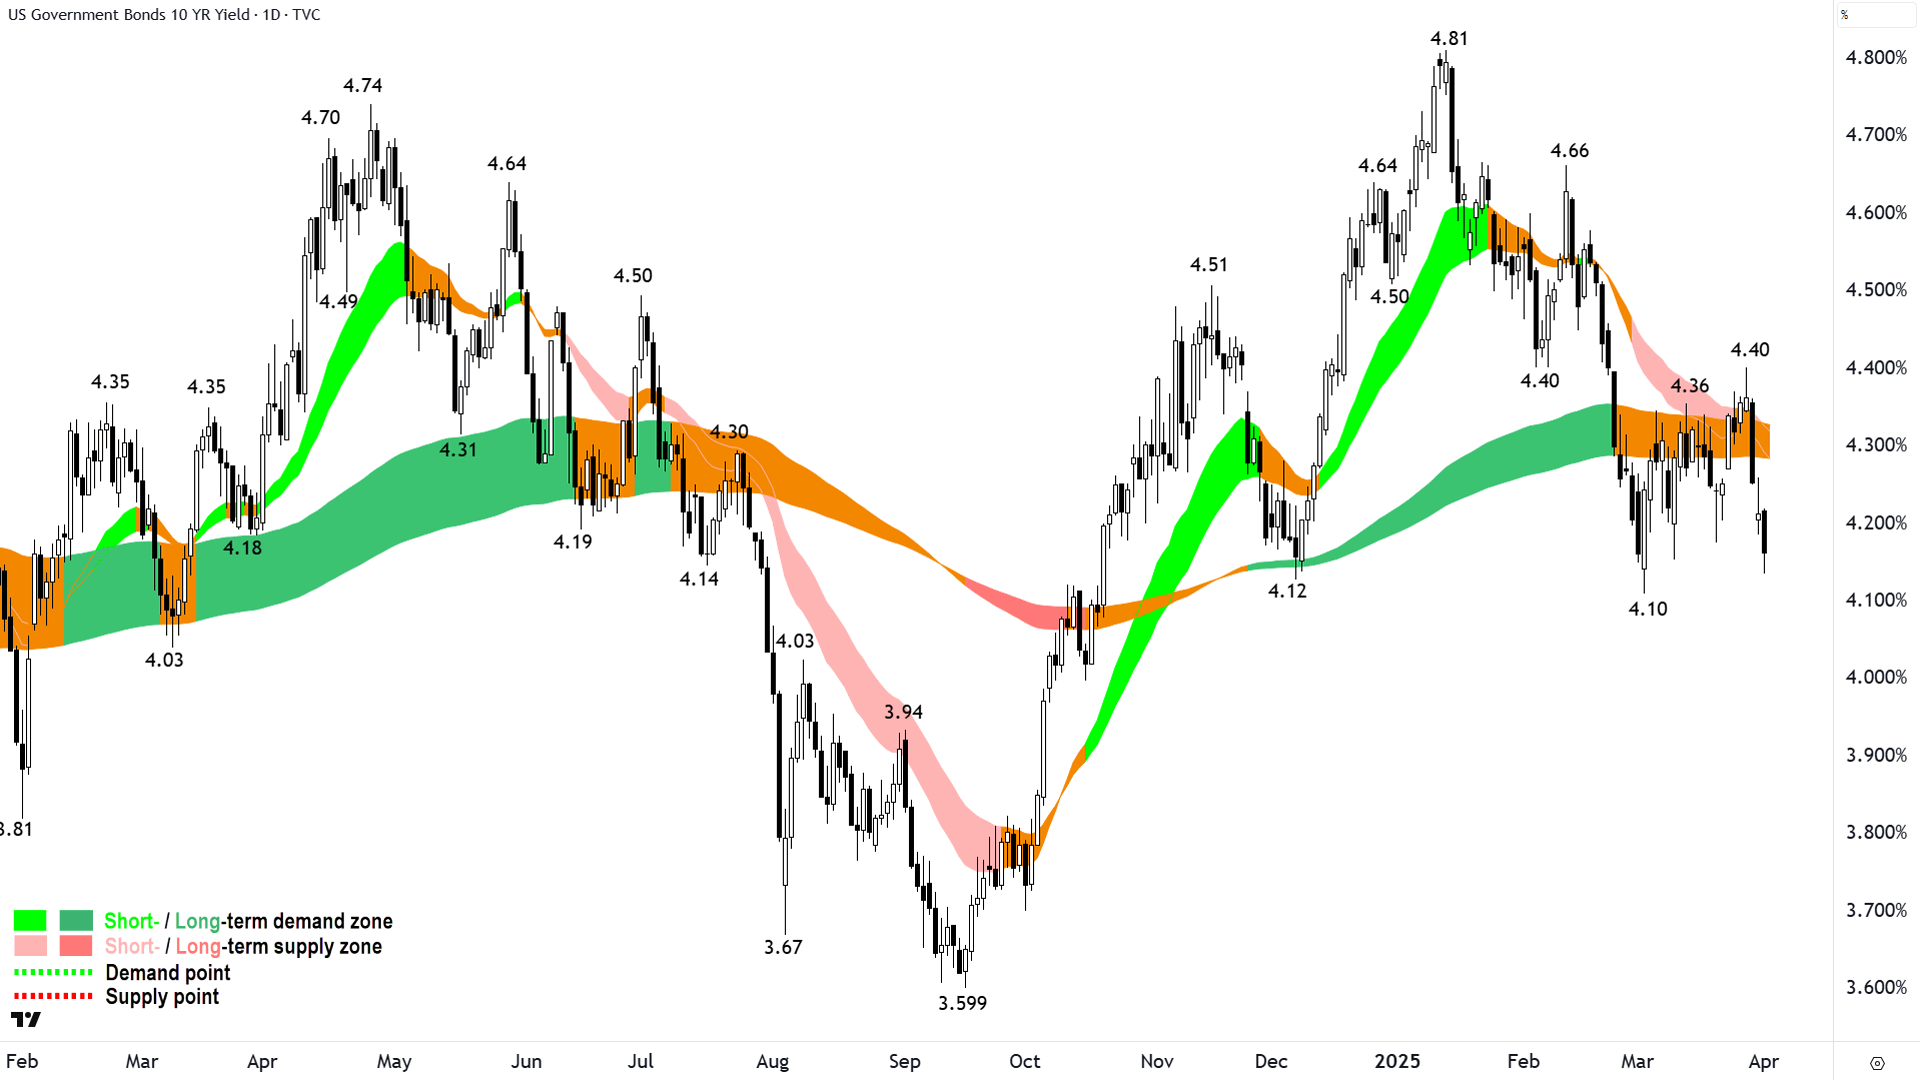
Anyhoos, long story short (and I hope that you long-suffering readers of this Wrap are beginning to pick up on this stuff and spot these thematic-based moves in advance!) today smacked of a reaction to sharply lower risk-free yields overnight, with a twist of risk off.
I say this because the sectors most benefited by lower market yields – the interest rate sensitives – topped the leader board. So, we’re talking about:
Bond proxy – Real Estate Investment Trusts (XPJ) (+1.6%) and Financials (XFJ) (+0.71%)
High-PE – Communication Services (XTJ) (+-%), Health Care (XHJ) (+0.69%), and Information Technology (XIJ) (+-%)
Consumer sensitive (but also high-PE) – Consumer Discretionary (XDJ) (+0.68%)
It was likely a bonus for XHJ and XTJ that they also have a defensive flair (another nice day for Telstra (ASX: TLS) (+1.2%)) – because that was the other theme at play today – and which has been at play for weeks now since this correction began. Funds still have to buy something, it might as well be defensive (i.e., economically resilient).
The benchmark ASX 200 was only up 0.11% on the day, so “the haves” must have been distinct from the “have nots”.
Enter:
Economic cyclicals got burnt today because of ongoing fears over the impact of the escalating trade war on the global economy. There's a massive pressure point in this looming in the shape of President Trump's "Liberation Day" policy speech due at 7am tomorrow morning – more on that in ChartWatch, below.
I note the Gold (XGD) sub-index (-1.7%) bucked the thematic trends, as it is usually on the list of interest rate sensitives and typically benefits from lower market yields (gold has no yield so the opportunity cost of owning gold falls when market yields fall). But I suggest this move was more to do with the dip in the gold price overnight than anything else.
In short: You want to look at the market like the fund managers look at it. Basically just as a big ball of opportunity cost and pricing risk.
As suggested above, often these themes change gradually as most of the time the economic fundamentals that drive them change gradually. This means I'm at risk of sounding like a broken record here most days…
But if you prefer the alternative…where like every other market wrap out there they can only tell you BHP went up by this amount and NAB went down by that amount…then let me know! 😁
So, I ask you, what’s the current environment: Offence or defence?
ChartWatch
NASDAQ Composite Index

Two days rally...ok, now what? 🤔 (click here for full size image)
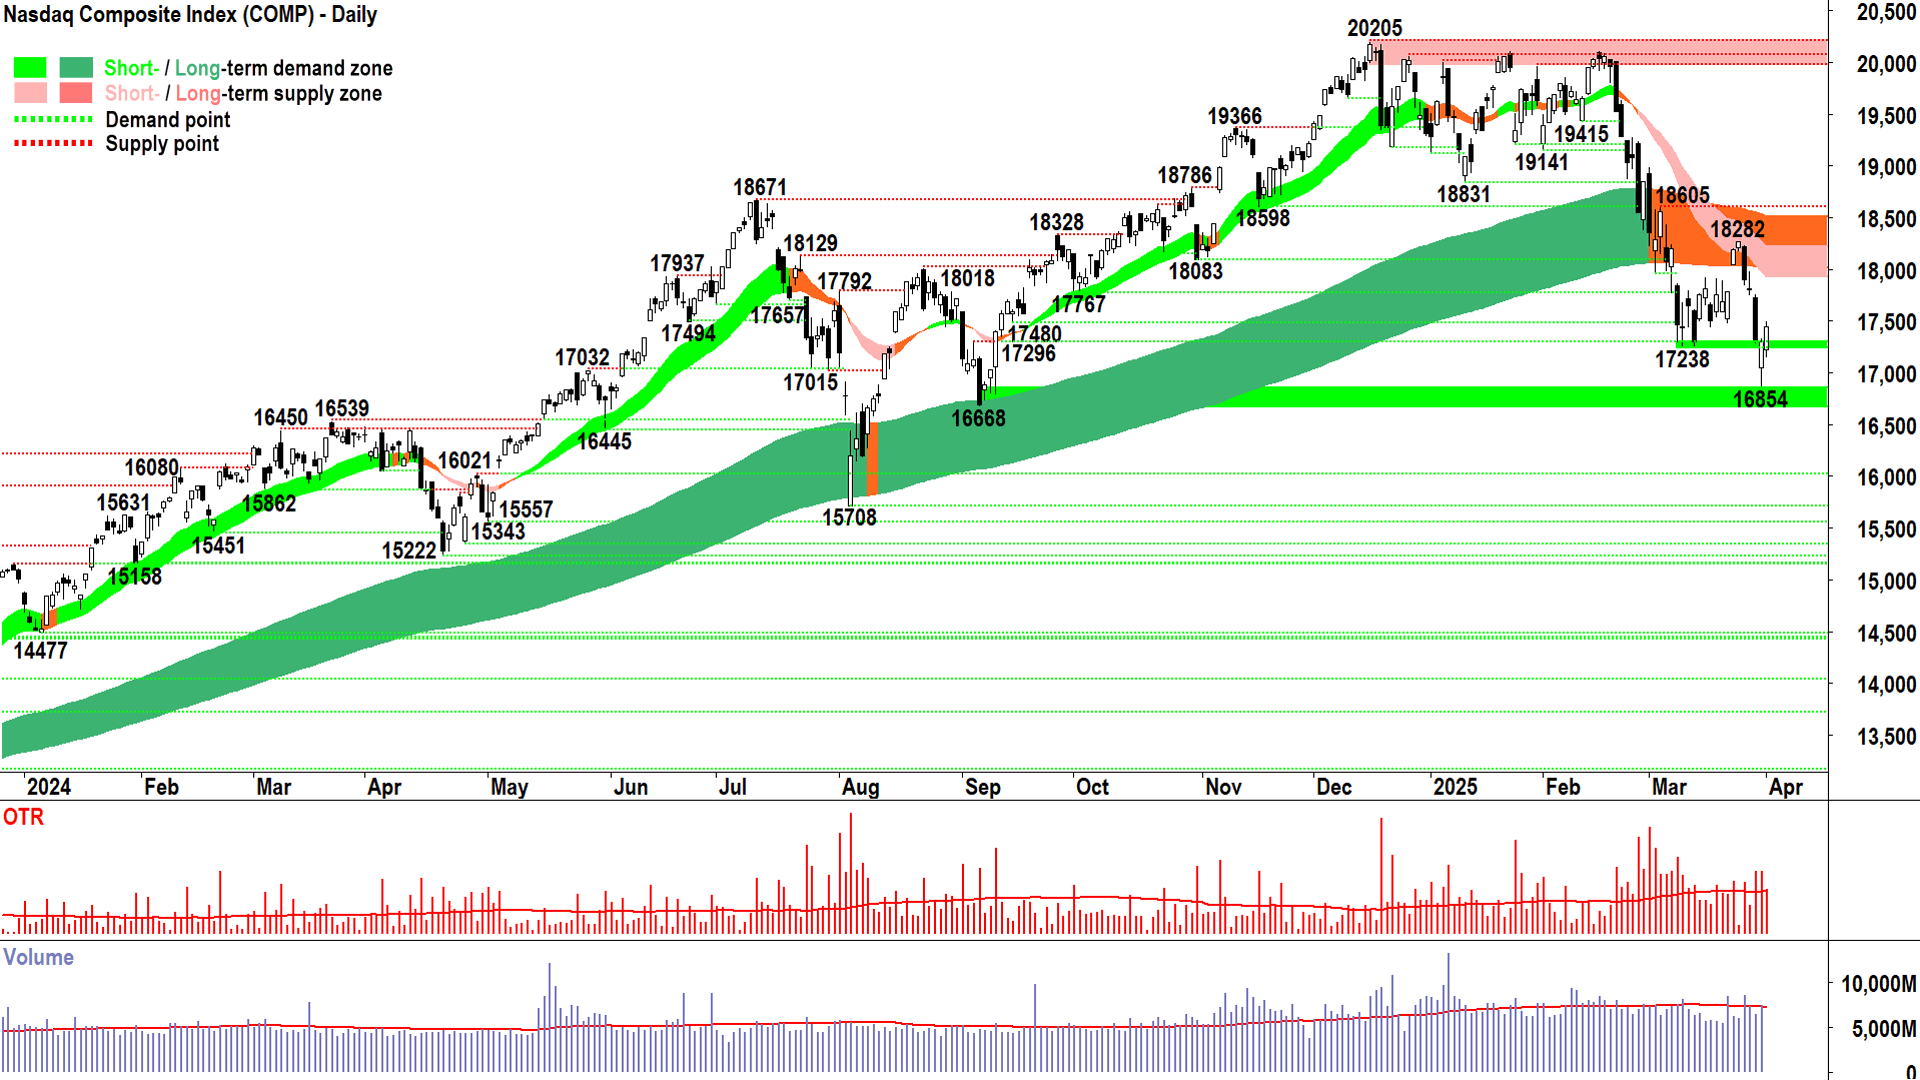
Another credible demand-side showing in last night's candle – a decent white body compared to recent examples and a close near to the high of the session indicating excess demand held throughout most of the day.
As suggested yesterday, it stamps 16854 as a point of demand and given the context of that low – i.e., the massive uncertainty and similarly strong supply-side control that preceded it. I must therefore assume it will prove to be a pivotal point of control going forward.
I agree, it’s frustrating that the elimination of the demand at 17238 was supposed to act as that same critical level, but to be fair – 17238 was never cracked. It held – simply the prevailing bearish sentiment caused the session to open below it – but we can see the demand surged in and that move was only fleeting.
Still, even with the last 2-day reversal, I can’t help but feel it is just a matter of time until the supply-side makes its mark again. Most likely, this will occur somewhere around the short term trend ribbon – which now has the tendency to act as a zone of dynamic supply.
Stay of execution or beginning of the next bull phase? I don’t know – ask a prognosticator.
All I know for sure is that we remain in a long term equilibrium market, bordering on a full transition to long term supply-side control.
The short term trend is unequivocally still down, and the price action and broader set of candles confirm this.
Watch closely for the fingerprints of supply to reappear in the short term trend ribbon – i.e., supply-side candles (black-bodied and or upward pointing shadows), and the setting of a peak and or falling peaks.
I remain sceptical until I see the opposite – so at least a couple of rising troughs, and at least another burst of strong demand-side candles occurring at them. Then, subsequent to this, a close back above the 18282 and the long term trend ribbon.
S&P/ASX 200 (XJO)
%20chart%202%20April%202025.png)
Holding our breath...for the greatest economic strategist in the history of the world...maybe longer... (click here for full size image)
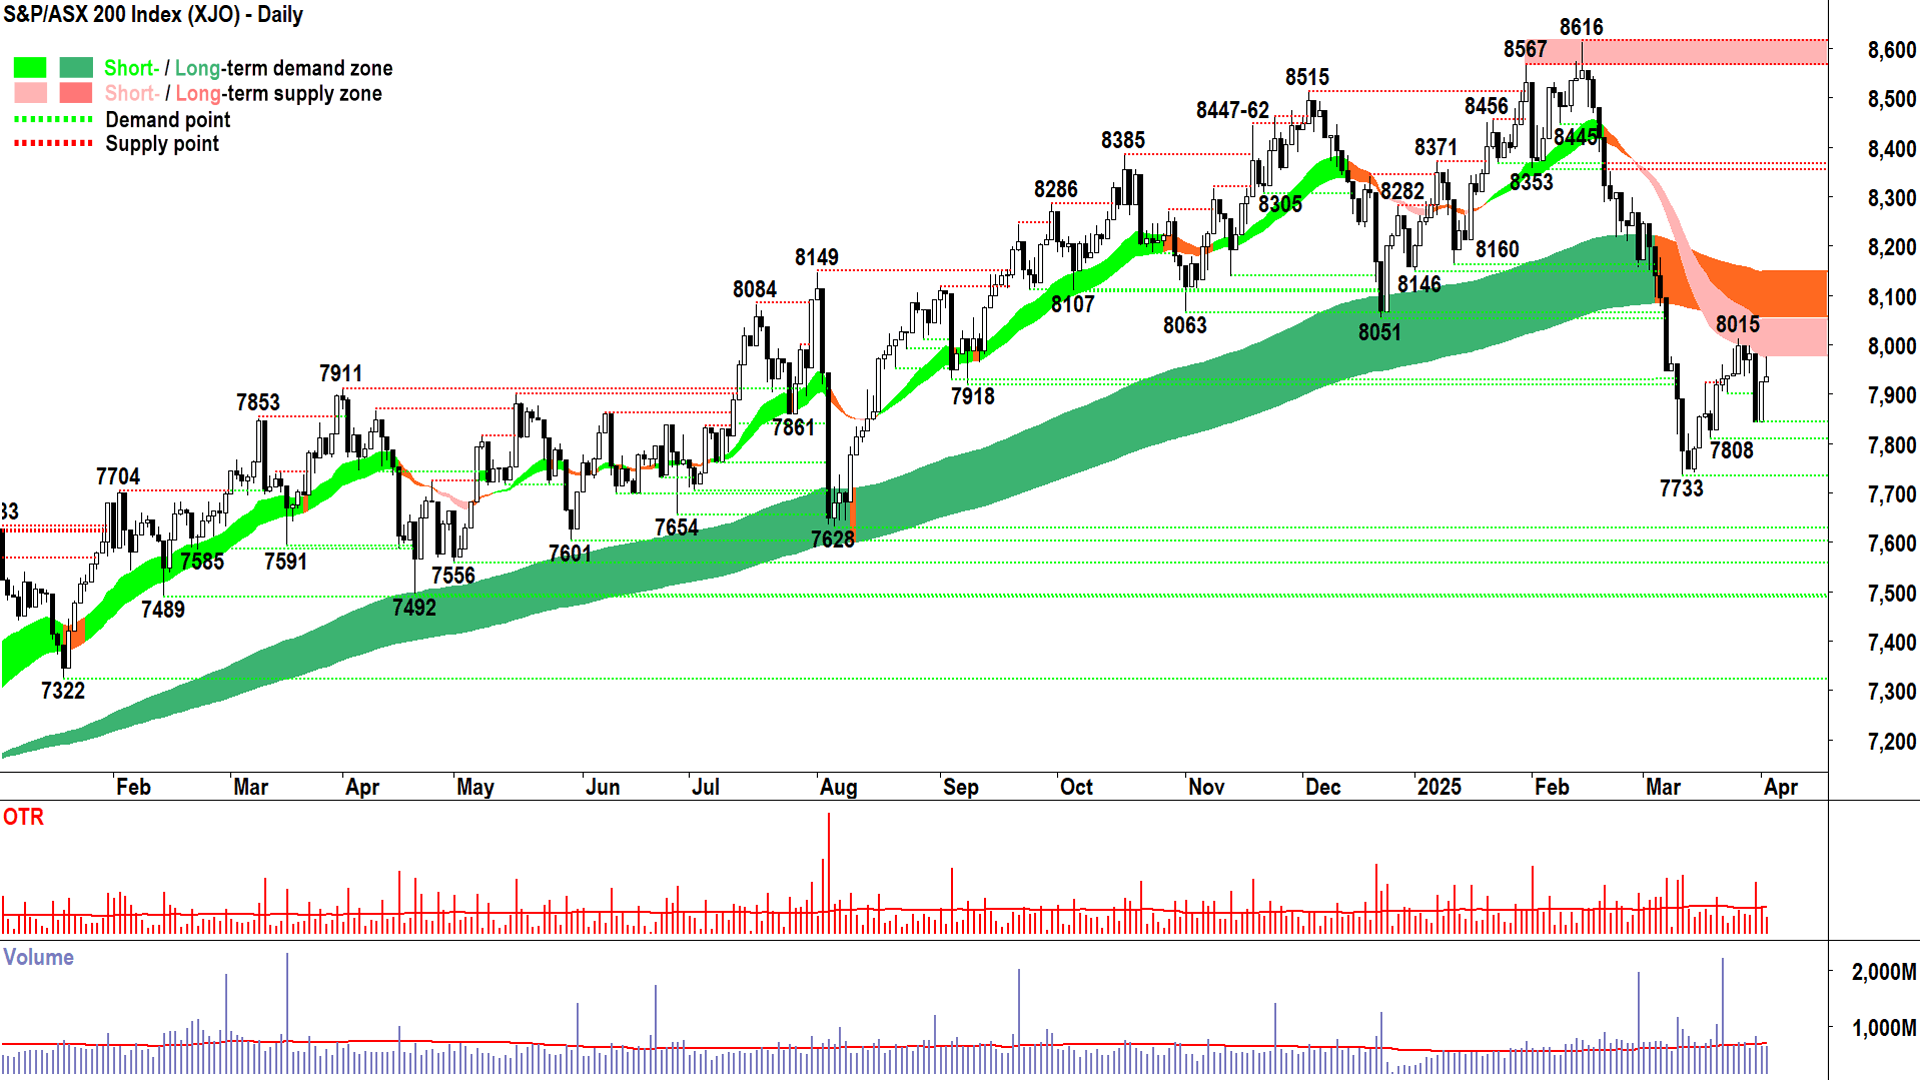
It was always going to be tough for the XJO to make a morning rally (i.e., in response to gains in US stocks overnight) – STICK!
President Trump’s speech, due at 7am Sydney time tomorrow morning, looms large. Who knows what insightful and economically proven strategies for bolstering the US’s position in the world he’s about to unveil in his “Liberation Day” trade policy announcement?
Probably none.
But he’s going to say a bunch of “stuff”, let’s call it, and the prospect of that stuff was always going to make local fund managers reluctant to commit.
Not only did they not commit, however, it looks from today’s upward pointing shadow that they preferred to sell into the rally. Typical bear market mantra.
It is pure coincidence that the top of that shadow occurred at a zone of supply we consider to be highly important – the short term downtrend ribbon. But today’s price action does fit with the broader short term downtrend-long term equilibrium narrative espoused by the current set of technicals.
There’s probably no point in doing much technical analysis until tomorrow, but until then, 8015 remains the most relevant overhead point of supply – a close above it would be impressive given the current state of affairs.
Alternatively, a close below 7808-7843* would re-establish the short term downtrend and reset us on a course for long term trend change (to down). (*7843 is the new trough at the 31-Mar low caused by today’s candle, it is not labelled in the chart to save on clutter).
High Grade Copper Futures (Front month, back-adjusted) COMEX
%20COMEX%20chart%202%20April%202025.png)
Hangover II (the sequel is never as good as the original!) (click here for full size image)

The last time we covered Copper was in ChartWatch in the Evening Wrap on 26 March.
In that update, we just about bookended a trade on copper that commenced with the 5-Feb long white candle.
The long upward pointing shadow of the 26-Mar candle – with its tip smack bang at the 5.3805-5.3935 major supply zone – spelled at least a period of equilibrium… “a breather for at least a few candles” as I put it last time.
Unfortunately for copper bulls, the severity of the next candle, the long black candle on 27-Mar, confirmed the supply-side had indeed taken control of the copper price. This takes us from breather to pullback – and that’s where we pick up the price action in the chart above – in a pullback to a demand zone defined by the trough at 5.027 and the top of the old major supply zone at 4.906.
A couple of modest downward pointing shadows since 27-Mar suggests there’s at least some demand ebbing around the top of that 4.906-5.027 zone – and today’s candle is white, and so far, trading near the high of its range.
But today’s candle is live so we must discount it!
It means we still require a resounding show from the demand-side that they’re moving back in to buy the dip – this could be one or two strong demand-side candles (i.e., long white-bodies and or long downward pointing shadows), and or a trough or rising troughs in 4.906-5.027.
I also note the dynamic demand of the short term uptrend ribbon is lurking in this area. It also could prove to be critical.
So, I suggest its pretty straight forward here: Hold that demand zone, hold it well, and the new copper bull is intact. In this case, we could very easily tackle the major supply zone again very soon.
Conversely, crack 4.906-5.027, close below the short term trend ribbon – and it’s far more likely 2025’s big copper adventure is going to go the way of 2024’s.
Candles in the demand zone will speak volumes! (No doubt also a big pressure point with respect to Liberation Day here too!)
Economy
Today
AUS Building Approvals February
-0.3% actual vs -1.4% forecast and +6.9% (revised up from +6.3%) in January
Small drop, but significantly better than expected, and January revised higher also
Positive uptrend in building approvals continues, driven by population growth and improving housing sentiment from consumers as construction and materials inflation eases
Later this week
Thursday
All day OPEC+ Meetings
07:00 President Trump Speech on Tariffs
09:45 CHN Caixin Services PMI March (51.5 forecast vs 51.4 in February)
22:00 USA ISM Services PMI February (53.0 forecast vs 53.0 in February)
Friday
All Day Chinese Bank Holiday
20:30 USA Non-Farm Payrolls Data March
Employment Change: +139,000 forecast vs +151,000 in February
Average Hourly Earnings: +0.3% forecast, unchanged from February
Unemployment Rate: 4.1%, unchanged from February
23:25 USA Federal Reserve Chairman Jerome Powell speech
Latest News
Interesting Movers
Trading higher
+6.5% COG Financial Services (COG) - No news since 26-Mar Board Renewal and 1H2025 Results Presentation, rise is consistent with prevailing short term uptrend and long term trend is transitioning from down to up, a recent regular in ChartWatch ASX Scans Uptrends list 🔎📈
+6.1% Light & Wonder (LNW) - Litigation Update Call.
+6.0% Aspen Group (APZ) - Acquisition - Living & Lifestyle at Australind (Bunbury) WA and Goldman Sachs Emerging Leaders Conference, rise is consistent with prevailing short and long term uptrends, a regular in ChartWatch ASX Scans Uptrends list 🔎📈
+5.3% Rox Resources (RXL) - No news since 31-Mar Youanmi High Grade Gold Hits Continue, rise is consistent with prevailing short and long term uptrends, a regular in ChartWatch ASX Scans Uptrends list 🔎📈
+5.1% SRG Global (SRG) - No news, bounced perfectly from long term uptrend ribbon! 🔎📈
+4.3% EBR Systems (EBR) - Update on Preparation of Preliminary Proxy Statement, rise is consistent with prevailing short and long term uptrends, a regular in ChartWatch ASX Scans Uptrends list 🔎📈
+4.3% Megaport (MP1) - Change in substantial holding (State Street decrease, so possibly some short covering here 🤔), bounced perfectly from long term uptrend ribbon! 🔎📈
+4.3% Kelsian Group (KLS) - Intention to divest Australian tourism assets.
+3.5% BetaShares Crypto Innovators ETF (CRY) - No news, major cryptos rallied with risk assets last night.
+3.4% Healthco Healthcare and Wellness Reit (HCW) - No news, general strength across the broader Real Estate sector today.
+3.2% Charter Hall Group (CHC) - No news, general strength across the broader Real Estate sector today.
+3.2% Goodman Group (GMG) - No news, general strength across the broader Real Estate sector today.
Trading lower
-11.1% Lotus Resources (LOT) - No news, general weakness across the broader Uranium sector today, (media speculation it's Trump trade war related, but I say: Just look at their charts 😁!), fall is consistent with prevailing short and long term downtrends, a regular in ChartWatch ASX Scans Downtrends list 🔎📉
-10.5% Vulcan Energy Resources (VUL) - Corporate Presentation Q2 2025 and Financing and German Raw Materials Fund update, (recently back in uptrends list - should have known better 🤦!).
-8.3% Strike Energy (STX) - No news, general weakness across the broader Energy sector today, fall is consistent with prevailing short and long term downtrends, a regular in ChartWatch ASX Scans Downtrends list 🔎📉
-7.6% Silver Mines (SVL) - No news, general weakness across the broader Precious Metals sector today, (silver and gold prices down overnight - silver more so than gold 🥈).
-7.4% Andean Silver (ASL) - Continued negative response to 01-Apr Cerro Bayo Resource increases by 22 per cent to 111Moz, general weakness across the broader Precious Metals sector today.
-6.5% 29METALS (29M) - No news, fall is consistent with prevailing short and long term downtrends, one of the most Featured (highest conviction) stocks in ChartWatch ASX Scans Downtrends list 🔎📉
-6.3% Meeka Metals (MEK) - No news, general weakness across the broader Precious Metals sector today.
-6.2% Black Cat Syndicate (BC8) - No news since 01-Apr Kal East - Processing Commenced at Lakewood, general weakness across the broader Precious Metals sector today.
-6.1% Coronado Global Resources (CRN) - No news, general weakness across the broader Energy sector today, fall is consistent with prevailing short and long term downtrends, one of the most Featured (highest conviction) stocks in ChartWatch ASX Scans Downtrends list 🔎📉
-5.8% Aurelia Metals (AMI) - No news, general weakness across the broader Resources sector today.
-5.4% Incitec Pivot (IPL) - No news, fall is consistent with prevailing short and long term downtrends, a regular in ChartWatch ASX Scans Downtrends list 🔎📉
-5.4% Treasury Wine Estates (TWE) - Nigel Garrard to join TWE Board as a Non-executive Director, fall is consistent with prevailing short and long term downtrends, a regular in ChartWatch ASX Scans Downtrends list 🔎📉
-4.8% Neuren Pharmaceuticals (NEU) - No news, fall is consistent with prevailing short and long term downtrends, a regular in ChartWatch ASX Scans Downtrends list 🔎📉
-4.7% Orthocell (OCC) - Orthocell to Present at HealthInvest Summit.
-4.5% Iperionx (IPX) - No news since 01-Apr IperionX Receives EXIM Bank Board Approval for a US$11M Loan, fall is consistent with prevailing short term downtrend and long term trend is transitioning from up to down, a regular in ChartWatch ASX Scans Downtrends list 🔎📉
-4.5% Chalice Mining (CHN) - No news, fall is consistent with prevailing short and long term downtrends, a regular in ChartWatch ASX Scans Downtrends list 🔎📉
-4.4% IDP Education (IEL) - No news, fall is consistent with prevailing short and long term downtrends, one of the most Featured (highest conviction) stocks in ChartWatch ASX Scans Downtrends list 🔎📉
-4.3% Liontown Resources (LTR) - No news, general weakness across the broader Lithium sector today, fall is consistent with prevailing short and long term downtrends, one of the most Featured (highest conviction) stocks in ChartWatch ASX Scans Downtrends list 🔎📉
-3.9% Zip Co. (ZIP) - Zip intends to apply for special leave to appeal decisionN, fall is consistent with prevailing short term downtrend and long term trend is transitioning from up to down, a regular in ChartWatch ASX Scans Downtrends list 🔎📉
-3.8% Iluka Resources (ILU) - No news, general weakness across the broader Resources sector today, fall is consistent with prevailing short and long term downtrends, one of the most Featured (highest conviction) stocks in ChartWatch ASX Scans Downtrends list 🔎📉
-3.8% Ramelius Resources (RMS) - No news, general weakness across the broader Precious Metals sector today.
-3.6% IGO (IGO) - No news, general weakness across the broader Lithium sector today, fall is consistent with prevailing short and long term downtrends, one of the most Featured (highest conviction) stocks in ChartWatch ASX Scans Downtrends list 🔎📉
-3.4% Clarity Pharmaceuticals (CU6) - No news, fall is consistent with prevailing short and long term downtrends, a regular in ChartWatch ASX Scans Downtrends list 🔎📉
-3.4% Boss Energy (BOE) - No news, general weakness across the broader Uranium sector today, fall is consistent with prevailing short and long term downtrends, a regular in ChartWatch ASX Scans Downtrends list 🔎📉
-3.3% Paladin Energy (PDN) - No news, general weakness across the broader Uranium sector today, fall is consistent with prevailing short and long term downtrends, a regular in ChartWatch ASX Scans Downtrends list 🔎📉
-3.1% Pilbara Minerals (PLS) - No news, general weakness across the broader Lithium sector today, fall is consistent with prevailing short and long term downtrends, a regular in ChartWatch ASX Scans Downtrends list 🔎📉
Broker Moves
Adriatic Metals (ADT)
Retained at buy at Canaccord Genuity; Price Target: $4.30 from $4.75
Amplitude Energy (AEL)
Retained at add at Morgans; Price Target: $0.280
Auckland International Airport (AIA)
Retained at hold at CLSA; Price Target: NZ$6.80 from NZ$7.00
Retained at neutral at Jarden; Price Target: NZ$7.95 from NZ$8.00
Aristocrat Leisure (ALL)
Retained at buy at Bell Potter; Price Target: $83.00 from $85.00
Aurelia Metals (AMI)
Retained at buy at Ord Minnett; Price Target: $0.350 from $0.310
Andean Silver (ASL)
Retained at buy at Canaccord Genuity; Price Target: $2.85
Avjennings (AVJ)
Retained at hold at Bell Potter; Price Target: $0.660 from $0.700
Beach Energy (BPT)
Retained at hold at Morgans; Price Target: $1.550
Brightstar Resources (BTR)
Retained at buy at Shaw and Partners; Price Target: $0.040
Computershare (CPU)
Downgraded to underweight from neutral at JP Morgan; Price Target: $35.00 from $34.00
Domain Australia (DHG)
Downgraded to hold from buy at CLSA; Price Target: $4.43 from $4.20
Evolution Mining (EVN)
Retained at neutral at Citi; Price Target: $7.00 from $6.00
Genesis Minerals (GMD)
Retained at neutral at Citi; Price Target: $3.90 from $3.40
Goodman Group (GMG)
Retained at overweight at Morgan Stanley; Price Target: $37.50 from $40.82
Gentrack Group (GTK)
Retained at buy at Bell Potter; Price Target: $13.50 from $13.90
HMC Capital (HMC)
Retained at equal-weight at Morgan Stanley; Price Target: $7.35 from $12.21
IPH (IPH)
Retained at outperform at Macquarie; Price Target: $6.75
Karoon Energy (KAR)
Retained at add at Morgans; Price Target: $2.40
Kelsian Group (KLS)
Retained at sector perform at RBC Capital Markets; Price Target: $3.50
Laramide Resources (LAM)
Retained at buy at Canaccord Genuity; Price Target: $1.250
Lendlease Group (LLC)
Retained at neutral at Citi; Price Target: $7.50
Lovisa (LOV)
Retained at overweight at Morgan Stanley; Price Target: $31.50
Macquarie Group (MQG)
Retained at overweight at Morgan Stanley; Price Target: $224.00
Newmont Corporation (NEM)
Retained at buy at Citi; Price Target: $73.00
Northern Star Resources (NST)
Retained at neutral at Citi; Price Target: $20.00 from $18.00
Opthea (OPT)
Downgraded to sell from buy at Bell Potter; Price Target: $0.050 from $1.300
Paladin Energy (PDN)
Upgraded to buy from hold at Argonaut Securities; Price Target: $6.90 from $7.80
Polymetals Resources (POL)
Retained at buy at Ord Minnett; Price Target: $1.350 from $1.300
Perseus Mining (PRU)
Retained at neutral at Citi; Price Target: $3.60 from $3.20
QBE Insurance Group (QBE)
Retained at overweight at Morgan Stanley; Price Target: $25.05
Regis Resources (RRL)
Retained at neutral at Citi; Price Target: $4.10 from $3.40
Santos (STO)
Retained at hold at Morgans; Price Target: $6.90
Southern Cross Electrical Engineering (SXE)
Retained at buy at Moelis Australia; Price Target: $2.20 from $2.10
Retained at buy at PAC Partners; Price Target: $2.53 from $2.35
Retained at buy at Unified Capital Partners; Price Target: $2.83 from $2.53
Turaco Gold (TCG)
Retained at buy at Canaccord Genuity; Price Target: $0.750
Westpac Banking Corporation (WBC)
Retained at underweight at Morgan Stanley; Price Target: $27.30
Retained at hold at Morgans; Price Target: $29.01 from $27.85
Woodside Energy Group (WDS)
Retained at add at Morgans; Price Target: $30.10
Scans
Top Gainers
Code | Company | Last | % Chg |
|---|---|---|---|
| GW1 | Greenwing Resources Ltd | $0.04 | +25.00% |
| KNB | Koonenberry Gold Ltd | $0.05 | +21.95% |
| ADX | ADX Energy Ltd | $0.029 | +20.83% |
| PRS | Prospech Ltd | $0.03 | +20.00% |
| OZM | Ozaurum Resources Ltd | $0.105 | +19.32% |
Top Fallers
Code | Company | Last | % Chg |
|---|---|---|---|
| ERW | Errawarra Resources Ltd | $0.045 | -28.57% |
| WHK | Whitehawk Ltd | $0.021 | -19.23% |
| REE | RAREX Ltd | $0.017 | -19.05% |
| RGT | Argent Biopharma Ltd | $0.13 | -18.75% |
| S66 | Star Combo Pharma Ltd | $0.13 | -18.75% |
52 Week Highs
Code | Company | Last | % Chg |
|---|---|---|---|
| KNB | Koonenberry Gold Ltd | $0.05 | +21.95% |
| NMR | Native Mineral Resources Holdings Ltd | $0.105 | +15.39% |
| HOR | Horseshoe Metals Ltd | $0.019 | +11.77% |
| MHK | Metal Hawk Ltd | $0.45 | +8.43% |
| BGD | Barton Gold Holdings Ltd | $0.40 | +8.11% |
52 Week Lows
Code | Company | Last | % Chg |
|---|---|---|---|
| AQC | Australian Pacific Coal Ltd | $0.04 | -18.37% |
| THB | Thunderbird Resources Ltd | $0.011 | -15.39% |
| BEO | Beonic Ltd | $0.175 | -12.50% |
| LOT | Lotus Resources Ltd | $0.16 | -11.11% |
| ASQ | Australian Silica Quartz Group Ltd | $0.019 | -9.52% |
Near Highs
Code | Company | Last | % Chg |
|---|---|---|---|
| IAGPF | Insurance Australia Group Ltd | $105.33 | +0.19% |
| IHD | Ishares S&P/ASX DIV Opportunities Esg Screened ETF | $14.32 | +0.21% |
| OBL | Omni Bridgeway Ltd | $1.515 | +2.37% |
| BILL | Ishares Core Cash ETF | $100.78 | +0.04% |
| GLDN | Ishares Physical Gold ETF | $39.38 | -1.55% |
Relative Strength Index (RSI) Oversold
Code | Company | Last | % Chg |
|---|---|---|---|
| SLX | SILEX Systems Ltd | $3.49 | -1.69% |
| STX | Strike Energy Ltd | $0.165 | -8.33% |
| QHL | Quickstep Holdings Ltd | $0.54 | 0.00% |
| IPX | Iperionx Ltd | $2.75 | -4.51% |
| EGH | Eureka Group Holdings Ltd | $0.51 | -1.92% |
