
News | Market Wraps
Evening Wrap: ASX 200 rebounds 1% on Property, Utilities and Tech, as lithium and uranium stocks keep plunging
The S&P/ASX 200 closed 81.8 points higher, up 1.04%.

Mentioned
The S&P/ASX 200 closed 81.8 points higher, up 1.04%.
Aussie fund managers rediscovered they also had a buy button! And about time too, a tidy 1.04% to the better will no doubt provide some relief to investors who felt they were staring into the abyss at yesterday’s close.
There were still plenty of defensive themes playing out today, with economically resilient stocks across Utilities, Consumer Staples, and on an individual basis, Telstra (TLS) doing well.
All eleven major ASX sectors (plus the gold sub-index) were up, so there was plenty of love spread around, but also two glaring omissions from the buy list. Here, I note heavy falls in serial underperformers across the Lithium and Uranium sectors – with Pilbara Minerals (PLS) (-5.6%) and Paladin Energy (PDN) (-5.7%) two of the hardest hit.
Click/scroll through for the usual reporting of the major sector and stock-specific moves, the broker responses to them, as well as all the key upcoming economic data in tonight's Evening Wrap.
Also, I have detailed technical analysis on the NASDAQ Composite and the S&P/ASX 200 in today's ChartWatch.
Let's dive in!
Today in Review
Tue 01 Apr 25, 5:59pm (AEST)
Name | Value | % Chg |
|---|---|---|
Major Indices | ||
| ASX 200 | 7,925.2 | +1.04% |
| All Ords | 8,126.9 | +0.92% |
| Small Ords | 3,002.3 | +0.08% |
| All Tech | 3,363.2 | +1.33% |
| Emerging Companies | 2,230.0 | -0.32% |
Currency | ||
| AUD/USD | 0.6255 | +0.13% |
US Futures | ||
| S&P 500 | 5,648.0 | -0.09% |
| Dow Jones | 42,229.0 | -0.07% |
| Nasdaq | 19,419.75 | -0.10% |
Name | Value | % Chg |
|---|---|---|
Sector | ||
| Real Estate | 3,558.9 | +2.11% |
| Utilities | 9,231.6 | +1.91% |
| Communication Services | 1,651.7 | +1.70% |
| Information Technology | 2,293.9 | +1.50% |
| Consumer Discretionary | 3,812.6 | +1.17% |
| Materials | 16,146.7 | +1.07% |
| Energy | 8,018.4 | +0.99% |
| Consumer Staples | 11,763.5 | +0.89% |
| Financials | 8,397.4 | +0.89% |
| Health Care | 40,821.1 | +0.72% |
| Industrials | 7,793.9 | +0.44% |
Markets

ASX 200 Session Chart
The S&P/ASX 200 (XJO) finished 81.8 points higher at 7,925.2, 1.04% from its session low and smack-bang at its high. In the broader-based S&P/ASX 300 (XKO), advancers beat decliners by 168 to 107.
Yesterday I reported that all eleven major ASX sectors (plus the gold sub-index) were down – today they’re all up. Aussie fund managers rediscovered they also had a buy button! And about time too, a tidy 1.04% to the better will no doubt provide some relief to investors who felt they were staring into the abyss at yesterday’s close.
But, as good as today’s 81-point gain was, it’s less than three-fifths of yesterday's decline. There’s still plenty of damage done this week, and over the past 6-and-a-bit weeks since the Valentine’s Day peak.
Also consider that yesterday's market breadth in the ASX 300 was 24 up to 266 down. Today’s: 168 to 107. There were plenty of stocks omitted from today’s recovery.
And such is the nature of the market we’re in – where nervousness and uncertainty reign supreme!
When nerves are frayed, fund managers tend to play defence. They’ll favour low-PE or “value” over high-PE momentum, they’ll look to park some of the cash that keeps rolling in due to our superannuation system in economically resilient sectors and stocks – it’s certainly been the case over the last few weeks.
There were still plenty of defensive themes playing out today, I note Utilities (XUJ) (+1.9%) and Consumer Staples (XSJ) (+0.9%) did well, as did Communication Services (XTJ) (+1.7%). The latter is an interesting one. I like to call it the Telstra Group (ASX: TLS) (+1.4%) index because TLS has such an influential weighting (to be fair, beaten down influential high-PE variants in the index like Car Group (ASX: CAR) (+3.7%) and REA Group (ASX: REA) (+2.1%) also saw nice bounces today). TLS is the classic go-to defensive stock. It’s usually fair to say that if TLS is doing well, the market is probably in a state of flux.
%20daily%20chart%201%20April%202025.png)
Telstra (TLS) chart (click here for full size image)
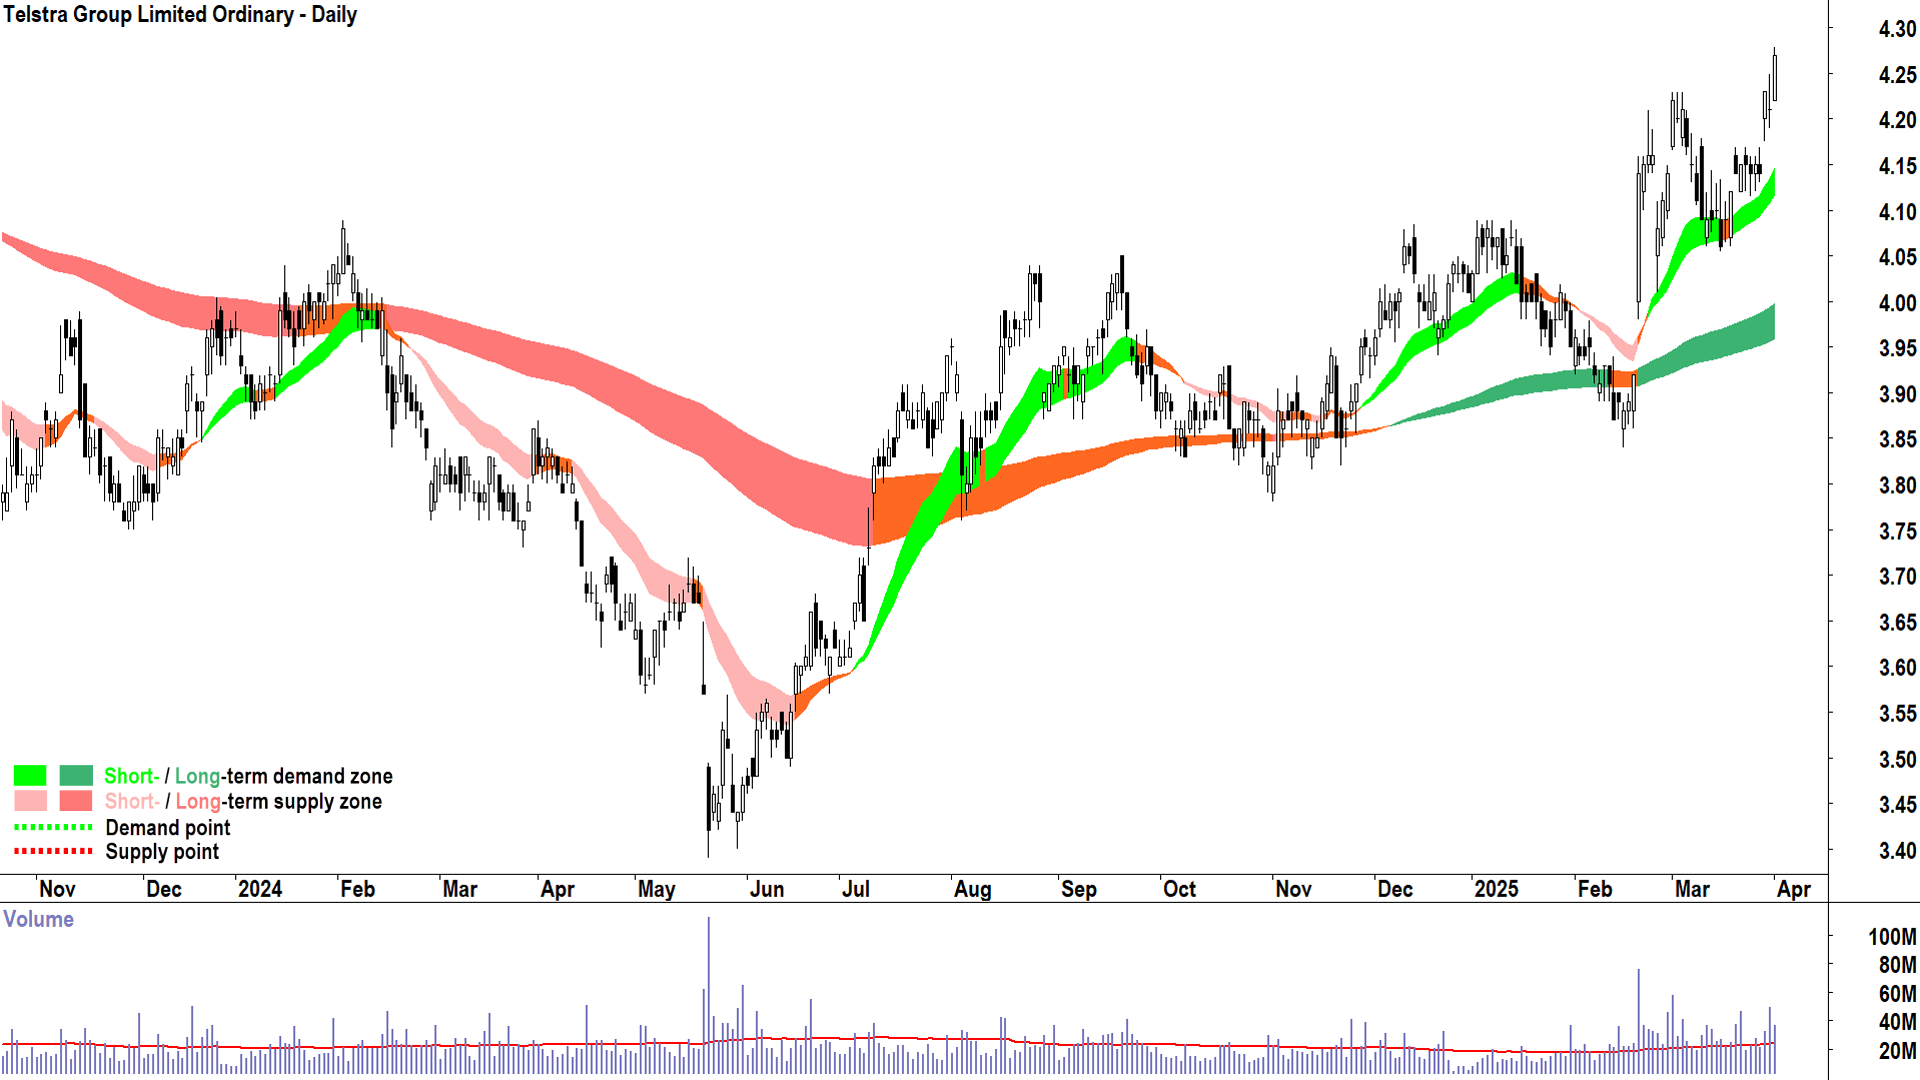
I recently ran TLS as a Feature Chart in my ChartWatch ASX Scans list on 20-Feb after it’s well received first half results – I am a sucker for a big white candle on massive volume! There’s been a dividend since (that’s the dip on 26-Feb), and a modest pullback to the short term uptrend ribbon – but otherwise I can see a strong set of trends, price action and candles – well, compared to the rest-of-the-market-not-including-gold-stocks that is!
It’s just an example of how one can look to play defence in a defensive environment, and it’s probably what the funds are most likely to continue to do until this trade war stuff blows over.
Apart from defence, the best performing sectors today largely had a bond proxy or interest rate sensitive feel to them. I note Real Estate Investment Trusts (XPJ) (+2.2%) was the best performing sector despite the four top gainers Charter Hall Group (ASX: CHC) (+3.7%), Goodman Group (ASX: GMG) (+2.7%), Stockland (ASX: SGP) (+2.2%), and GPT Group (ASX: GPT) (+2.1%) not releasing a single item of news among them (i.e., the big moves now aren't about news…it’s about sector rotations!).
Also doing well was Information Technology (XIJ) (+1.5%), another substantially interest rate sensitive sector as it desperately loves lower the discount rates afforded to it by lower risk-free yields. We noted in yesterday’s Evening Wrap the big drop in risk-free yields since Friday (and they were slightly lower again today).
As mentioned earlier, all sectors were up, but recent shoot-the-lights-out Gold (XGD) (+0.49%) took a bit of a breather today, and serial 2025 underperformer Health Care (XHJ) (+0.72%) also lagged. Health's underperformance is a bit unusual considering it’s supposed to be defensive, but my contention through this whole correction is that it's been lumped in with the high-PE basket.
Resources (XJR) (+1.2%) and Energy (XEJ) (+1.0%) were roughly middle of the pack, probably also deserving an an underperform label considering these two were hit the hardest yesterday.
In Resources, I note several lithium stocks like Liontown Resources (ASX: LTR) (-6.4%), Pilbara Minerals (ASX: PLS) (-5.6%), and IGO (ASX: IGO) (-1.8%) copped it again – and again not a skerrick of news among them.
Lithium prices were roughly flat today – so it’s not that. Instead, I suggest it’s a broader realisation here that the cost curve is shifting down…permanently.
%20daily%20chart%201%20April%202025.png)
Pilbara Minerals (PLS) chart = 32 x Feature Downtrend 📉 (click here for full size image)
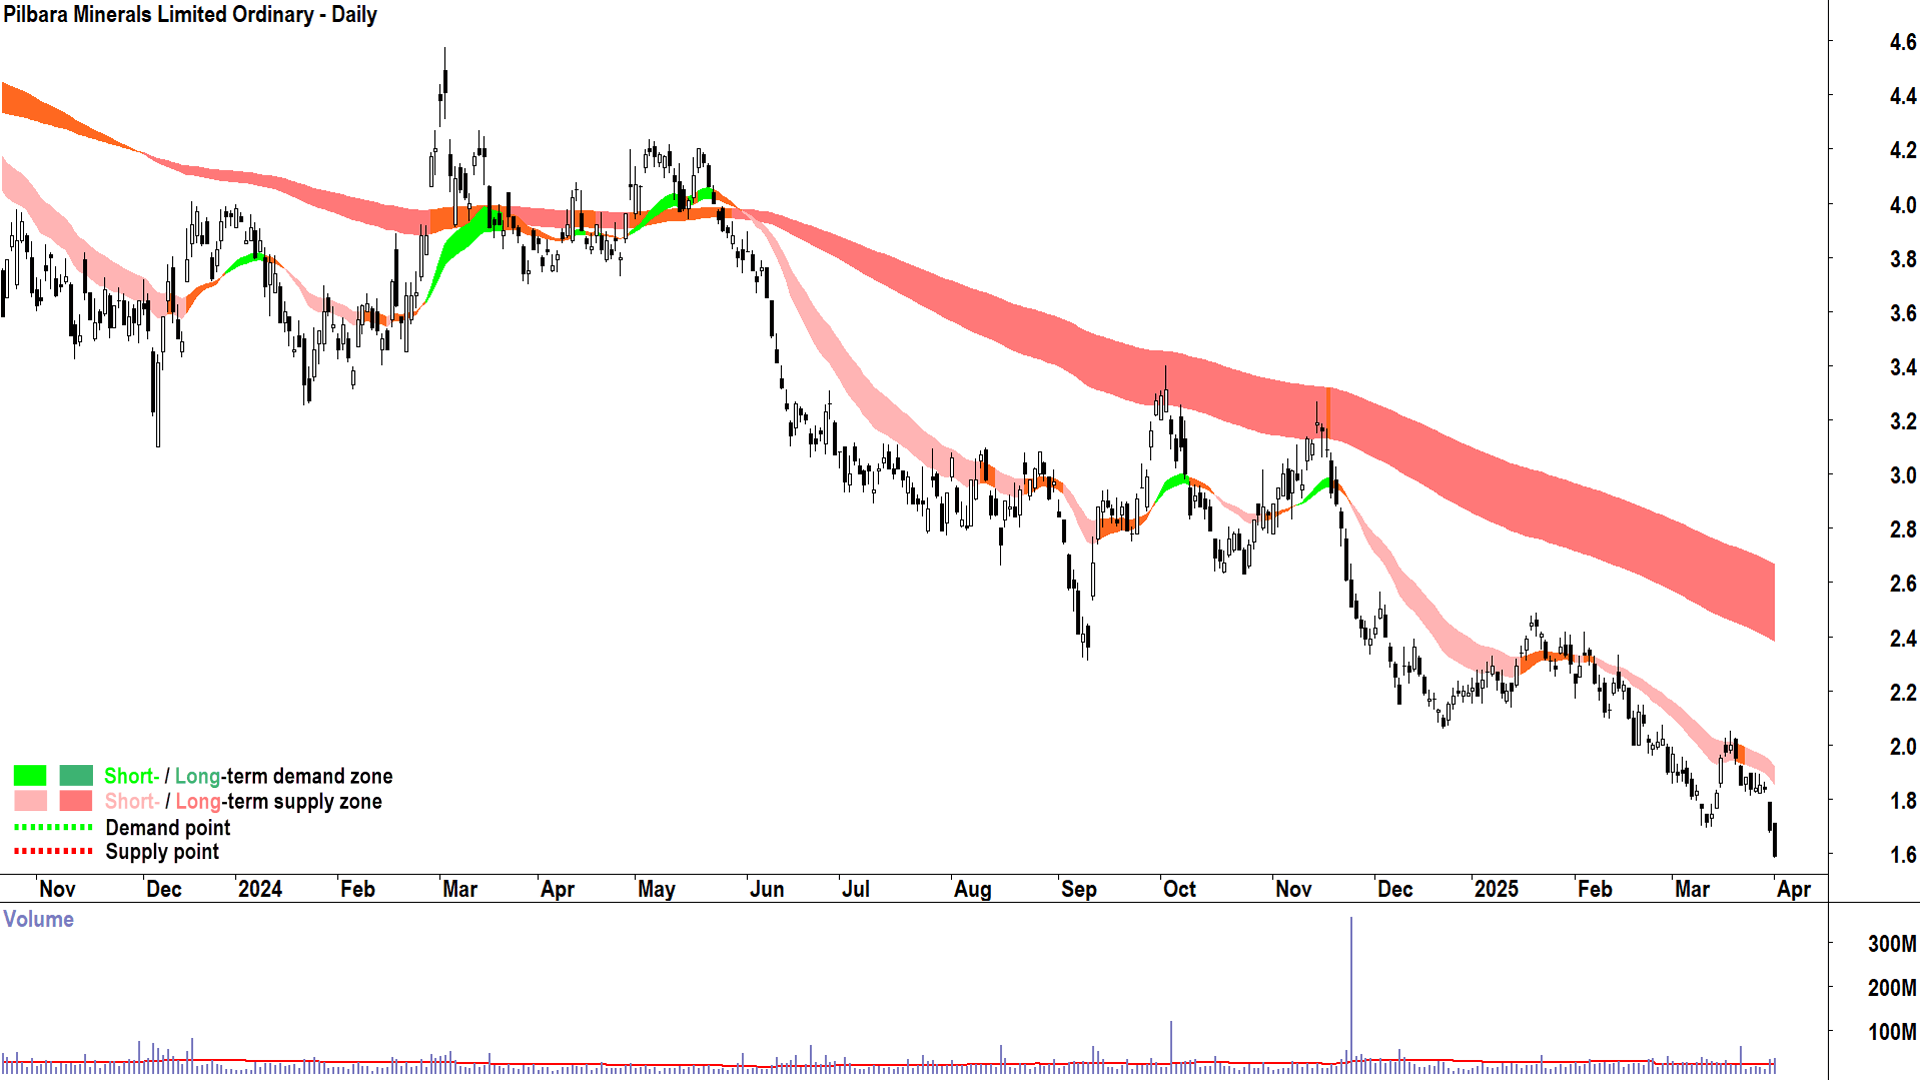
Not that cost curves and company fundamentals mean anything to me – mind you – those three have some of the best short and long term downtrends on the entire ASX. That’s all I care about, and that’s why they’ve been three of my most Featured Downtrends in ChartWatch ASX Scans.
While there were few mysteries in lithium, uranium stocks were a greater conundrum. They were about the only sector of the Aussie stock market that was spared the rod yesterday – again no news and no underlying commodity price move.
Today it was a total about-face. In terms of their performance, that is – because again, no news among sector consituents, and uranium futures were actually a touch higher last night. Go figure 🤔.
%20daily%20chart%201%20April%202025.png)
Paladin Energy (PDN) chart = 20 x Feature Downtrend 📉 (click here for full size image)
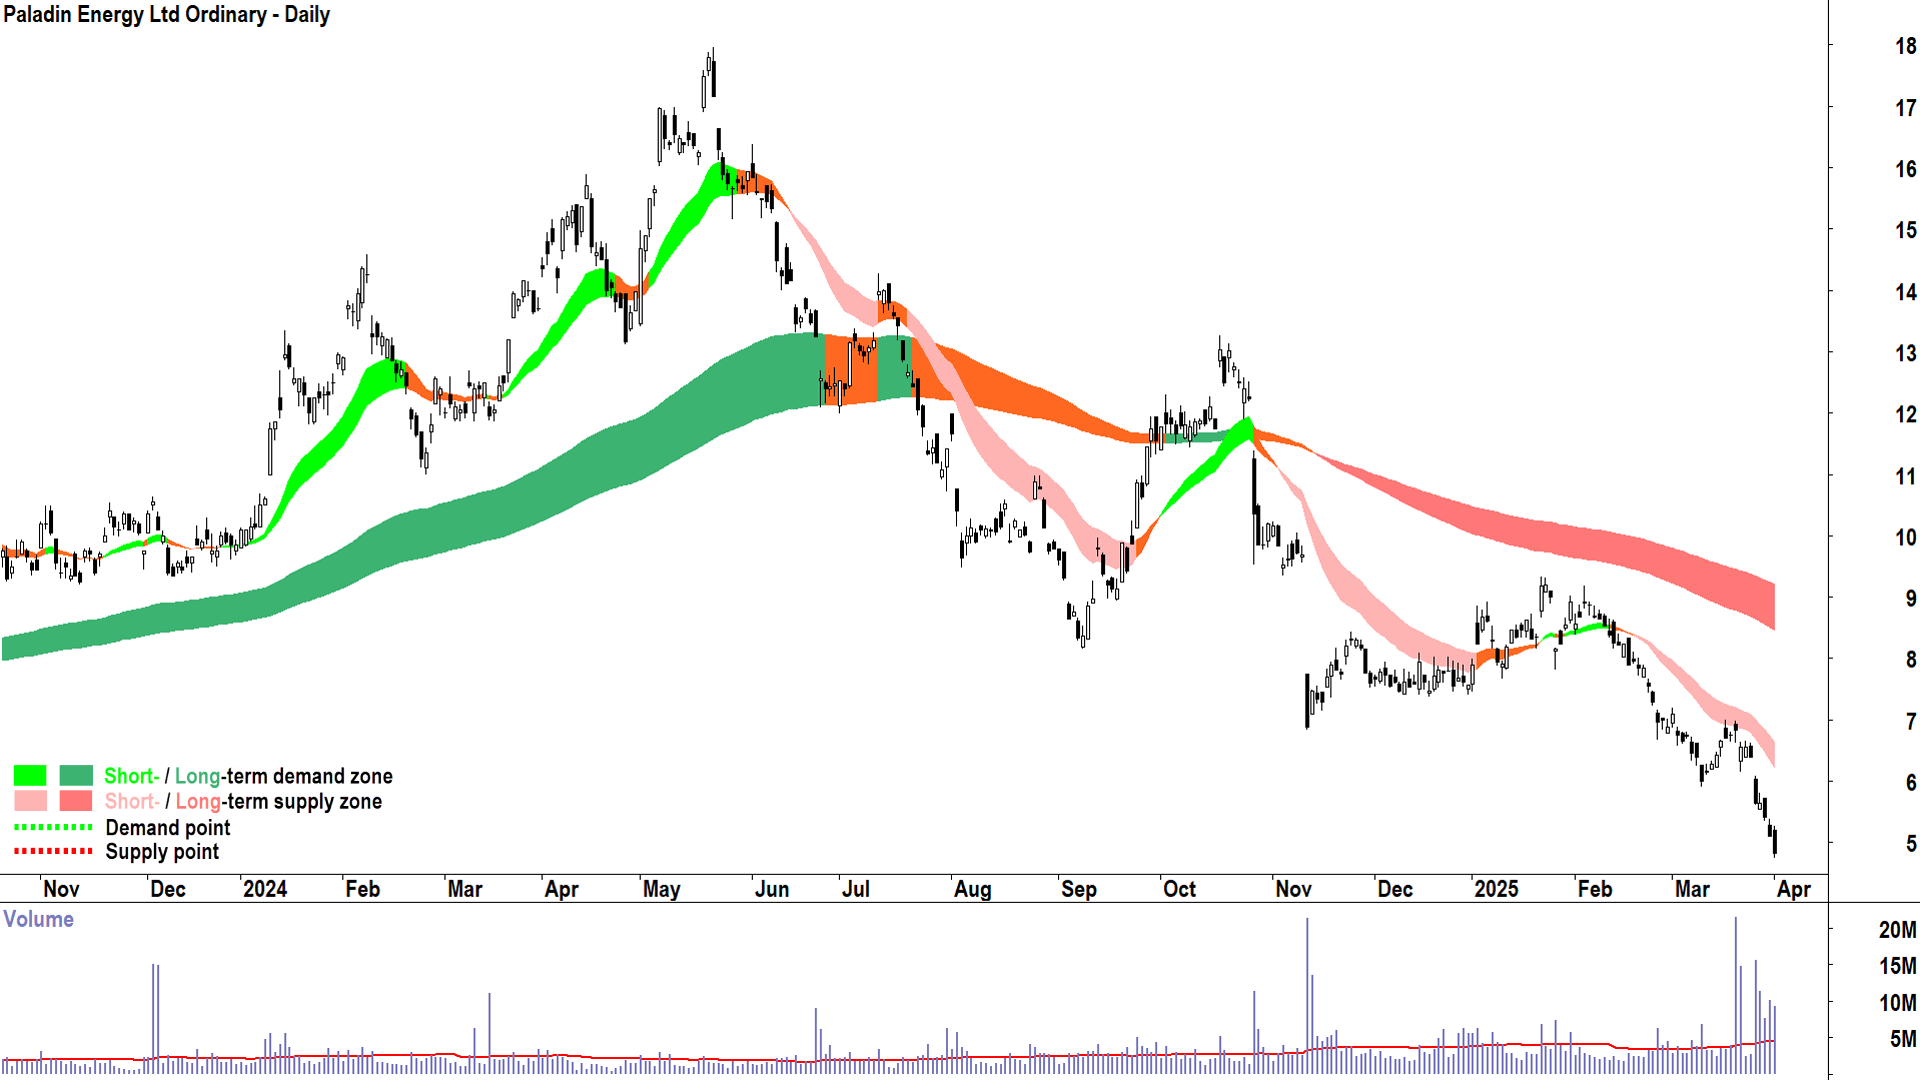
Either way, Bannerman Energy (ASX: BMN) (-9.8%), Deep Yellow (ASX: DYL) (-7.5%), Paladin Energy (ASX: PDN) (-5.7%), and Boss Energy (ASX: BOE) (-4.0%) were absolutely smashed today. It’s no coincidence that these four are also regulars in my ChartWatch ASX Scans Featured Downtrends.
ChartWatch
NASDAQ Composite Index

A wall of demand shortly after the open 🧐 (click here for full size image)
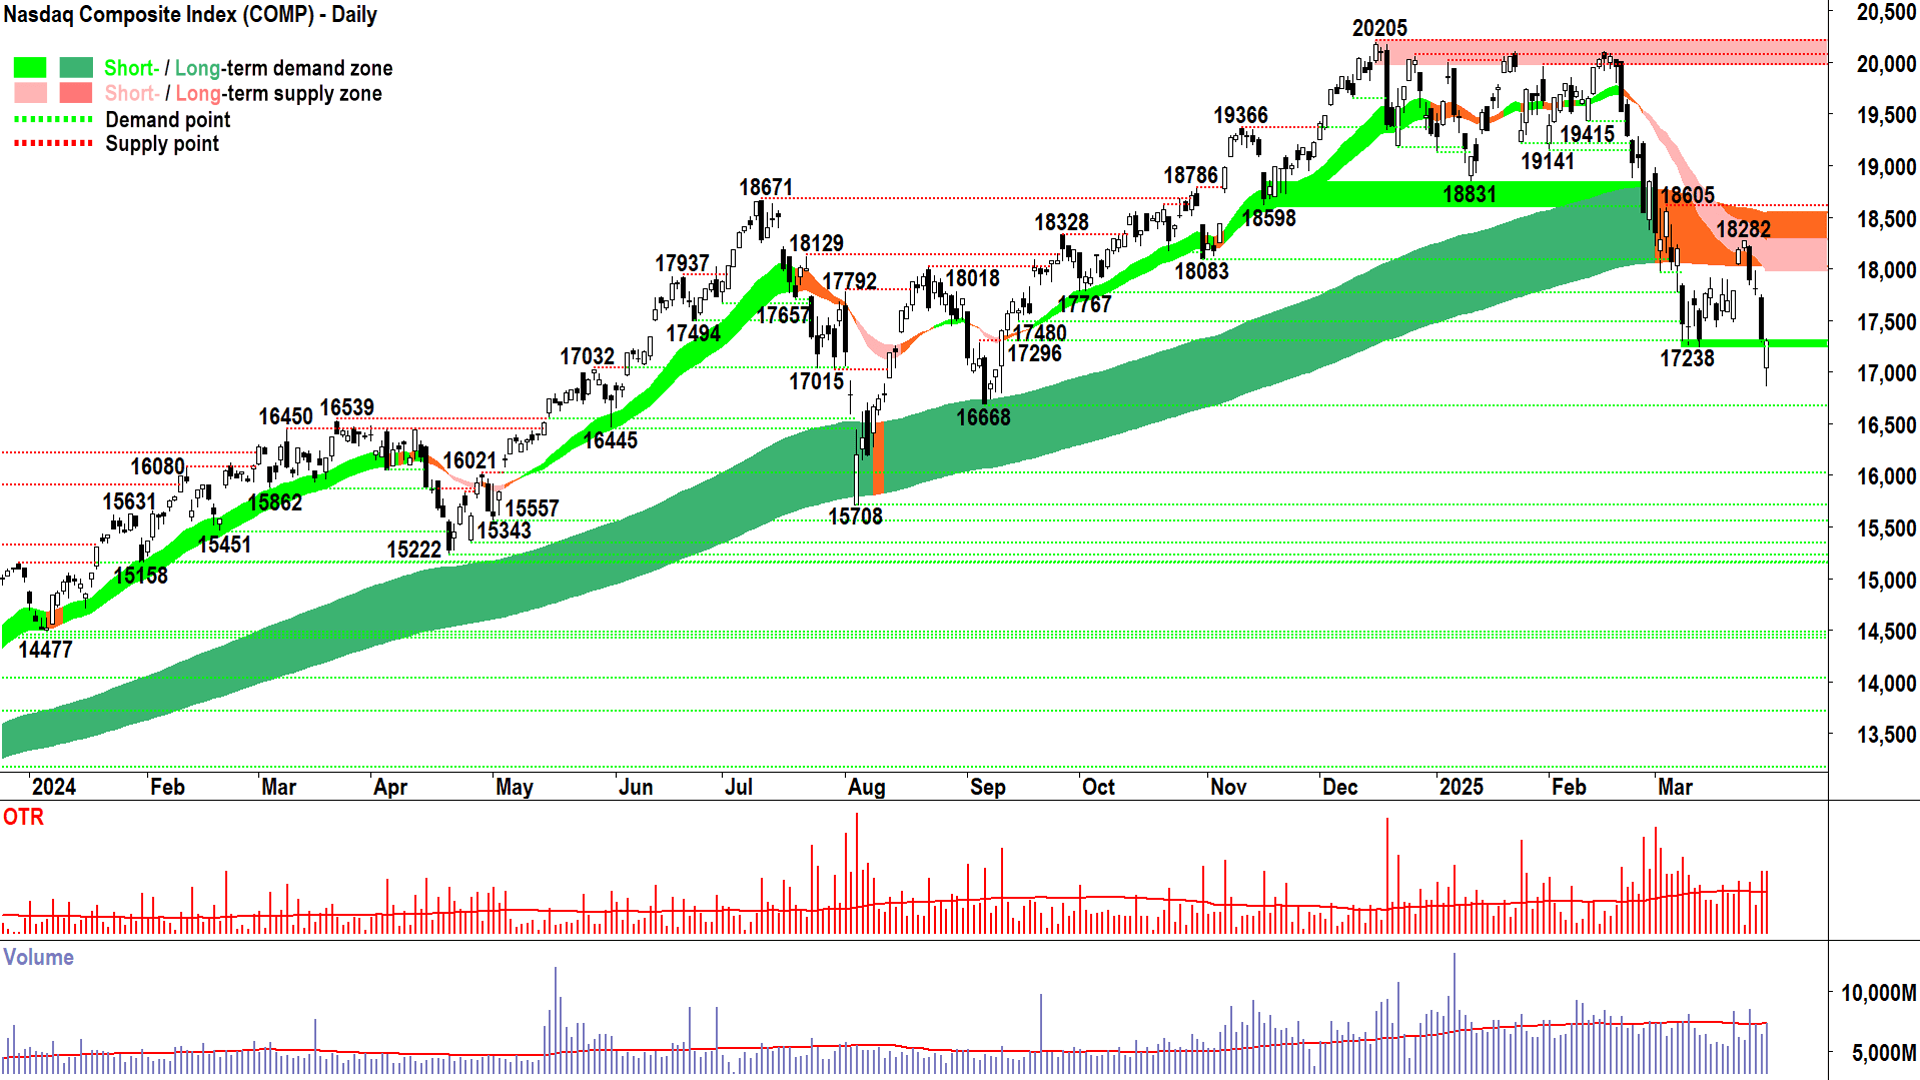
A very solid demand-side candle on Monday – the utter and complete opposite to Friday’s wipeout!
But are you surprised? 🤔
This is exactly what we can expect from the current state of market equilibrium – a major arm wrestle for control between demand and supply-side participants.
Shorts like to cash in during downtrends just as much as longs like to take profits every now and then in uptrends. Last night we saw the shorts take some of their risk off the table. Good luck to them 💰.
Volume was decent – or average anyway – so I suggest there was at least some positional buying among the mix also.
Either way, the candle – and more importantly the location – suggests that the bulls are hanging on for now.
We tested the point of no return at 17238 – we even went over its edge – but we came back to close just above it at 17299. It’s a slender hold – but a hold all the same.
Whilst last night’s heroics are impressive, it still doesn’t change the broader short term trend – down – and the long term trend – neutral / whisker away from being down.
So, a cautious approach is still the best choice. Because you can expect more volatility. You can expect more zebra-style candles (⬛⬜⬛⬜⬛⬜!).
But it’s all good. Trend traders who’ve been here before understand they must be operating at their most conservative risk setting – it has been the case for several weeks now as pointed out here – and it will continue to be so until a clear trend up or down is established.
Watch tonight for a follow through from the demand-side, or if the supply-side moves in during an early session rally to re-exert their influence – this will create the tell-tale upward pointing shadow.
That's the bearish case. The bullish case is if the demand-side can hold steady until the close and log another strong candle like Monday's. That would stamp last night's low of 16854 as a critical point of demand – replacing 17238 as the new point of no return!
S&P/ASX 200 (XJO)
%20chart%201%20April%202025.png)
Good, but needs to be better! 🤏 (click here for full size image)
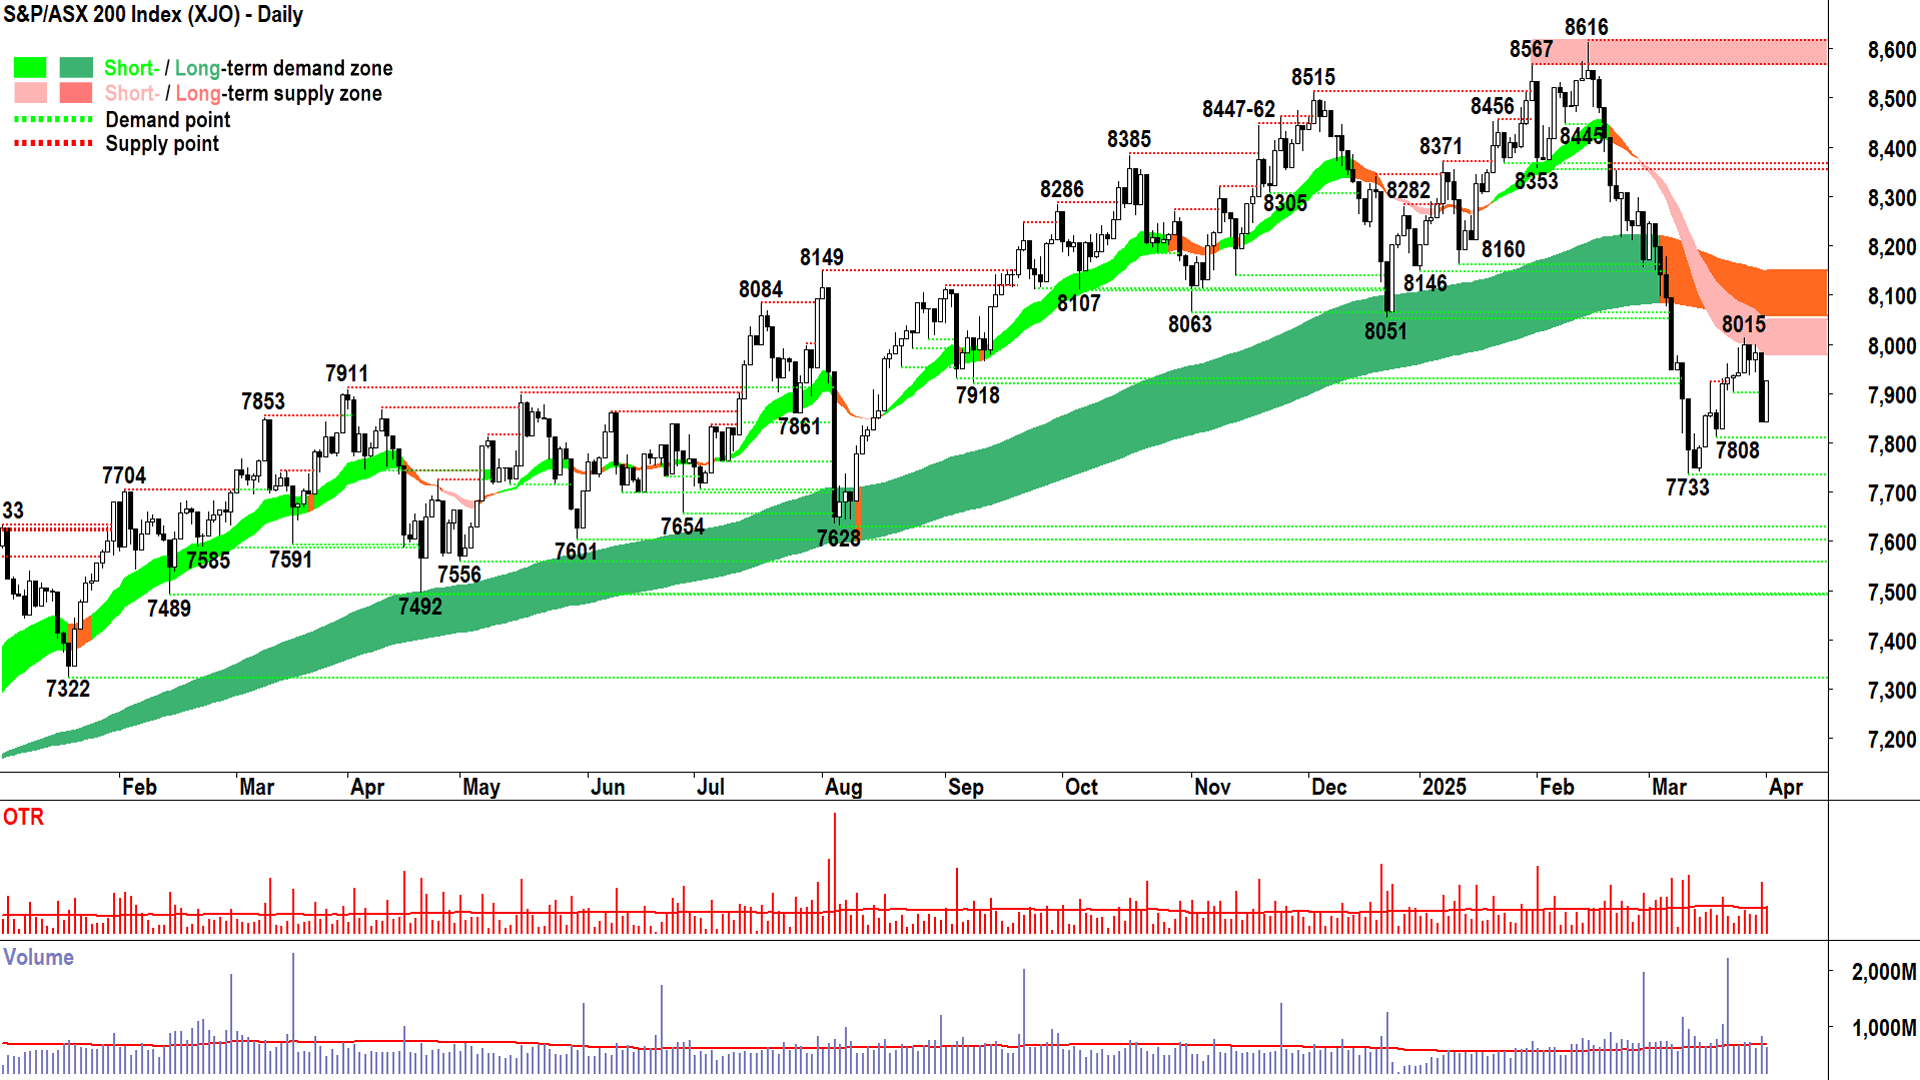
Good today, but it needed to, and it needs to be better.
The dynamic supply of the short and long term uptrend ribbons remains the elephant in the room for the XJO. Nothing much has really changed here for me – we must deal with that zone – we must close back above it.
Otherwise, it’s going to be more of this uncertain grind. Sometimes up like today, sometimes down like Friday, but more often than not lurching sideways until the trade war is but a distant memory!
7808 and then 7733 are the key points of demand, versus the top of the long term uptrend, presently 8148.
Economy
Today
11:30 AUS RBA Cash Rate
Official cash rate: No change at 4.10% as forecast
Hawkish Statement Commentary:
February's statement noted that underlying inflation was moderating more quickly than anticipated, providing the Board with increased confidence. In contrast, April's release indicated that while inflation continued to ease in line with forecasts, the Board remained cautious about the outlook due to persistent labor market tightness and high unit labor costs.
The February release highlighted weak output growth and uncertainties surrounding household spending recovery. By April, there were signs of private domestic demand recovery and improved real household incomes, though challenges in passing cost increases to prices persisted.
Dovish Statement Commentary:
The April release specifically mentioned recent U.S. tariff announcements impacting global confidence and the potential for adverse effects on global activity if trade tensions escalated.
Conclusion: As usual, this RBA board likes to have a leg on both sides of the fence! They want us to think they could go either way (so we don't go all crazy and re-stoke inflation), but we all know the next move is likely down. Markets are still factoring one 0.25% p.a. cut by July (most likely at the next, May meeting) and one more before the end of the year.
Later this week
Tuesday
22:00 USA ISM Manufacturing PMI March (49.6 forecast, unchanged from February)
22:00 USA JOLTS Job Openings February (7.73 million forecast vs 7.74 million in February)
Wednesday
08:30 AUS Building Approvals February (1.4% forecast vs +6.3% in January)
Thursday
All day OPEC+ Meetings
09:45 CHN Caixin Services PMI March (51.5 forecast vs 51.4 in February)
22:00 USA ISM Services PMI February (53.0 forecast vs 53.0 in February)
Friday
All Day Chinese Bank Holiday
20:30 USA Non-Farm Payrolls Data March
Employment Change: +139,000 forecast vs +151,000 in February
Average Hourly Earnings: +0.3% forecast, unchanged from February
Unemployment Rate: 4.1%, unchanged from February
23:25 USA Federal Reserve Chairman Jerome Powell speech
Latest News
Interesting Movers
Trading higher
+10.3% Rox Resources (RXL) - No news since 31-Mar Youanmi High Grade Gold Hits Continue, rise is consistent with prevailing short and long term uptrends, a regular in ChartWatch ASX Scans Uptrends list 🔎📈
+9.6% Southern Cross Electrical Engineering (SXE) - Investor Presentation - Acquisition of Force Fire Holdings, rise is consistent with prevailing short and long term uptrends, added to ChartWatch ASX Scans Uptrends list yesterday 🔎📈
+8.3% Black Cat Syndicate (BC8) - Kal East - Processing Commenced at Lakewood, rise is consistent with prevailing short and long term uptrends, a regular in ChartWatch ASX Scans Uptrends list 🔎📈
+8.3% Avjennings (AVJ) - AVJennings enters into Scheme Implementation Deed with AVID.
+5.8% Helia Group (HLI) - No news 🤔.
+3.7% Charter Hall Group (CHC) - No news, general strength across the broader Real Estate sector today.
+3.7% Car Group (CAR) - No news, general strength across the broader Communication Services sector today.
+3.4% Vaneck Australian Property ETF (MVA) - No news, general strength across the broader Real Estate sector today (sector ETF).
+3.2% Meeka Metals (MEK) - No news since 31-Mar Murchison Development Update - March 2025, rise is consistent with prevailing short and long term uptrends, a regular in ChartWatch ASX Scans Uptrends list 🔎📈
Trading lower
-9.8% Bannerman Energy (BMN) - No news, general weakness across the broader Uranium sector today, fall is consistent with prevailing short and long term downtrends, a regular in ChartWatch ASX Scans Downtrends list 🔎📉
-9.4% Andean Silver (ASL) - Cerro Bayo Resource increases by 22 per cent to 111Moz.
-7.5% Deep Yellow (DYL) - No news, general weakness across the broader Uranium sector today, fall is consistent with prevailing short and long term downtrends, a regular in ChartWatch ASX Scans Downtrends list 🔎📉
-6.4% Liontown Resources (LTR) - No news, general weakness across the broader Lithium sector today, fall is consistent with prevailing short and long term downtrends, a regular in ChartWatch ASX Scans Downtrends list 🔎📉
-5.7% Firefly Metals (FFM) - No news, general weakness across the broader Copper sector today.
-5.7% Paladin Energy (PDN) - No news, general weakness across the broader Uranium sector today, fall is consistent with prevailing short and long term downtrends, a regular in ChartWatch ASX Scans Downtrends list 🔎📉
-5.6% Pilbara Minerals (PLS) - No news, general weakness across the broader Lithium sector today, fall is consistent with prevailing short and long term downtrends, a regular in ChartWatch ASX Scans Downtrends list 🔎📉
-4.9% Appen (APX) - Ceasing to be a substantial holder from MUFG, fall is consistent with prevailing short and long term downtrends, a regular in ChartWatch ASX Scans Downtrends list 🔎📉
-4.9% Neuren Pharmaceuticals (NEU) - No news, fall is consistent with prevailing short and long term downtrends, a regular in ChartWatch ASX Scans Downtrends list 🔎📉
-4.3% Metals Acquisition (MAC) - No news, general weakness across the broader Copper sector today, fall is consistent with prevailing short and long term downtrends, a regular in ChartWatch ASX Scans Downtrends list 🔎📉
-4.1% Kelsian Group (KLS) - No news, fall is consistent with prevailing short and long term downtrends, one of the most Featured (highest conviction) stocks in ChartWatch ASX Scans Downtrends list 🔎📉
-4.0% Boss Energy (BOE) - No news, general weakness across the broader Uranium sector today, fall is consistent with prevailing short and long term downtrends, a regular in ChartWatch ASX Scans Downtrends list 🔎📉
-3.9% James Hardie Industries (JHX) - Change in substantial holding, fall is consistent with prevailing short and long term downtrends, a regular in ChartWatch ASX Scans Downtrends list 🔎📉
-3.6% Cettire (CTT) - No news, fall is consistent with prevailing short and long term downtrends, a regular in ChartWatch ASX Scans Downtrends list 🔎📉
-3.5% HMC Capital (HMC) - HMCCP I Declares $300m Distribution and Launch of HMCCP II, fall is consistent with prevailing short term downtrend and long term trend is transitioning from up to down, a regular in ChartWatch ASX Scans Downtrends list 🔎📉
-3.4% Iperionx (IPX) - IperionX Receives EXIM Bank Board Approval for a US$11M Loan, fall is consistent with prevailing short term downtrend and long term trend is transitioning from up to down, a regular in ChartWatch ASX Scans Downtrends list 🔎📉
Broker Moves
29METALS (29M)
Retained at underperform at CLSA; Price Target: $0.130 from $0.140
Retained at equal-weight at Morgan Stanley; Price Target: $0.230
Amplitude Energy (AEL)
Retained at outperform at Macquarie; Price Target: $0.280 from $0.300
Auckland International Airport (AIA)
Retained at buy at Citi; Price Target: NZ$9.80
Retained at outperform at Macquarie; Price Target: NZ$8.69 from NZ$9.14
Aeris Resources (AIS)
Retained at buy at Bell Potter; Price Target: $0.330 from $0.300
APA Group (APA)
Retained at outperform at Macquarie; Price Target: $8.14
ASX (ASX)
Retained at underweight at Morgan Stanley; Price Target: $56.15
Retained at sell at UBS; Price Target: $66.00
Accent Group (AX1)
Retained at buy at Citi; Price Target: $2.57
Bellevue Gold (BGL)
Retained at outperform at RBC Capital Markets; Price Target: $1.900
BHP Group (BHP)
Retained at overweight at Morgan Stanley; Price Target: $48.50
Boss Energy (BOE)
Retained at equal-weight at Morgan Stanley; Price Target: $2.95
Car Group (CAR)
Retained at buy at Citi; Price Target: $42.00 from $43.40
De Grey Mining (DEG)
Retained at sector perform at RBC Capital Markets; Price Target: $2.20 from $2.10
Deterra Royalties (DRR)
Retained at equal-weight at Morgan Stanley; Price Target: $3.90
Evolution Mining (EVN)
Retained at equal-weight at Morgan Stanley; Price Target: $5.95
Retained at underperform at RBC Capital Markets; Price Target: $5.50 from $5.40
Fortescue (FMG)
Retained at equal-weight at Morgan Stanley; Price Target: $18.15
Gold Road Resources (GOR)
Retained at sector perform at RBC Capital Markets; Price Target: $2.50 from $2.40
Healius (HLS)
Retained at hold at Morgans; Price Target: $1.320 from $1.350
Hansen Technologies (HSN)
Initiated at buy at Moelis Australia; Price Target: $6.00
IGO (IGO)
Retained at underweight at Morgan Stanley; Price Target: $3.85
Iluka Resources (ILU)
Retained at equal-weight at Morgan Stanley; Price Target: $4.45
Incitec Pivot (IPL)
Upgraded to buy from accumulate at Ord Minnett; Price Target: $3.45
James Hardie Industries (JHX)
Retained at neutral at Macquarie; Price Target: $40.20 from $44.00
Lunnon Metals (LM8)
Retained at buy at Shaw and Partners; Price Target: $0.600
Light & Wonder (LNW)
Retained at buy at Bell Potter; Price Target: $197.00 from $205.00
Retained at buy at Citi; Price Target: $200.00
Lynas Rare Earths (LYC)
Retained at underweight at Morgan Stanley; Price Target: $5.65
Meeka Metals (MEK)
Retained at buy at Morgans; Price Target: $0.250 from $0.230
Mineral Resources (MIN)
Retained at overweight at Morgan Stanley; Price Target: $50.00
Medallion Metals (MM8)
Retained at buy at Morgans; Price Target: $0.410 from $0.320
Megaport (MP1)
Initiated at overweight at Jarden; Price Target: $10.67
Nickel Industries (NIC)
Retained at overweight at Morgan Stanley; Price Target: $1.000
Northern Star Resources (NST)
Retained at equal-weight at Morgan Stanley; Price Target: $18.40
Retained at sector perform at RBC Capital Markets; Price Target: $21.50
Paladin Energy (PDN)
Retained at buy at Bell Potter; Price Target: $6.30 from $11.00
Retained at overweight at Morgan Stanley; Price Target: $10.00
Pilbara Minerals (PLS)
Retained at overweight at Morgan Stanley; Price Target: $2.75
Rio Tinto (RIO)
Retained at overweight at Morgan Stanley; Price Target: $126.00
Ramelius Resources (RMS)
Retained at sector perform at RBC Capital Markets; Price Target: $2.60 from $2.80
Regis Resources (RRL)
Retained at equal-weight at Morgan Stanley; Price Target: $3.35
Retained at outperform at RBC Capital Markets; Price Target: $4.40 from $4.30
South32 (S32)
Retained at overweight at Morgan Stanley; Price Target: $3.85
St Barbara (SBM)
Retained at sector perform at RBC Capital Markets; Price Target: $0.300
Sandfire Resources (SFR)
Retained at underweight at Morgan Stanley; Price Target: $9.25
Select Harvests (SHV)
Retained at buy at Bell Potter; Price Target: $5.80
Santana Minerals (SMI)
Retained at outperform at RBC Capital Markets; Price Target: $0.750
Super Retail Group (SUL)
Retained at buy at Citi; Price Target: $18.00
Southern Cross Gold (SX2)
Retained at outperform at RBC Capital Markets; Price Target: $4.80 from $4.50
Southern Cross Electrical Engineering (SXE)
Retained at buy at Bell Potter; Price Target: $2.50 from $2.30
Retained at buy at Shaw and Partners; Price Target: $2.40 from $2.25
Syrah Resources (SYR)
Retained at equal-weight at Morgan Stanley; Price Target: $0.200
Vault Minerals (VAU)
Retained at sector perform at RBC Capital Markets; Price Target: $0.500
Westpac Banking Corporation (WBC)
Retained at hold at CLSA; Price Target: $29.10 from $29.80
Retained at underweight at JP Morgan; Price Target: $28.00
Westgold Resources (WGX)
Retained at outperform at RBC Capital Markets; Price Target: $3.90 from $3.80
Whitehaven Coal (WHC)
Retained at overweight at Morgan Stanley; Price Target: $8.05
Wisetech Global (WTC)
Upgraded to outperform from sector perform at RBC Capital Markets; Price Target: $110.00 from $115.00
Scans
Top Gainers
Code | Company | Last | % Chg |
|---|---|---|---|
| WHK | Whitehawk Ltd | $0.026 | +225.00% |
| JLL | Jindalee Lithium Ltd | $0.33 | +37.50% |
| OZM | Ozaurum Resources Ltd | $0.088 | +35.39% |
| EGR | Ecograf Ltd | $0.355 | +24.56% |
| NXM | Nexus Minerals Ltd | $0.085 | +23.19% |
Top Fallers
Code | Company | Last | % Chg |
|---|---|---|---|
| CRS | Caprice Resources Ltd | $0.059 | -31.40% |
| SUM | Summit Minerals Ltd | $0.055 | -26.67% |
| G11 | G11 Resources Ltd | $0.011 | -21.43% |
| EMU | EMU NL | $0.028 | -20.00% |
| BEZ | Besra Gold Inc | $0.039 | -18.75% |
52 Week Highs
Code | Company | Last | % Chg |
|---|---|---|---|
| WHK | Whitehawk Ltd | $0.026 | +225.00% |
| AAR | Astral Resources NL | $0.175 | +12.90% |
| AS1 | Asara Resources Ltd | $0.045 | +12.50% |
| BKY | Berkeley Energia Ltd | $0.60 | +11.11% |
| RXL | ROX Resources Ltd | $0.375 | +10.29% |
52 Week Lows
Code | Company | Last | % Chg |
|---|---|---|---|
| G11 | G11 Resources Ltd | $0.011 | -21.43% |
| EOF | Ecofibre Ltd | $0.021 | -16.00% |
| AVG | Australian Vintage Ltd | $0.11 | -15.39% |
| CPO | Culpeo Minerals Ltd | $0.013 | -13.33% |
| HCH | Hot Chili Ltd | $0.535 | -12.30% |
Near Highs
Code | Company | Last | % Chg |
|---|---|---|---|
| BILL | Ishares Core Cash ETF | $100.74 | 0.00% |
| GLDN | Ishares Physical Gold ETF | $40.00 | +1.32% |
| GXLD | Global X Gold Bullion ETF | $50.15 | +1.46% |
| AIZ | Air New Zealand Ltd | $0.565 | -1.74% |
| MM8 | Medallion Metals Ltd | $0.275 | +7.84% |
Relative Strength Index (RSI) Oversold
Code | Company | Last | % Chg |
|---|---|---|---|
| XYZ | Block, Inc | $86.32 | -0.17% |
| WNX | Wellnex Life Ltd | $0.41 | -10.87% |
| AMP | AMP Ltd | $1.22 | -1.22% |
| RWC | Reliance Worldwide Corporation Ltd | $4.46 | -0.22% |
| LPGD | Loftus Peak Global Disruption Active ETF | $4.79 | +0.21% |
