ChartWatch ASX Scans: Domino's Pizza is cooked... CSL is on life support... But these small and big gold stocks are sizzling!
Your daily dose of the most interesting uptrends and downtrends on the ASX with technical analysis from an expert.


Source: Shutterstock
Mentioned
KEY POINTS
- Interesting uptrends in today's Scans: Aeris Resources (AIS), Activeport (ATV), Ausgold (AUC), Benz Mining (BNZ), Catapult (CAT), Evolution Mining (EVN), Genesis Minerals (GMD), Gateway Mining (GML), Nexgen Energy (NXG), Copper Miners ETF (WIRE).
- Interesting downtrends in today's Scans: Appen (APX), Avita Medical (AVH), Accent Group (AX1), Boss Energy (BOE), CSL (CSL), DigiCo (DGT), Domino's Pizza (DMP), Kogan.Com (KGN), Nickel Industries (NIC), QBE (QBE), Ramsay Health Care (RHC), Telix (TLX).
There are two Feature Charts I'd like to point out in today's Ed. The general concept I want to explore is "picking a bottom" 🎯.
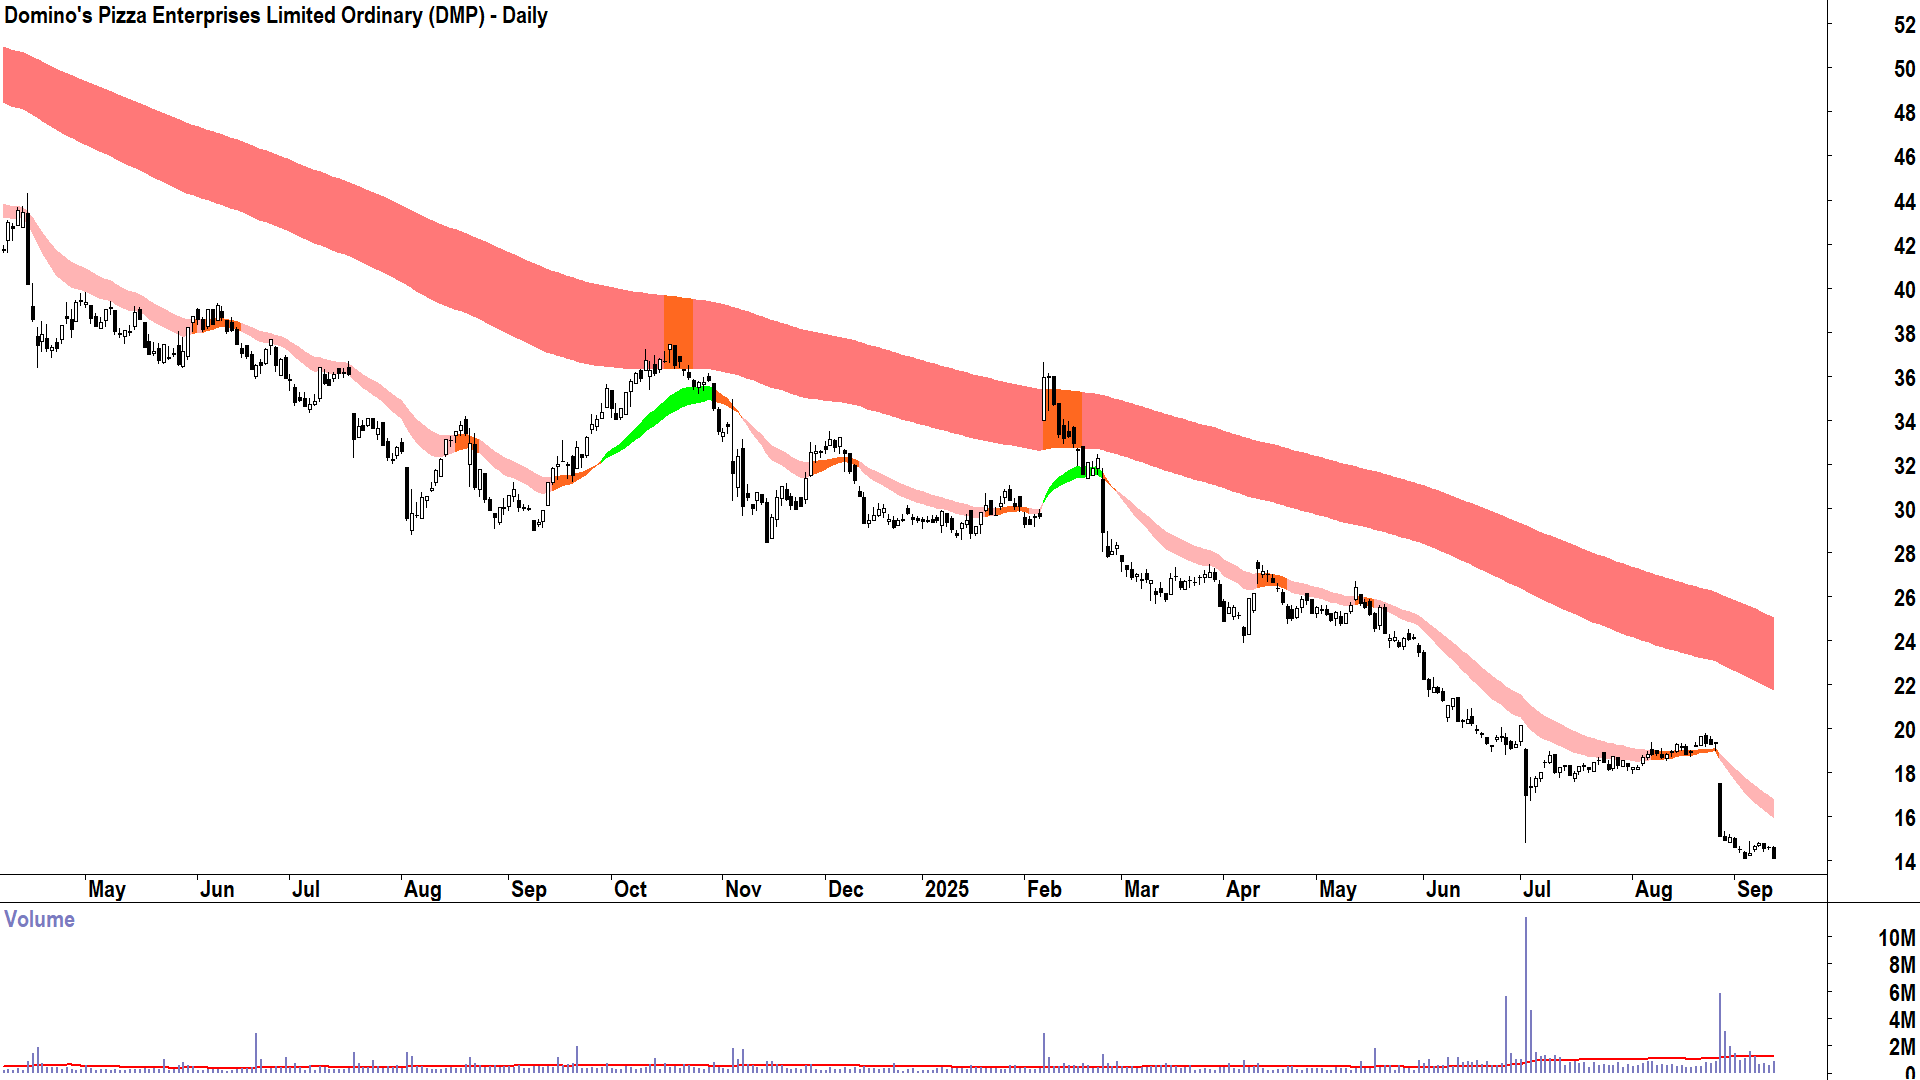
EXHIBIT 1: DOMINO'S PIZZA ENTERPRISES (DMP)
(Scroll down to the Feature Downtrends for its chart! 👇)
If only there was a way for mum and dad investors to tell in advance something wasn't quite right with the Domino's... 🤔
Ok, as you no doubt know re the statement above – my tongue is firmly wedged in the side of my cheek! DMP has been a Feature Downtrend here in ChartWatch ASX Scans 54 times since this series started back in late-June 2024. It's the second most Featured Downtrend in the history of ChartWatch (FYI, Coronado Global Resources (CRN) is the most featured with 67 times!).
So, that's nearly once a week for the last 15 months that I've pointed out DMP as one of my highest conviction downtrends (some people like to use these for shorts = 💰💰💰).
What did I know that other investors didn't? Nothing! We all knew roughly the same thing! For the fund managers, they knew DMP's goose was cooked. For me, I just looked at the chart and deduced that the fund managers knew DMP's goose was cooked.
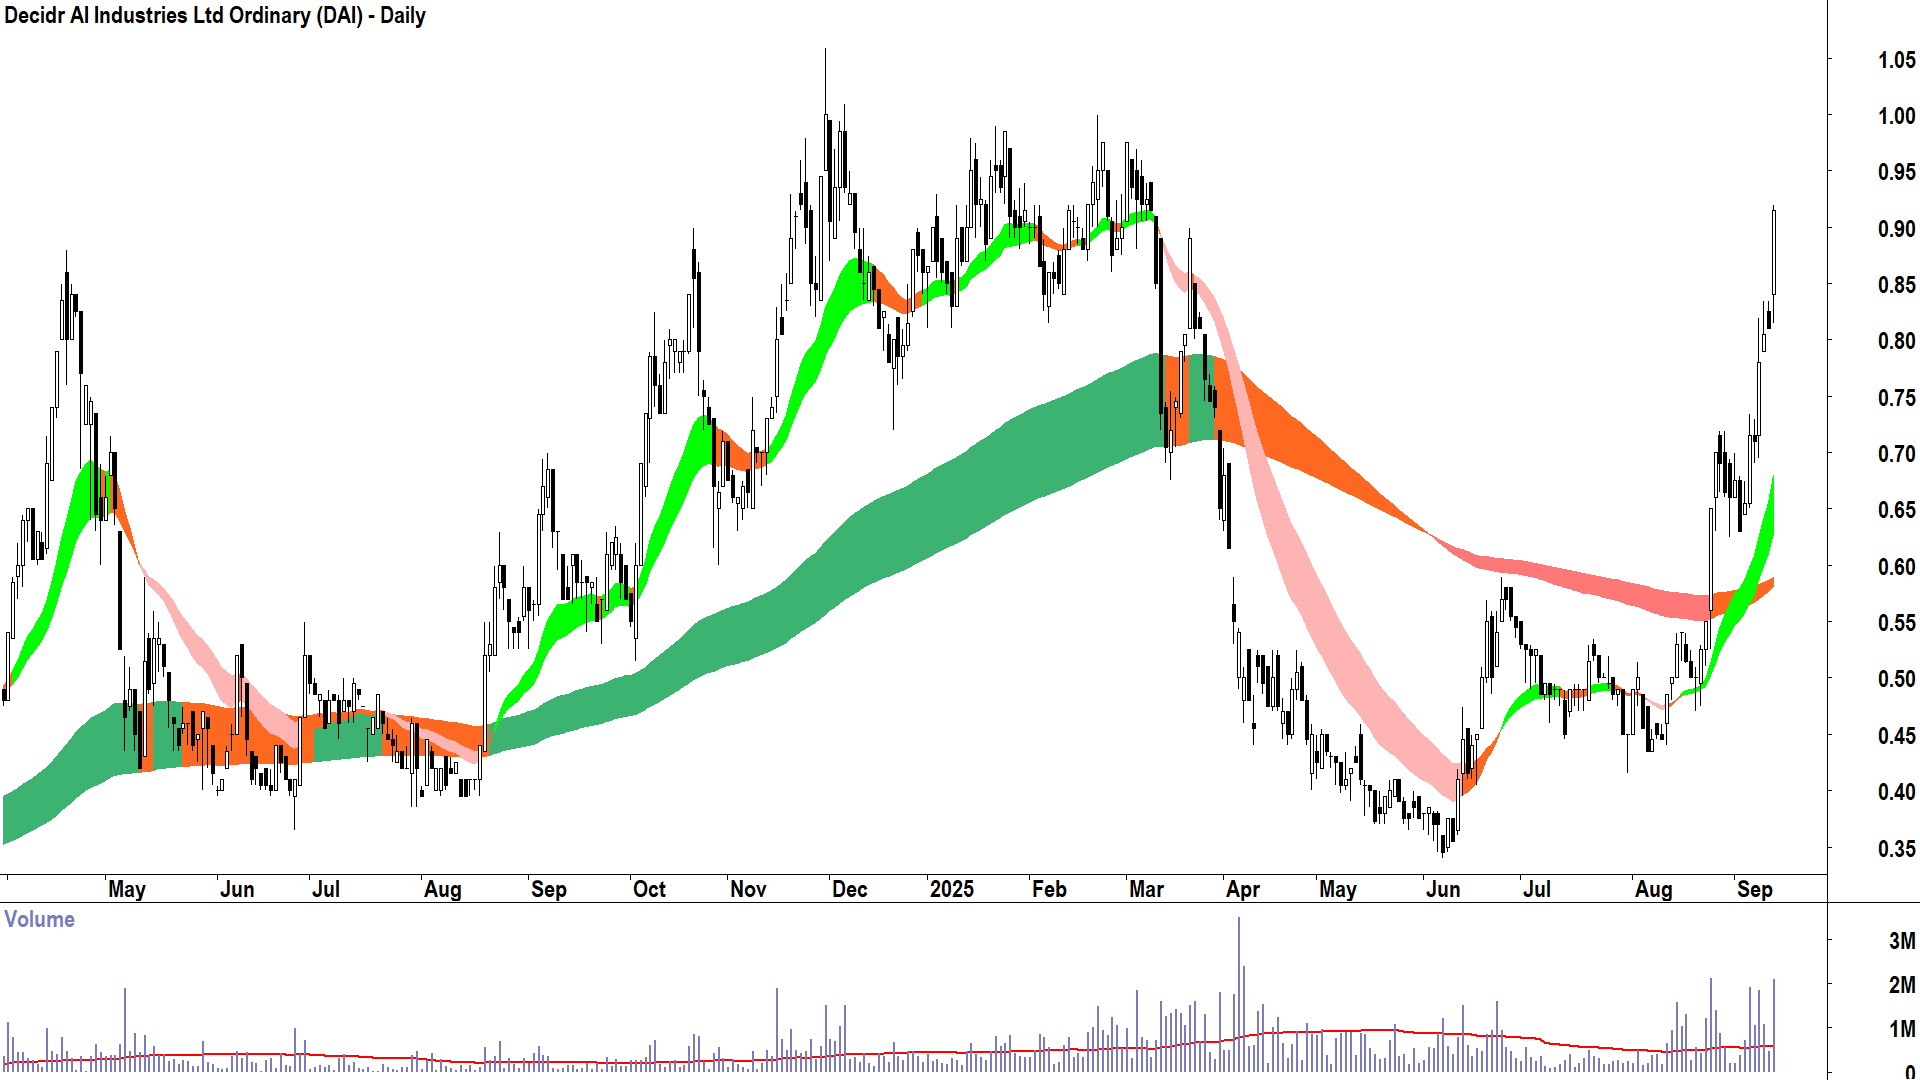
EXHIBIT 2: DECIDR AI INDUSTRIES (DAI)
(Scroll down to the Feature Uptrends for its chart! 👇)
This is a relatively new addition to ChartWatch ASX Scans. It first appeared as a result of the 25 August candle. I know you must scroll down to see it – but if you know me – you know it will be big and white and probably accompanied by a great wad of volume!
The reason why DAI has only been a Feature Uptrend 4 times (25-Aug, 26-Aug, 4-Sep, and 11-Sep candles) is because it's a relatively new uptrend. I wanted to contrast DAI and DMP today because the former is a fantastic example of the earliest my system can "pick the low" of a beaten down stock.
As you can see, I didn't really get anywhere near the exact low, which was 34 cents. The top of the 28-Aug signal candle is 65 cents – nearly double. I guess that means I'm not very good at what I do... Doesn't it? 🤔
(Hey, the answer to that question is always your call. I would suggest though, picking the bottom is fraught with danger and disappointment – as per DMP's sorry chart! For me, I cannot enter until I am confident the short and long term trends have turned up. DAI is a great template for what I would need to see in the DMP chart before I could even contemplate running it here has one of my highest conviction uptrends ✅)
Welcome to my ChartWatch Daily ASX Scans series. Here, I present scan lists based on my trend following technical analysis methodology. My goal is to alert you to the best uptrends and downtrends on the ASX.
Feel free to get your favourite AI to convert the tables below into lists you can upload to your favourite trading platform like TradingView. Then you'll be able to skip from chart to chart and quickly and easily see the best uptrends and downtrends on the ASX.
Some investors prefer to buy those stocks in strong uptrends, and avoid, sell, or short sell those stocks in strong downtrends – but how you use the lists is really up to you!
Note, many stocks in both lists have appeared there many times before. As long as they keep meeting my criteria – they'll keep appearing. But note, there won't be any notifications when they don't – so you'll have to do your own research on when a particular trend changes!
Uptrends Scan List
Company | Code | Last Price | 1mo % | 1yr % |
|---|---|---|---|---|
Aussie Broadband | ABB | $5.40 | +18.2% | +43.0% |
Aeris Resources | AIS | $0.325 | +62.5% | +85.7% |
APA Group | APA | $8.93 | +2.9% | +21.2% |
Autosports Group | ASG | $3.49 | +33.7% | +72.8% |
Activeport Group | ATV | $0.033 | +247.4% | -43.6% |
Ausgold | AUC | $0.930 | +52.5% | +138.5% |
Betmakers Technology Group | BET | $0.180 | +24.1% | +104.5% |
Barton Gold | BGD | $0.970 | +19.0% | +295.9% |
Bannerman Energy | BMN | $3.50 | +40.6% | +76.8% |
Benz Mining Corp. | BNZ | $1.450 | +22.9% | +1218.2% |
Catapult Group International | CAT | $6.82 | +10.7% | +210.0% |
Vaneck FTSE China A50 ETF | CETF | $63.64 | +7.1% | +35.6% |
Charter Hall Long Wale Reit | CLW | $4.56 | +2.5% | +16.3% |
Capricorn Metals | CMM | $11.86 | +23.2% | +113.7% |
Cromwell Property Group | CMW | $0.490 | +14.0% | +22.5% |
Capstone Copper Corp. | CSC | $11.29 | +11.0% | +22.1% |
Civmec | CVL | $1.325 | +12.3% | +20.5% |
Clearview Wealth | CVW | $0.570 | +26.7% | +4.6% |
Decidr Ai Industries | DAI | $0.915 | +83.0% | +61.9% |
Dicker Data | DDR | $10.05 | +13.2% | +9.4% |
Global X China Tech ETF | DRGN | $13.10 | +17.3% | 0% |
Data#3 | DTL | $9.55 | +20.9% | +23.7% |
Duratec | DUR | $1.775 | +14.1% | +42.0% |
Energy One | EOL | $15.68 | +14.0% | +214.2% |
Eroad | ERD | $2.39 | +19.5% | +93.5% |
Vaneck Video Gaming and Esports ETF | ESPO | $21.52 | +2.7% | +67.3% |
Evolution Mining | EVN | $9.70 | +21.4% | +150.6% |
Finbar Group | FRI | $0.800 | +15.9% | -17.9% |
Genesis Minerals | GMD | $5.59 | +33.7% | +170.0% |
Gateway Mining | GML | $0.065 | +124.1% | +132.1% |
Graincorp | GNC | $8.65 | +9.2% | +4.0% |
Genusplus Group | GNP | $5.28 | +8.4% | +125.6% |
Homeco Daily Needs Reit | HDN | $1.380 | +7.8% | +7.8% |
Iress | IRE | $9.15 | +4.0% | -3.1% |
Kaiser Reef | KAU | $0.250 | +42.9% | +72.4% |
Kinatico | KYP | $0.315 | +8.6% | +186.4% |
Locksley Resources | LKY | $0.360 | +56.5% | +1340.0% |
Matsa Resources | MAT | $0.120 | +62.2% | +380.0% |
Medallion Metals | MM8 | $0.445 | +50.8% | +739.6% |
Monadelphous Group | MND | $21.48 | +7.8% | +81.7% |
Metal Powder Works | MPW | $4.29 | +123.4% | -43.8% |
Metallium | MTM | $0.890 | +28.1% | +1248.5% |
New Murchison Gold | NMG | $0.028 | +60.0% | +460.0% |
Northern Star Resources | NST | $20.87 | +17.4% | +42.5% |
NRW | NWH | $4.52 | +32.2% | +27.3% |
Nexgen Energy | NXG | $12.10 | +15.2% | +52.6% |
Nextdc | NXT | $17.33 | +19.3% | -1.8% |
Pantoro | PNR | $5.17 | +20.5% | +153.4% |
Polymetals Resources | POL | $1.080 | +38.5% | +315.4% |
Perenti | PRN | $2.50 | +26.6% | +155.1% |
Ramelius Resources | RMS | $3.52 | +25.7% | +63.7% |
Regis Resources | RRL | $5.45 | +25.3% | +210.5% |
Resolute Mining | RSG | $0.855 | +23.9% | +28.6% |
SRG Global | SRG | $1.990 | +23.6% | +95.1% |
Sunrise Energy Metals | SRL | $2.64 | +116.4% | +422.8% |
Service Stream | SSM | $2.32 | +13.2% | +66.9% |
Tribeca Global Natural Resources | TGF | $1.660 | +15.7% | +16.9% |
Vanguard FTSE Asia EX Japan Shares Index ETF | VAE | $91.99 | +2.4% | +26.8% |
Vection Technologies | VR1 | $0.063 | +53.7% | +600.0% |
Warriedar Resources | WA8 | $0.185 | +23.3% | +180.3% |
Westgold Resources | WGX | $3.81 | +28.3% | +37.1% |
Global X Copper Miners ETF | WIRE | $15.82 | +10.7% | +36.4% |
Zip Co. | ZIP | $4.59 | +40.8% | +111.5% |
Today's Uptrends Scan List
Feature Charts from today's Uptrends List 🔎📈
The stocks that I feel are showing the strongest excess demand from today's Uptrends List are: Aussie Broadband (ASX: ABB), Aeris Resources (ASX: AIS), Activeport Group (ASX: ATV), Ausgold (ASX: AUC), Benz Mining Corp. (ASX: BNZ), Catapult Group International (ASX: CAT), Vaneck FTSE China A50 ETF (ASX: CETF), Capricorn Metals (ASX: CMM), Civmec (ASX: CVL), Decidr Ai Industries (ASX: DAI), Global X China Tech ETF (ASX: DRGN), Eroad (ASX: ERD), Evolution Mining (ASX: EVN), Genesis Minerals (ASX: GMD), Gateway Mining (ASX: GML), Kaiser Reef (ASX: KAU), Kinatico (ASX: KYP), Matsa Resources (ASX: MAT), Medallion Metals (ASX: MM8), Metal Powder Works (ASX: MPW), Metallium (ASX: MTM), New Murchison Gold (ASX: NMG), Northern Star Resources (ASX: NST), Nexgen Energy (ASX: NXG), Nextdc (ASX: NXT), Pantoro (ASX: PNR), Polymetals Resources (ASX: POL), Regis Resources (ASX: RRL), Resolute Mining (ASX: RSG), Sunrise Energy Metals (ASX: SRL), Service Stream (ASX: SSM), Vection Technologies (ASX: VR1), Warriedar Resources (ASX: WA8), Westgold Resources (ASX: WGX), Global X Copper Miners ETF (ASX: WIRE).
10 Randomly chosen Feature Uptrend Charts:
%20daily%20chart%2011%20September%202025.png)
%20daily%20chart%2011%20September%202025.png)
%20daily%20chart%2011%20September%202025.png)
%20daily%20chart%2011%20September%202025.png)
%20daily%20chart%2011%20September%202025.png)
*click here for full size image of the Decidr AI Industries chart*
%20daily%20chart%2011%20September%202025.png)
%20daily%20chart%2011%20September%202025.png)
%20daily%20chart%2011%20September%202025.png)
%20daily%20chart%2011%20September%202025.png)
%20daily%20chart%2011%20September%202025.png)
Downtrends Scan List
Company | Code | Last Price | 1mo % | 1yr % |
|---|---|---|---|---|
Australian Clinical Labs | ACL | $2.49 | -8.1% | -22.4% |
Audinate Group | AD8 | $4.69 | -16.3% | -50.8% |
Appen | APX | $0.800 | -11.6% | -25.9% |
Atturra | ATA | $0.770 | -7.2% | -12.5% |
Avita Medical | AVH | $1.275 | -24.6% | -51.5% |
Accent Group | AX1 | $1.320 | -12.6% | -42.6% |
Boss Energy | BOE | $1.735 | 0% | -29.8% |
Brainchip | BRN | $0.190 | -5.0% | +18.8% |
CSL | CSL | $205.81 | -23.6% | -31.5% |
Clinuvel Pharmaceuticals | CUV | $10.66 | -13.7% | -26.7% |
DigiCo REIT | DGT | $2.92 | -10.2% | 0% |
Domino's Pizza Enterprises | DMP | $14.13 | -25.6% | -51.3% |
Develop Global | DVP | $3.49 | -18.8% | +77.2% |
Endeavour Group | EDV | $3.61 | -13.8% | -27.1% |
EQT | EQT | $26.25 | -11.9% | -10.7% |
Fletcher Building | FBU | $2.72 | -2.5% | +7.7% |
Flight Centre Travel Group | FLT | $12.12 | -6.0% | -41.4% |
Findi | FND | $3.55 | -11.7% | -14.7% |
G8 Education | GEM | $0.785 | -16.0% | -37.7% |
Inghams Group | ING | $2.63 | -23.8% | -13.8% |
IPH | IPH | $4.05 | -26.0% | -32.9% |
Kogan.Com | KGN | $3.75 | -6.0% | -17.4% |
Lindsay Australia | LAU | $0.655 | -13.8% | -27.2% |
Lendlease Group | LLC | $5.44 | +0.4% | -21.8% |
Nickel Industries | NIC | $0.685 | -9.9% | -8.7% |
Orthocell | OCC | $1.110 | -10.5% | +192.1% |
Peninsula Energy | PEN | $0.295 | -33.7% | -82.2% |
QBE Insurance Group | QBE | $20.56 | -2.7% | +26.8% |
REA Group | REA | $232.32 | -6.5% | +15.4% |
Reece | REH | $10.44 | -28.2% | -60.8% |
Ramsay Health Care | RHC | $33.35 | -14.1% | -15.0% |
South32 | S32 | $2.54 | -17.0% | -14.5% |
Skycity Entertainment Group | SKC | $0.605 | -26.9% | -49.9% |
Stanmore Resources | SMR | $1.745 | -28.2% | -33.7% |
Spark New Zealand | SPK | $2.18 | -5.6% | -32.3% |
Strike Energy | STX | $0.105 | -12.5% | -43.2% |
Syrah Resources | SYR | $0.270 | -8.5% | +42.0% |
Telix Pharmaceuticals | TLX | $13.78 | -19.6% | -21.5% |
Viva Energy Group | VEA | $1.940 | -4.9% | -28.9% |
Vulcan Energy Resources | VUL | $3.73 | +0.8% | -1.1% |
Whitehaven Coal | WHC | $6.12 | -14.8% | +6.8% |
Yancoal Australia | YAL | $5.24 | -19.5% | -5.4% |
Today's Downtrends Scan List
Feature Charts from today's Downtrends List 🔎📉
The stocks that I feel are showing the strongest excess supply from today's Downtrends List are: Australian Clinical Labs (ASX: ACL), Appen (ASX: APX), Avita Medical (ASX: AVH), Accent Group (ASX: AX1), Boss Energy (ASX: BOE), CSL (ASX: CSL), Clinuvel Pharmaceuticals (ASX: CUV), DigiCo REIT (ASX: DGT), Domino's Pizza Enterprises (ASX: DMP), Develop Global (ASX: DVP), Endeavour Group (ASX: EDV), EQT (ASX: EQT), G8 Education (ASX: GEM), IPH (ASX: IPH), Kogan.Com (ASX: KGN), Lindsay Australia (ASX: LAU), Nickel Industries (ASX: NIC), Orthocell (ASX: OCC), Peninsula Energy (ASX: PEN), QBE Insurance Group (ASX: QBE), Ramsay Health Care (ASX: RHC), Skycity Entertainment Group (ASX: SKC), Stanmore Resources (ASX: SMR), Spark New Zealand (ASX: SPK), Telix Pharmaceuticals (ASX: TLX), Viva Energy Group (ASX: VEA).
10 Randomly chosen Feature Downtrend Charts:
%20daily%20chart%2011%20September%202025.png)
%20daily%20chart%2011%20September%202025.png)
%20daily%20chart%2011%20September%202025.png)
%20daily%20chart%2011%20September%202025.png)
%20daily%20chart%2011%20September%202025.png)
*click here for full size image of the Domino's Pizza Enterprises (DMP) chart*
%20daily%20chart%2011%20September%202025.png)
%20daily%20chart%2011%20September%202025.png)
%20daily%20chart%2011%20September%202025.png)
%20daily%20chart%2011%20September%202025.png)
%20daily%20chart%2011%20September%202025.png)
Important considerations when using the ChartWatch Daily ASX Scans:
1. The future is unknown. Anything can happen to change the trends in the lists above. A stock in a perfect uptrend or downtrend may not remain that way by the close of trading today. 2. These lists are not exhaustive, they are curated by Carl. You will find that certain stocks might not appear in a particular list on consecutive days but might reappear when Carl feels it deserves to return to the list. 3. This is not a recommendation service, merely an aid to help you better understand the workings of Carl’s technical analysis model in a practical way. Carl will not alert you to stocks that have dropped off a list because their trend has changed – it's up to you to apply the criteria to determine why a particular stock might not still be included. 4. This is general, educational information only – so always do your own research!!!
