
The ASX 200 closed higher despite a hawkish RBA warning that sent rate-rise odds surging mid-session. Banks and communications stocks held the index up, while a spectacular tech collapse provided the day’s drama.
Be sure to click/scroll through for the usual reporting of the major sector and stock-specific moves, the broker responses to them, as well as all the key economic data in tonight's Evening Wrap. Also, I have detailed technical analysis on the Nasdaq Composite and the S&P/ASX 200 in today's ChartWatch.
Let’s dive in!
Today in Review
Name | Value | % Chg |
|---|---|---|
Major Indices | ||
| ASX 200 | 8,831.3 | +0.16% |
| All Ords | 8,956.6 | +0.14% |
| Small Ords | 3,153.7 | +0.11% |
| All Tech | 2,810.2 | -0.48% |
| Emerging Companies | 2,763.5 | -0.14% |
Currency | ||
| AUD/USD | 0.7012 | +0.12% |
US Futures | ||
| S&P 500 | 7,774.25 | +0.24% |
| Dow Jones | 52,766.0 | +0.09% |
| Nasdaq | 29,851.5 | +0.59% |
Name | Value | % Chg |
|---|---|---|
Sector | ||
| Communication Services | 1,572.5 | +2.23% |
| Industrials | 8,113.9 | +0.99% |
| Financials | 9,470.3 | +0.96% |
| Energy | 11,220.5 | +0.49% |
| Consumer Discretionary | 3,741.9 | +0.34% |
| Consumer Staples | 13,827.1 | +0.25% |
| Utilities | 10,715.1 | +0.18% |
| Health Care | 34,287.0 | +0.05% |
| Real Estate | 3,236.2 | -0.49% |
| Materials | 22,642.6 | -1.04% |
| Information Technology | 1,615.1 | -3.32% |
ASX 200 Intraday Chart
Markets
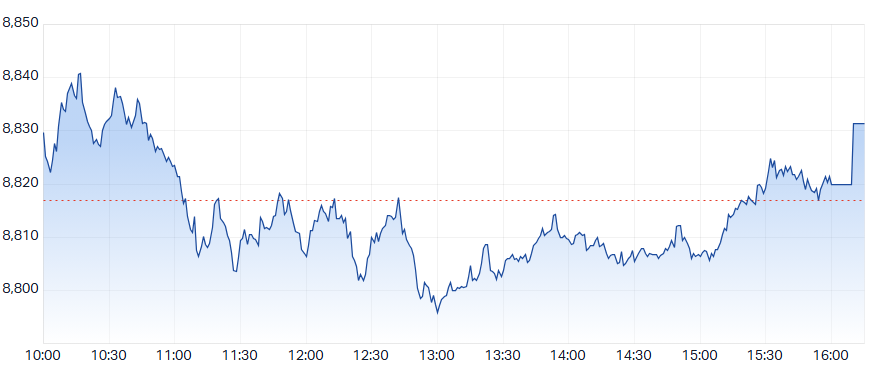
The S&P/ASX 200 (XJO) finished 14.4 points higher at 8,831.3, 0.40% from its session low and 0.12% from its high. In the broader-based S&P/ASX 300 (XKO) advancers beat decliners by 164 to 115.
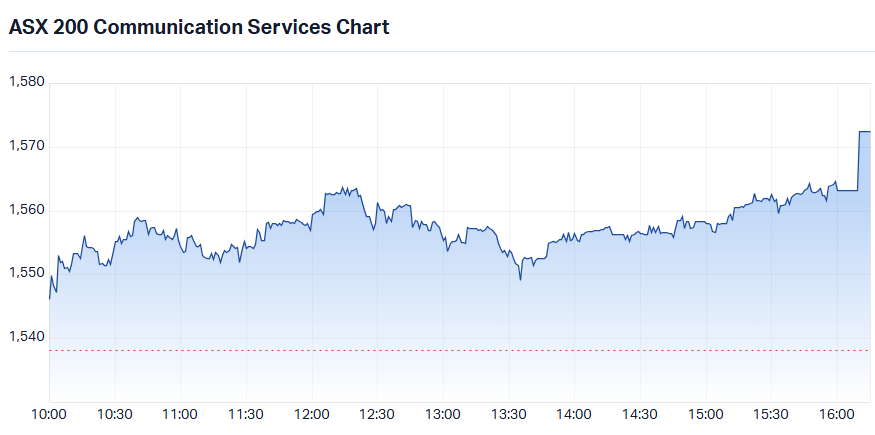
Communication Services (XTJ) (+2.2%) was the session’s best performer, lifted first by Seek (SEK) (+4.4%) after the company’s Growth Fund announced it is targeting $840 million in liquidity for investors — a catalyst that quickly spread to other online classified names, with Car Group (CAR) (+3.4%) and REA Group (REA) (+2.7%) rising in its wake.
Telcos also fared well within the sector, likely picking up some of the capital that fled tech after the NXT collapse. Aussie Broadband (ABB) (+3.3%) and Superloop (SLC) (+2.7%) led the move, with Telstra (TLS) (+1.9%) also closing higher.
S&P-ASX 200 Communication Services Sector Index (XTJ) intraday chart
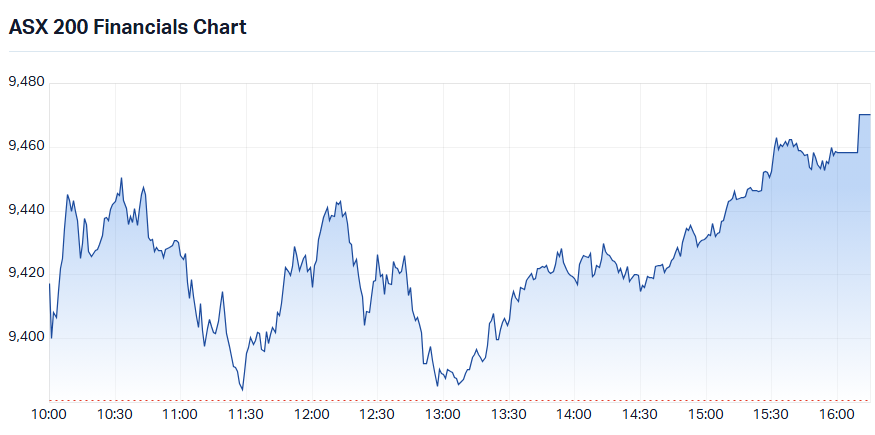
Financials (XFJ) (+1.0%) continued to play their defensive anchor role, with the major banks providing the index its closing gain — a late-session closing auction pop across the big four helped push the bourse into the green after it spent most of the day in the red. National Australia Bank (NAB) (+1.9%) led the charge, followed by Westpac Banking Corp (WBC) (+1.1%), Commonwealth Bank of Australia (CBA) (+0.9%), and ANZ (ANZ) (+0.6%). Juicy! 🧃
S&P-ASX 200 Financials Sector Index (XFJ) intraday chart
Energy (XEJ) (+0.5%) was supported by crude oil probing its highest levels since the start of the Iran conflict, with ICE benchmark Brent crude oil futures rising +1.6% to US$110.52/bbl in the Asian session. The mid-cap oil and gas names led the move, with Beach Energy (BPT) (+5.5%) catching a double boost from a positive September quarter update — record quarterly sales on higher output and prices — and Karoon Energy (KAR) (+1.2%) also advancing.
Uranium stocks were also well supported within the sector, with Boss Energy (BOE) (+3.1%) and Paladin Energy (PDN) (+2.5%) both moving higher.
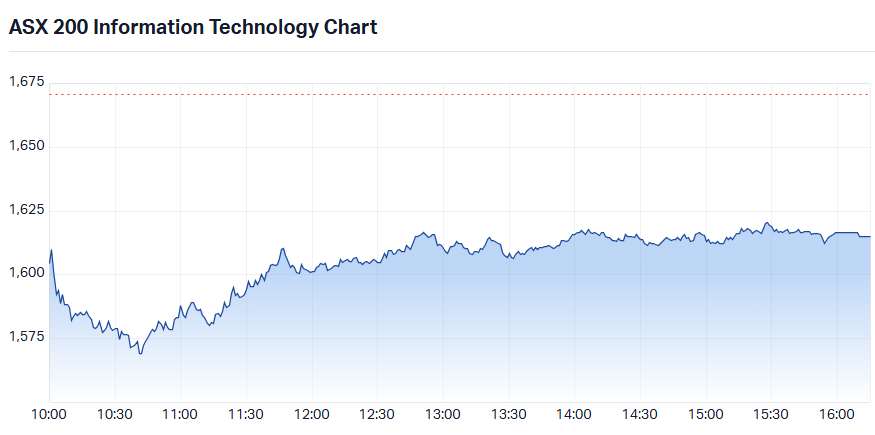
Information Technology (XIJ) (-3.3%) was dragged sharply lower almost entirely by NextDC (NXT) (-41.7%), which plunged after slashing its earnings guidance following power delays at its M3 West Footscray data centre due to community pushback. The dramatic fall masked what was otherwise a strong session for tech — capital didn’t leave the sector, as is generally the case for the OTP — it was reallocated.
Xero (XRO) (+5.0%) and Megaport (MP1) (+5.0%) were the standout beneficiaries, with Life360 (360) (+4.8%) and Wisetech Global (WTC) (+2.9%) also rising (aided in part by stronger Nasdaq futures following SpaceX’s 8% after-hours gain post-earnings).
S&P-ASX 200 Information Technology Sector Index (XIJ) intraday chart
Materials (XMJ) (-1.0%) continued to be shunned, with capital flowing away from the sector and toward the banks. The culprit appears less about commodity prices — iron ore actually edged up 0.3% in Singapore today and base metals prices were roughly steady. More likely, the recent underperformance reflects the headwind on miners’ fuel and energy costs created by the surging oil price. South32 (S32) (-1.8%) was the heaviest faller among the majors, with BHP (BHP) (-1.6%) and Rio Tinto (RIO) (-1.5%) also lower.
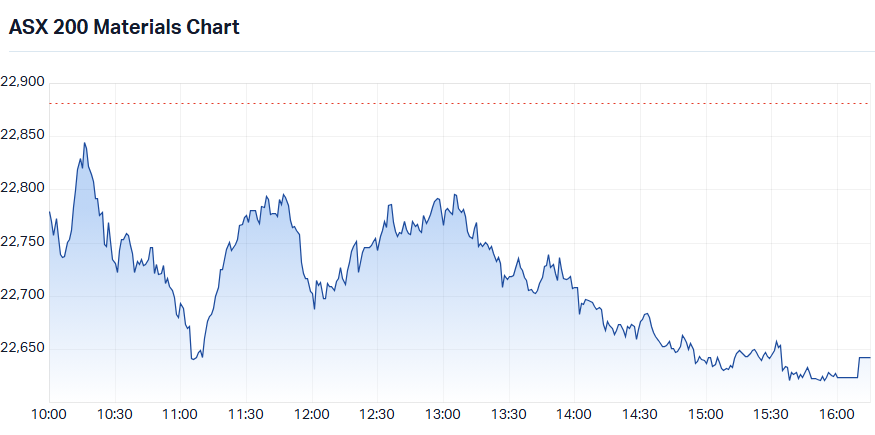
S&P-ASX 200 Materials Sector Index (XMJ) intraday chart
In other commodity moves, the Gold Sub-Index (XGD) (-0.7%) softened in line with a weak commodity price lead, with COMEX benchmark gold futures slipping -0.1% to US$4,138.7/oz in the Asian session. Genesis Minerals (GMD) (-2.7%) and Regis Resources (RRL) (-2.6%) were the hardest hit, with Capricorn Metals (CMM) (-2.3%) and Perseus Mining (PRU) (-2.3%) also lower.
Lithium stocks gave back the prior session’s rebound as GFEX benchmark lithium carbonate futures in China fell -5.4% to 95,100 CNY/t. Elevra Lithium (ELV) (-2.9%) and Vulcan Energy Resources (VUL) (-2.2%) led the losses, with Liontown (LTR) (-1.4%) and IGO (IGO) (-1.3%) also lower.
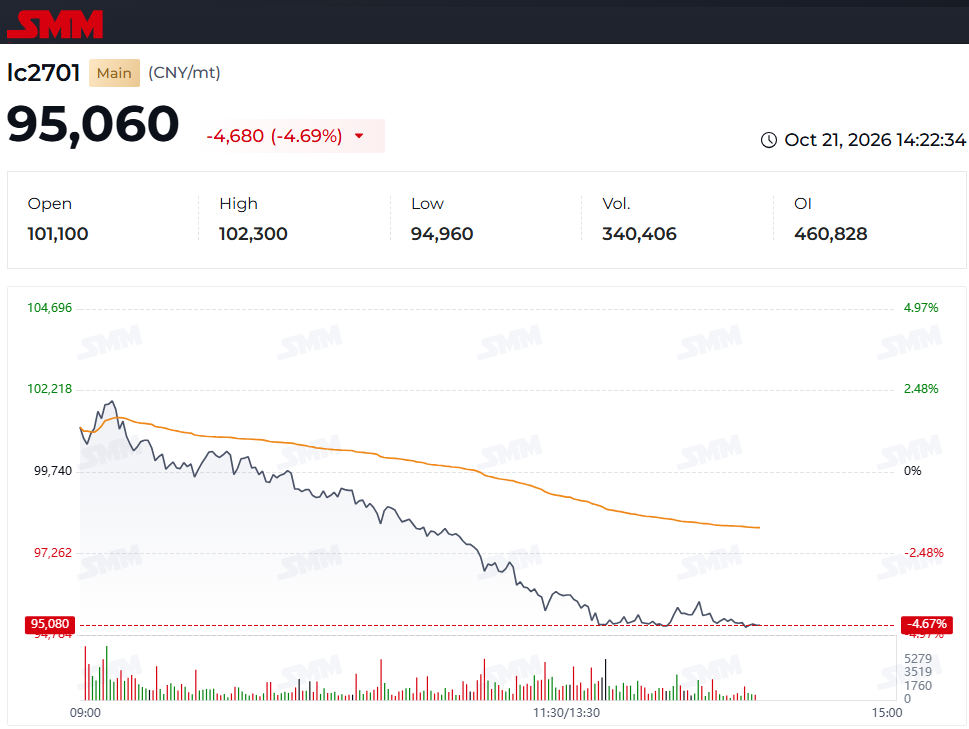
Lithium Carbonate Futures (Benchmark month, back-adjusted) GFEX intraday chart. Q: How high does a dead cat bounce? 🙀 Source: SMM
Today's best ASX Top 300 gainers
Company | Last Price | Change $ | Change % | 1mo % | 1yr % |
|---|---|---|---|---|---|
| Vulcan Steel (VSL) | $5.63 | +$0.54 | +10.6% | +5.4% | -20.9% |
| Metals X (MLX) | $1.695 | +$0.095 | +5.9% | -21.2% | +96.0% |
| Mesoblast (MSB) | $1.86 | +$0.10 | +5.7% | -11.8% | -36.1% |
| Service Stream (SSM) | $2.25 | +$0.12 | +5.6% | -7.8% | +1.4% |
| Beach Energy (BPT) | $0.96 | +$0.05 | +5.5% | +10.3% | -19.0% |
| EBOS Group (EBO) | $17.08 | +$0.82 | +5.0% | +7.3% | -31.2% |
| Xero (XRO) | $64.42 | +$3.08 | +5.0% | +2.6% | -57.5% |
| Megaport (MP1) | $16.18 | +$0.77 | +5.0% | -12.7% | +12.6% |
| Life360 Inc (360) | $21.06 | +$0.97 | +4.8% | +10.7% | -54.1% |
| Generation Development Group (GDG) | $3.30 | +$0.15 | +4.8% | +10.7% | -54.7% |
| Aura Consolidated Group, Inc. (AXQ) | $3.55 | +$0.16 | +4.7% | -14.0% | -48.2% |
| SEEK (SEK) | $13.37 | +$0.56 | +4.4% | +14.7% | -51.7% |
| CAR Group (CAR) | $24.90 | +$0.83 | +3.4% | +7.1% | -31.2% |
| Aussie Broadband (ABB) | $4.13 | +$0.13 | +3.3% | -2.6% | -31.7% |
| Cromwell Property Group (CMW) | $0.325 | +$0.01 | +3.2% | -7.1% | -28.6% |
| Orora (ORA) | $1.50 | +$0.045 | +3.1% | +7.9% | -25.4% |
| Transurban Group (TCL) | $14.05 | +$0.41 | +3.0% | +6.0% | -6.1% |
| MA Financial Group (MAF) | $4.80 | +$0.14 | +3.0% | -2.4% | -47.8% |
| 4DMedical (4DX) | $3.84 | +$0.11 | +2.9% | -10.9% | +113.3% |
| Forrestania Resources (FRS) | $0.35 | +$0.01 | +2.9% | 0.0% | +47.4% |
Today's worst ASX Top 300 losers
Company | Last Price | Change $ | Change % | 1mo % | 1yr % |
|---|---|---|---|---|---|
| NEXTDC (NXT) | $5.35 | -$3.83 | -41.7% | -52.9% | -66.9% |
| Telix Pharmaceuticals (TLX) | $14.52 | -$1.24 | -7.9% | -18.7% | -14.3% |
| Southern Cross Electrical Engineering (SXE) | $3.95 | -$0.30 | -7.1% | -12.6% | +65.3% |
| Zimplats Holdings (ZIM) | $13.53 | -$0.71 | -5.0% | -13.3% | -31.3% |
| Reliance Worldwide Corporation (RWC) | $4.30 | -$0.22 | -4.9% | -6.3% | +9.4% |
| PDI Gold (PDI) | $3.89 | -$0.19 | -4.7% | -20.8% | +27.5% |
| GR Engineering Services (GNG) | $6.93 | -$0.27 | -3.7% | -8.8% | +80.9% |
| GenusPlus Group (GNP) | $8.00 | -$0.30 | -3.6% | -15.4% | +36.1% |
| Cobram Estate Olives (CBO) | $2.67 | -$0.10 | -3.6% | -10.7% | -25.0% |
| Australian Agricultural Company (AAC) | $1.29 | -$0.045 | -3.4% | -0.8% | -8.5% |
| Digico Infrastructure REIT (DGT) | $1.935 | -$0.065 | -3.2% | -24.1% | -30.9% |
| HMC Capital (HMC) | $2.62 | -$0.08 | -3.0% | -18.9% | -18.6% |
| Zip Co (ZIP) | $2.06 | -$0.06 | -2.8% | -5.5% | -50.8% |
| Sigma Healthcare (SIG) | $2.75 | -$0.08 | -2.8% | +7.8% | -9.5% |
| Capstone Copper Corp. (CSC) | $12.13 | -$0.35 | -2.8% | -15.6% | -5.2% |
| Genesis Energy (GNE) | $1.893 | -$0.053 | -2.7% | -8.1% | -11.4% |
| Contact Energy (CEN) | $6.85 | -$0.19 | -2.7% | -3.5% | -15.4% |
| Genesis Minerals (GMD) | $6.90 | -$0.19 | -2.7% | -9.2% | +4.4% |
| Regis Resources (RRL) | $6.67 | -$0.18 | -2.6% | -14.5% | +1.7% |
| Yancoal Australia (YAL) | $5.89 | -$0.15 | -2.5% | +1.2% | +11.8% |
Chartwatch
Nasdaq Composite Index
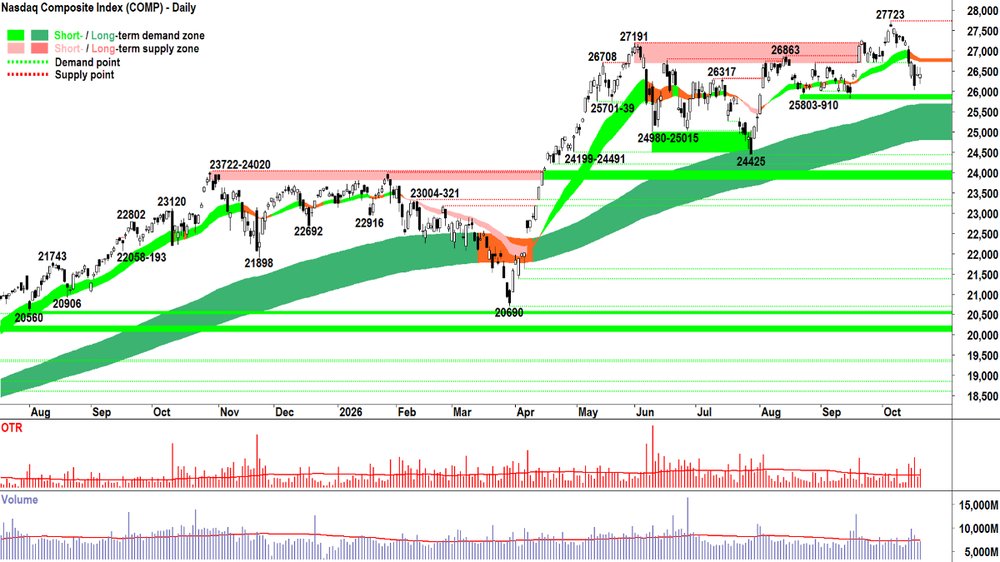
Nasdaq Composite Index chart
Analysis
Tuesday’s indecision candle is probably a little moot given Comp futures are about 0.8% higher on the back of an 8% pop in Space-Ex (NYSE: SPCX) shares after market / post earnings.
Still, it’s worth calling out Tuesday as a session where the demand and supply sides were both active — pushing prices up and down respectively — but with neither decisively grappling control of price.
Indecision. On about average participation (i.e., volume). Stuck below a short term trend ribbon that signals equilibrium (amber) and a long term uptrend ribbon that signals ongoing longer term excess demand (dark green).
Arguably, 25803-25910 is just as important as the trend ribbons. Above it, the Comp’s bull market remains intact. Below it, it will be a version of “not intact”. We’ll see.
Or maybe we won’t. Probably we won’t. The Comp has a way of finding a way to go up!
For now, though, based on what I can see (i.e. sans tonight’s candle!), I peg the technicals at “roughly balanced-with a modest upward skew”.
Therefore, my present 1/2RP setting feels appropriate. I remain ready to add risk if the Comp can reclaim the short term trend ribbon, preferably with an emphatic demand side candle / volume showing (i.e., long white candle and or long downward pointing shadow on above average volume to signal strong re-engagement from the demand side and a clearing of latent excess supply).
Alternatively, a close below 25803-25910 would be a trigger to reduce risk.
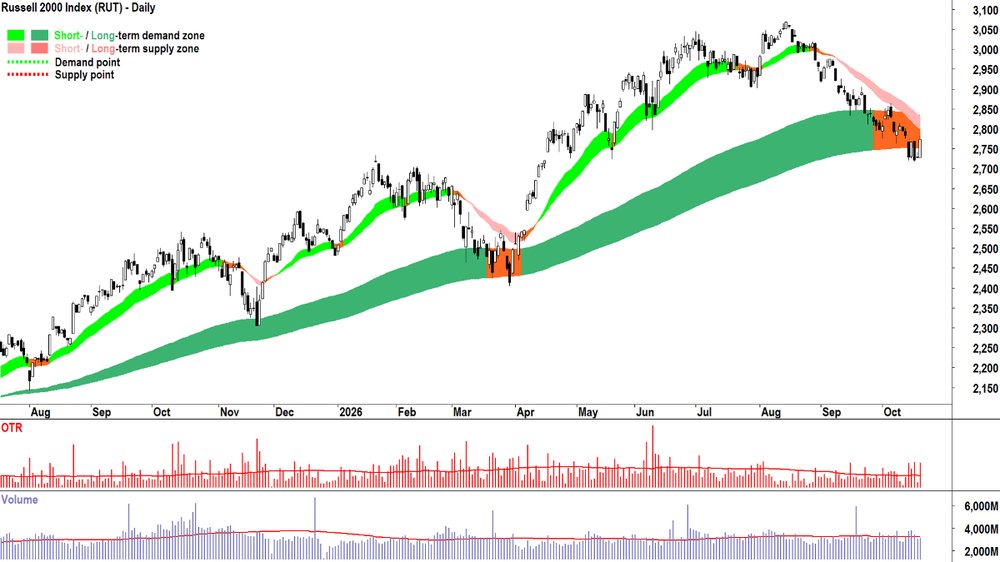
Russell 2000 chart
One decisively positive item to note from Tuesday's US stock indices candles, is the stronger showing on the RUT. Still plenty of work to do to right the ship here, but a solid start... 🤞
View
I am 1/2RP on US stocks (RP = Risk Position – it reflects my personal allowable capital allocation limit for my investments in US stocks. So 1/2RP is 50%, 2/3RP is 67% and FRP is 100%).
Key Levels
27723 is the closest key point of supply, but the short term trend ribbon will also likely act as a dynamic zone of supply (presently 26733-26808). 25803-910 as the closest key zone of demand.
S&P/ASX 200 (XJO)
S&P/ASX 200 (XJO) chart
Analysis
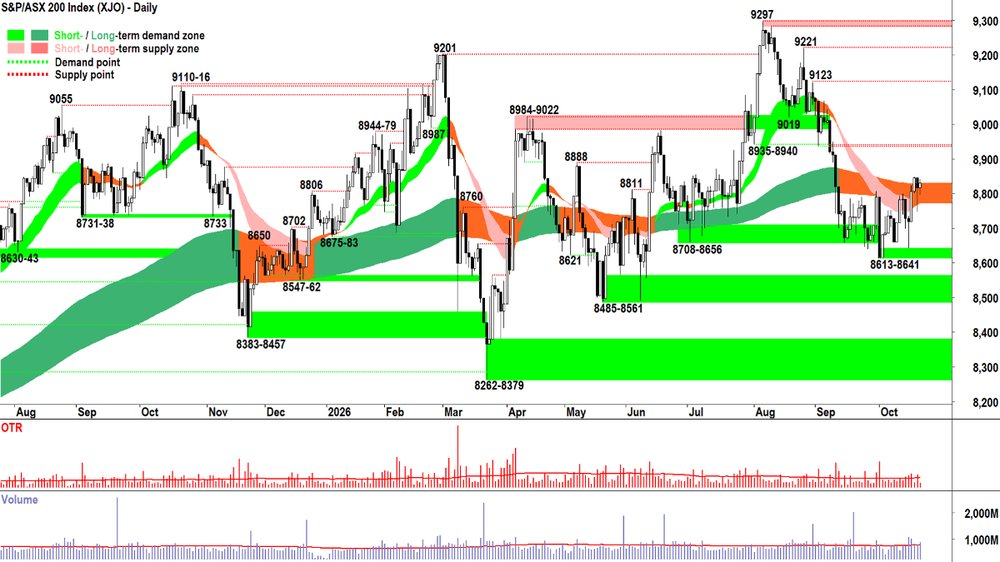
Not much of a candle, so not much to add here! We’re still double-amber on the trend ribbons… and they seem to continue to act as a powerful magnet… drawing the price inevitably towards them. 🧲
Look at the span of the above chart. 14 painful months of not a great deal flip-flopping above/below the long term trend ribbon… Like herds of zebras ranging on the Serengeti… 🦓🦓🦓
Sigh…
But it wouldn’t take much to spark some hope that the OTP has another shot at record highs in it. We are getting close to the magical Nov-Dec period of seasonal strength. Santa may have a surprise in store! 🎁
I suggest 8935-8940 is the key level to the upside. Obviously the OTP must clear the trend ribbons first… But a few strong demand side candles between here and 8935-8940 should spark some FOMO and HOFU.
8613-8641 is the key demand zone. As long as it holds, bumping around the trend ribbons is probably our worst case scenario.
Are you an optimist (i.e., +RP here?) or a pessimist (i.e., well… we’re already 1/3RP… so do nothing)?
I’m neither. Simply, there’s insufficient evidence that the demand side is in strong and decisive control of the OTP’s price = I remain comfortable with my current RP setting.
View
I am 1/3RP on Australian shares (i.e., 67% cash vs 33% invested, with some of the invested portion allocated to shorts).
Key Levels
8935-8940 is the closest zone of supply vs 8613-8641 is the critical zone of demand.
(Glossary of acronyms! Old Tin Pot (OTP): S&P/ASX 200 | MOTN: More Often Than Not | FOMO: Fear Of Missing Out | HOFU: Holding On For Upside | BTD: Buy The Dip | NUTE: No Urgency To Enter | FOHO: Fear Of Holding On | STR: Sell The Rally | RP: Risk Position | FFS: Fund Flow Shenanigans!)
ChartWatch LIVE Webinars – RETURN ON WEDS 28 OCT @ 12pm AEDT!!!
Learn more about technical analysis and trend following through real case studies on ASX stocks. Australia's premier technical analyst, Carl Capolingua, shares his unique insights on stocks as requested by viewers. Ask about a company in your portfolio or anything related to trading and investing and get Carl's expert opinion.
Places are limited so >REGISTER NOW!<
Economy
TODAY
TUESDAY
No major economic announcements scheduled for Wednesday
LATER THIS WEEK
THURSDAY
No major economic announcements scheduled for Wednesday
FRIDAY
09:00 AUS Flash October Purchasing Managers Index ("PMI")
Manufacturing: no forecast available vs 49.6 previous (revised up from 49.3)
Services: no forecast available vs 51.9 previous (revised up from 51.4)
SATURDAY
09:00 USA Flash October PMI's
Manufacturing: 55.5 forecast vs 55.9 previous (revised down from 57.0)
Services: 58.0 forecast vs 58.8 previous (revised up from 58.7)
Interesting Movers
Trading higher
- Omega Oil & Gas (OMA) $0.78+12.2%
Drilling has commenced at Canyon North-1, the third well in the company’s 2026/27 appraisal program and the first well for the ATP 2081 joint venture with Tri-Star (30%) and Beach Energy (BPT) (25%) (Omega 45% and operator). Management noted that results from the program are expected in approximately four weeks.
- Actinogen Medical (ACW) $0.05+11.6%
Achieved database lock for the XanaMIA Phase 2b/3 Alzheimer’s trial allowing the company to narrow guidance for topline results to mid‑November from previous guidance of 'November'. (Database lock is the point at which the trial data is deemed as entirely final, clean, and locked to further changes.)
- Vulcan Steel (VSL) $5.63+10.6%
Issued a trading update at the company's AGM today. First quarter group revenue is $353.7m, up 39% y/y, with sales tonnes per day up 27% y/y and EBITDA up 51% vs same quarter last year. CEO Gavin Street said, "The industry is beginning to stabilise and there are signs of recovery [but] conditions remain challenging and the overall pace of recovery is uncertain."
- Corporate Travel Management (CTD) $3.29+7.5%
No news. Continued positive response to yesterday's news that the IATA has released the $65 million security guarantee provided by CTM and restored the company’s previous settlement cycles (was up 23% yesterday).
- Beach Energy (BPT) $0.96+5.8%
Posted record quarterly revenue of $565 million in the three months to Sept 30, up 41% from the June quarter. Production climbed 9% to 5.4 million barrels, driven by strong performance in the Otway and Bass Basins and the western flank of the Cooper Basin and record monthly Waitsia gas production. Management retained full-year guidance and settled a $43.5 million shareholder class action to be met by insurance with no impact on earnings or cash flow.
- Service Stream (SSM) $2.25+5.6%
Held its AGM. Management forecast FY27 is expected to deliver a "step change" in revenue and earnings growth. Group performance during Q1 FY27 reflects a "solid start".
- Megaport (MP1) $16.20+5.1%
Filing showed that Australian Retirement Trust has become a substantial shareholder in the company with a 5% stake.
- EBOS Group (EBO) $17.08+5.0%
Held its AGM. Management said positive growth continued through the quarter and reaffirmed FY27 guidance despite FX and fuel headwinds. Capex ~A$145m in FY26 to step down to ~A$100m in FY27, creating ~A$150m capacity for bolt‑on acquisitions.
- SEEK (SEK) $13.32+4.0%
Revised arrangements for its growth fund to deliver $840 million of liquidity to investors over the next five years (about $700m for the company). Expects to reduce management fees to $17 million and to save $5 million p.a. on fees for managing Seek‑owned assets as role has been moved back to Seek.
Trading Lower
- NEXTDC (NXT) $5.35-41.7%
Revealed power supply delays at its M3 data centre in Footscray after Jemena suspended works (citing community opposition and lack of council consent), forcing NextDC to slash FY revenue guidance to $475–$500m (from $615–$640m), cut underlying EBITDA guidance to $245–$265m (from $385–$410m) and reduce capex guidance to $4.5–$5bn (from $5.25–$5.75bn).
- Mayfield Group Holdings (MYG) $1.58-9.7%
No news today. Continued negative response to yesterday's AGM and trading update. MYG is a regular in the ChartWatch ASX Scans Downtrends List. 📉
- Telix Pharmaceuticals (TLX) $14.52-7.9%
Third-quarter revenues rose 19% to $US245 million ($351m). Precision medicine sales $US201m (30% higher year-on-year). Telix said revenue is tracking at the higher end of guidance and forecast current year revenue and other income to exceed $US1 billion. Management noted strong demand for Gozellix and Illuccix, and the company is buying ITM Isotope Technologies for $2.3 billion.
- 29Metals (29M) $0.29-5.7%
September quarter activities report. Management noted that group liquidity had declined to $142 million from $202 million as at 30 June due to a reduction in operating cash flow due to elevated costs and materially lower metal sales as a result of the major planned maintenance at Golden Grove.
- SKS Technologies Group (SKS) $6.09-4.1%
No news. SKS is a recent regular in the ChartWatch ASX Scans Downtrends List. 📉
Broker Moves
Company | Broker | Action | Rating | Price Target |
|---|---|---|---|---|
A2MThe a2 Milk Company | Citi | Retained | Buy | $7.40 |
ACEAcusensus | Ord Minnett | Retained | Buy | $1.53 |
AD8Audinate Group | Morgan Stanley | Retained | Overweight | $3.00 |
AELAmplitude Energy | Ord Minnett | Retained | Buy | $2.70(from $2.65) |
AHCAustco Healthcare | Bell Potter | Retained | Buy | $0.50(from $0.45) |
ALDAmpol | Ord Minnett | Retained | Buy | $47.50(from $48.00) |
| UBS | Retained | Buy | $46.30(from $47.75) | |
AMCAmcor Plc | Macquarie | Retained | Outperform | $70.00(from $71.30) |
AOVAmotiv | Citi | Retained | Neutral | $7.06 |
ASBAustal | Ord Minnett | Initiated | Buy | $5.75 |
AVHAVITA Medical, Inc. | Canaccord Genuity | Retained | Buy | $4.74(from $3.72) |
BAPBapcor | Citi | Retained | Neutral | $0.69 |
BCIBCI Minerals | Shaw and Partners | Retained | Buy | $0.72 |
BENBendigo and Adelaide Bank | Ord Minnett | Retained | Hold | $10.50(from $11.00) |
BGLBellevue Gold | Canaccord Genuity | Retained | Buy | $1.90 |
| Macquarie | Retained | Outperform | $1.80 | |
| UBS | Retained | Buy | $1.90(from $2.00) | |
BHPBHP Group | Macquarie | Retained | Neutral | $57.00 |
| Morgan Stanley | Retained | Overweight | $69.00 | |
| Ord Minnett | Upgraded | Accumulate(from Hold) | $63.00 | |
| UBS | Retained | Neutral | $62.00 | |
BLXBeacon Lighting Group | Ord Minnett | Retained | Buy | $2.65 |
BPGBlack Pearl Group | Bell Potter | Retained | Speculative Buy | $0.65(from $1.20) |
BREBrazilian Rare Earths | Ord Minnett | Retained | Speculative Buy | $6.50 |
CARCAR Group | Citi | Retained | Buy | $33.30 |
CCLCuscal | Ord Minnett | Retained | Buy | $7.00 |
CDACodan | Canaccord Genuity | Retained | Buy | $75.26(from $74.09) |
CGFChallenger | Ord Minnett | Downgraded | Hold(from Buy) | $12.05(from $11.85) |
CSCCapstone Copper Corp. | Morgans | Retained | Buy | $17.00(from $18.00) |
FPRFleetPartners Group | Ord Minnett | Downgraded | Hold(from Buy) | $5.30(from $3.40) |
GTKGentrack Group | Morgan Stanley | Retained | Equal Weight | $3.35 |
HUBHUB24 | Bell Potter | Retained | Hold | $75.00(from $90.00) |
| Canaccord Genuity | Retained | Buy | $92.65(from $95.10) | |
| Macquarie | Retained | Outperform | $89.05 | |
| Morgan Stanley | Retained | Overweight | $121.00 | |
| Ord Minnett | Upgraded | Buy(from Accumulate) | $90.00(from $93.00) | |
IMBIntelligent Monitoring Group | Morgans | Retained | Speculative Buy | $1.10 |
JDOJudo Capital Holdings | Macquarie | Retained | Outperform | $1.65 |
| Morgan Stanley | Retained | Overweight | $1.30 | |
| Morgans | Retained | Buy | $1.44(from $1.42) | |
MAPMicroba Life Sciences | Morgans | Downgraded | Hold(from Speculative Buy) | $0.08(from $0.12) |
MLXMetals X | Ord Minnett | Retained | Buy | $2.20 |
| Shaw and Partners | Upgraded | Buy(from Hold) | $1.90 | |
MMIMetro Mining | Ord Minnett | Retained | Buy | $1.75 |
MYGMayfield Group Holdings | Bell Potter | Retained | Buy | $3.10(from $3.20) |
NABNational Australia Bank | Ord Minnett | Retained | Hold | $37.00 |
NHCNew Hope Corporation | Morgans | Upgraded | Accumulate(from Hold) | $6.30(from $6.05) |
| Ord Minnett | Upgraded | Accumulate(from Hold) | $6.40(from $5.20) | |
NSTNorthern Star Resources | Citi | Retained | Neutral | $24.60 |
NXTNEXTDC | Macquarie | Retained | Outperform | $19.70 |
OMAOmega Oil & Gas | Bell Potter | Retained | Speculative Buy | $1.40 |
PWHPWR Holdings | Bell Potter | Retained | Hold | $11.25(from $11.50) |
| Morgans | Upgraded | Accumulate(from Hold) | $12.55(from $12.40) | |
| UBS | Retained | Neutral | $12.55 | |
RRLRegis Resources | Canaccord Genuity | Retained | Buy | $8.35(from $8.40) |
| Macquarie | Retained | Neutral | $7.40(from $7.80) | |
| Morgans | Downgraded | Hold(from Buy) | $6.46(from $9.39) | |
| UBS | Retained | Buy | $8.90(from $9.00) | |
RTHRAS Technology Holdings | Ord Minnett | Downgraded | Hold(from Buy) | $1.04(from $1.53) |
S32South32 | Ord Minnett | Upgraded | Buy(from Accumulate) | $5.50 |
SGPStockland | Ord Minnett | Retained | Accumulate | $4.55(from $4.75) |
SIGSigma Healthcare | Citi | Retained | Neutral | $2.90 |
TCLTransurban Group | Macquarie | Retained | Outperform | $14.00 |
WDSWoodside Energy Group | Macquarie | Retained | Neutral | $32.90 |
WEBWebBeds Group | Morgans | Retained | Buy | $4.50(from $3.75) |
WTMWaratah Minerals | Shaw and Partners | Retained | Buy | $1.55 |
ZIPZip Co | Citi | Retained | Buy | $3.30 |
Scans
Top Gainers
Code | Company | Last | % Chg |
|---|---|---|---|
| EGY | Energy Technologies Ltd | $0.046 | +130.00% |
| LNQ | LINQ Minerals Ltd | $0.52 | +40.54% |
| FRB | Firebird Metals Ltd | $0.14 | +40.00% |
| WRX | Western Ridge Resources Ltd | $0.06 | +33.33% |
| SOM | Somnomed Ltd | $0.29 | +23.40% |
Top Fallers
Code | Company | Last | % Chg |
|---|---|---|---|
| NXT | NEXTDC Ltd | $5.35 | -41.72% |
| BWF | Blackwall Ltd | $0.092 | -23.33% |
| RCL | Readcloud Ltd | $0.041 | -22.64% |
| TGH | Terragen Holdings Ltd | $0.014 | -22.22% |
| SLD | Saluda Medical, Inc | $0.265 | -20.90% |
52 Week Highs
Code | Company | Last | % Chg |
|---|---|---|---|
| EGY | Energy Technologies Ltd | $0.046 | +130.00% |
| WRX | Western Ridge Resources Ltd | $0.06 | +33.33% |
| FMR | FMR Resources Ltd | $0.66 | +15.79% |
| AVH | Avita Medical Inc | $3.99 | +5.56% |
| DRUG | Betashares Global Healthcare Currency Hedged ETF | $9.36 | +2.18% |
52 Week Lows
Code | Company | Last | % Chg |
|---|---|---|---|
| NXT | NEXTDC Ltd | $5.35 | -41.72% |
| BWF | Blackwall Ltd | $0.092 | -23.33% |
| RCL | Readcloud Ltd | $0.041 | -22.64% |
| TGH | Terragen Holdings Ltd | $0.014 | -22.22% |
| SLD | Saluda Medical, Inc | $0.265 | -20.90% |
Near Highs
Code | Company | Last | % Chg |
|---|---|---|---|
| PCI | Perpetual Credit Income Trust | $1.08 | -0.92% |
| WVOL | iShares MSCI World Ex Aust Minimum Volatility ETF | $47.08 | +0.04% |
| IAGPF | Insurance Australia Group Ltd | $105.77 | +0.21% |
| GCI | Gryphon Capital Income Trust | $2.01 | 0.00% |
| VVLU | Vanguard Global Value Equity Active ETF | $82.15 | +0.56% |
Relative Strength Index (RSI) Oversold
Code | Company | Last | % Chg |
|---|---|---|---|
| RAC | Racura Oncology Ltd | $1.56 | -1.89% |
| FFM | Firefly Metals Ltd | $1.34 | -1.11% |
| TLG | Talga Group Ltd | $0.205 | -1.21% |
| NVA | Nova Minerals Corp | $0.36 | -6.49% |
| GLN | Galan Lithium Ltd | $0.225 | 0.00% |