News | Market Wraps
Evening Wrap: ASX 200 sags as National Australia Bank and Mineral Resources plummet post results
The S&P/ASX 200 closed 61.8 points lower, down 0.73%.

Mentioned
The S&P/ASX 200 closed 61.8 points lower, down 0.73%.
Disappointing results from National Australia Bank (NAB) and iron ore, lithium, and mining services company Mineral Resources (MIN) dragged on the ASX 200 today.
There were some bright spots, however, as rising natural gas prices helped the Utilities sector, and another big jump in market darling Pro Medicus (PME) bolstered Healthcare.
Click/scroll through for the usual reporting of the major sector and stock-specific moves, the broker responses to them, as well as all the key upcoming economic data in tonight's Evening Wrap.
Also, I have detailed technical analysis on the S&P/ASX 200, Market response to RBA rate cut, and Natural Gas in today's ChartWatch.
Let's dive in!
Today in Review
Wed 19 Feb 25, 5:01pm (AEST)
Name | Value | % Chg |
|---|---|---|
Major Indices | ||
| ASX 200 | 8,419.2 | -0.73% |
| All Ords | 8,699.1 | -0.66% |
| Small Ords | 3,245.7 | -0.03% |
| All Tech | 4,132.0 | +0.70% |
| Emerging Companies | 2,391.4 | -0.27% |
Currency | ||
| AUD/USD | 0.6366 | +0.22% |
US Futures | ||
| S&P 500 | 6,152.5 | +0.09% |
| Dow Jones | 44,686.0 | +0.10% |
| Nasdaq | 22,261.0 | +0.13% |
Name | Value | % Chg |
|---|---|---|
Sector | ||
| Utilities | 8,738.0 | +0.84% |
| Communication Services | 1,683.4 | +0.80% |
| Health Care | 44,028.0 | +0.75% |
| Industrials | 8,032.3 | +0.31% |
| Materials | 17,109.4 | +0.03% |
| Consumer Discretionary | 4,231.2 | -0.15% |
| Information Technology | 2,883.8 | -0.39% |
| Real Estate | 3,953.9 | -0.69% |
| Consumer Staples | 12,022.6 | -0.80% |
| Financials | 8,806.2 | -2.01% |
| Energy | 8,195.1 | -2.35% |
Markets

ASX 200 Session Chart
The S&P/ASX 200 (XJO) finished 61.8 points lower at 8,419.2, 0.76% from its session high and 0.36% from its low. In the broader-based S&P/ASX 300 (XKO), advancers lagged decliners by a modest 120 to 167.
It was a barbell in terms of sector performance on the ASX today. Gold (XGD) (+1.5%) (gold price spiked back up overnight), Utilities (XUJ) (+0.84%) (natural gas price also spiked – see ChartWatch below for technical analysis), and Health Care (XHJ) (+0.75%) (Pro Medicus (ASX: PME) (+6.2%) spiked today as it is want to do!) each prospered.
But, as I work through the other side of the barbell, you will see the weight of index points substantially outweighed the contributions above, hence the overall inevitable decline in the benchmark ASX 200.
Energy (XEJ) (-2.3%) was down again on a 5% sell off in Santos (ASX: STO) following the release of its full year 2025 results, but there were similar heavy falls in beleaguered coal stocks. New Hope Corporation (ASX: NHC) (-4.0%), Whitehaven Coal (ASX: WHC) (-2.8%), and Coronado Global Resources (ASX: CRN) (-3.2%) were notable decliners here, but I note a continued decline in the uranium price dragged on that segment of the Energy sector also.
As bad as Energy is/was (the charts have told the story here for months! 📉), in terms of index points, its sector-wide contribution was probably only akin to the contribution (or destruction in index points) from the Big 4 Banks.
It’s been a week to forget for the banking sector as a combination of full-year and quarterly results have fallen at odds with the sector’s strong rally over the past 6 months. Today, it was National Australia Bank (ASX: NAB) (-8.1%) and its quarterly results that did the damage.
Everything in the middle of the barbell saw only modest gains or losses, but there was a tinge of “money flowing out of interest rate sensitives” like Real Estate Investment Trusts (XPJ) (-0.59%), Information Technology (XIJ) (-0.39%), and Consumer Discretionary (XDJ) (-0.15%), as local long term risk-free rates spiked in the wake of yesterday's RBA meeting – more details on that in ChartWatch below.
ChartWatch
S&P/ASX 200 (XJO)
%20chart%2019%20Februuary%202024.png)
Dismal and disappointing...😭 (click here for full size image)
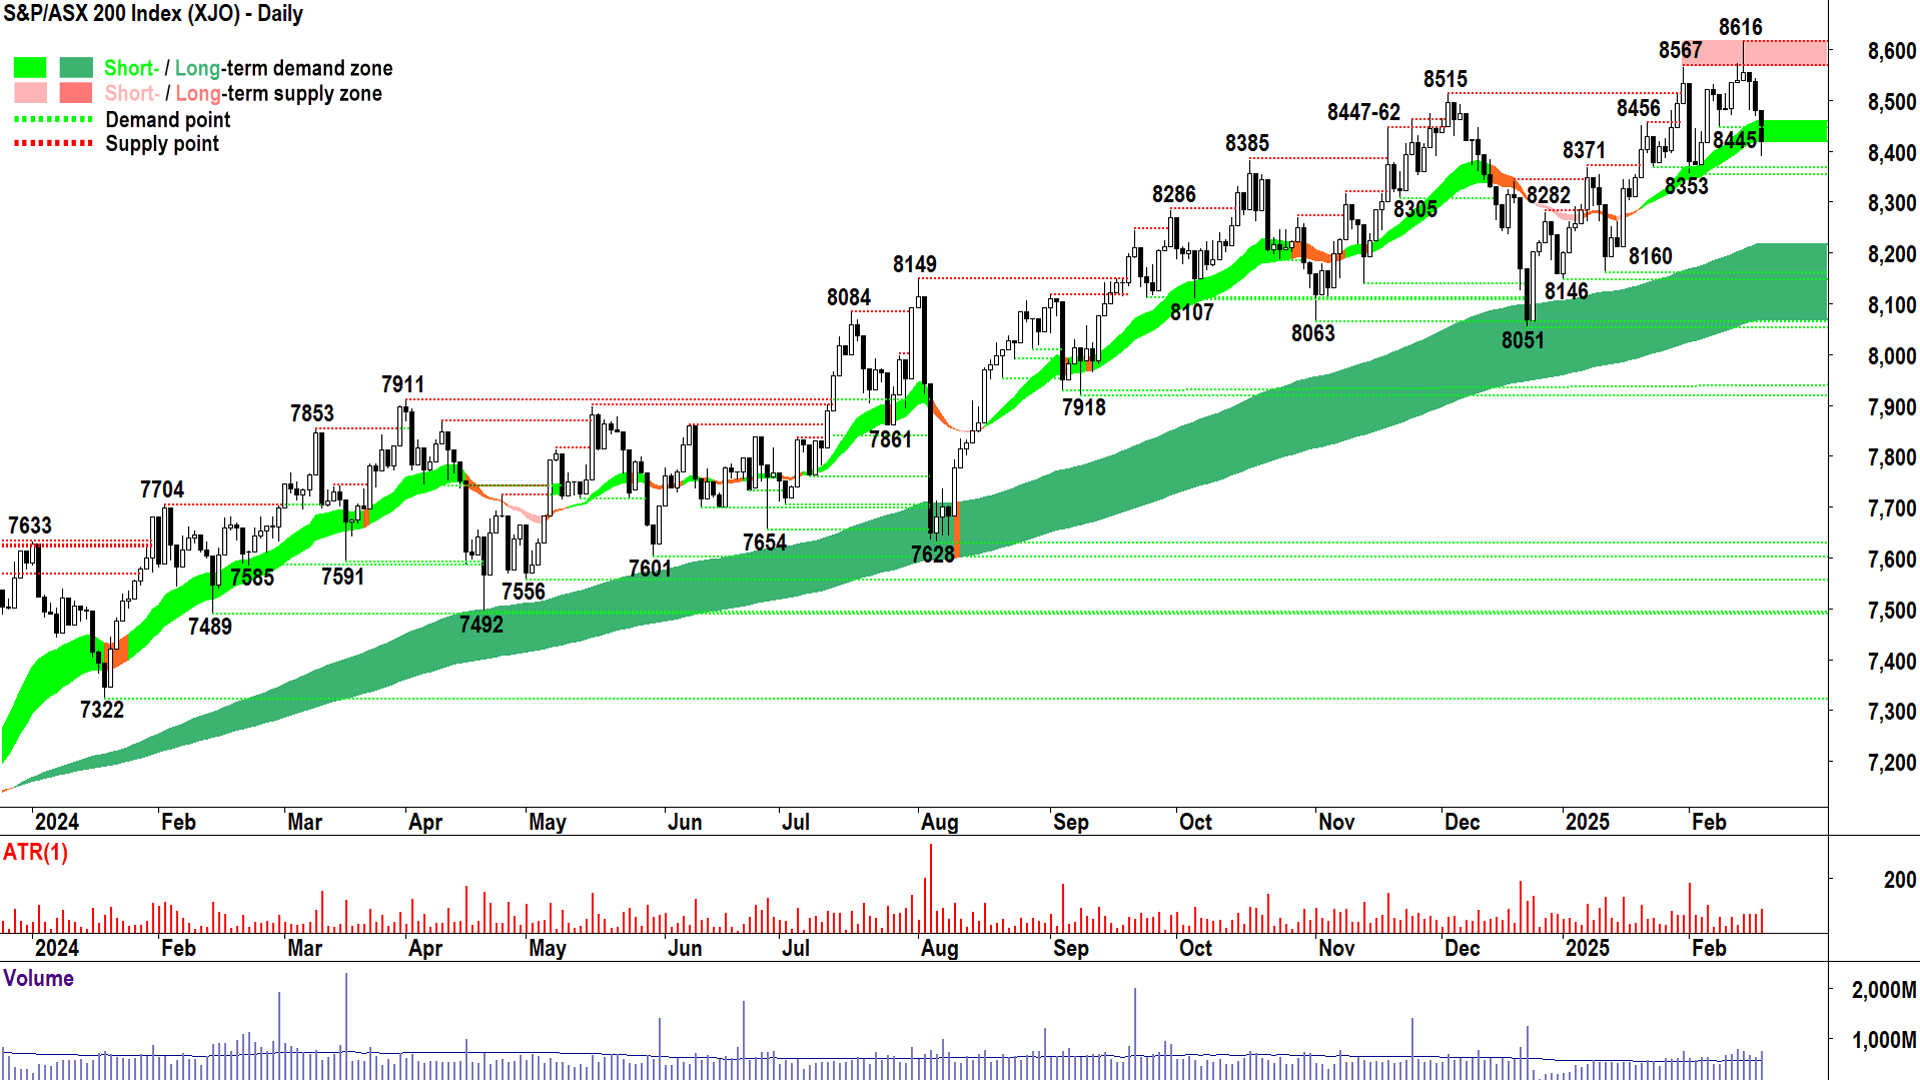
It’s all a bit dismal and disappointing here, isn’t it? 🤔
If I made a mistake in my analysis on this chart, it was in the last update on it in the Evening Wrap on 14 February where I proposed the “disappointing” candles of 13-Feb and 14-Feb – two consecutive closing highs – weren’t anything to be concerned about.
Hindsight is a wonderful thing, of course, and this Harry probably should be too annoyed with his inability to draw a line between those two upward pointing shadows (indicating sell the rally activity) and the subsequent sell off.
Perhaps I gave the Aussie stock market too much credit. To be fair, though, record highs is usually a reliable indicator of excess demand – and not the pathetic display we’ve seen over the last couple of trading sessions. Two credible supply-side showings now.
Also to be fair, the RBA did bash the market on the head yesterday with a “No you petulant children – you are NOT getting four interest rate cuts over the next 12 months – pull your collective heads in!”. Or something to that effect.
So, there’s that.

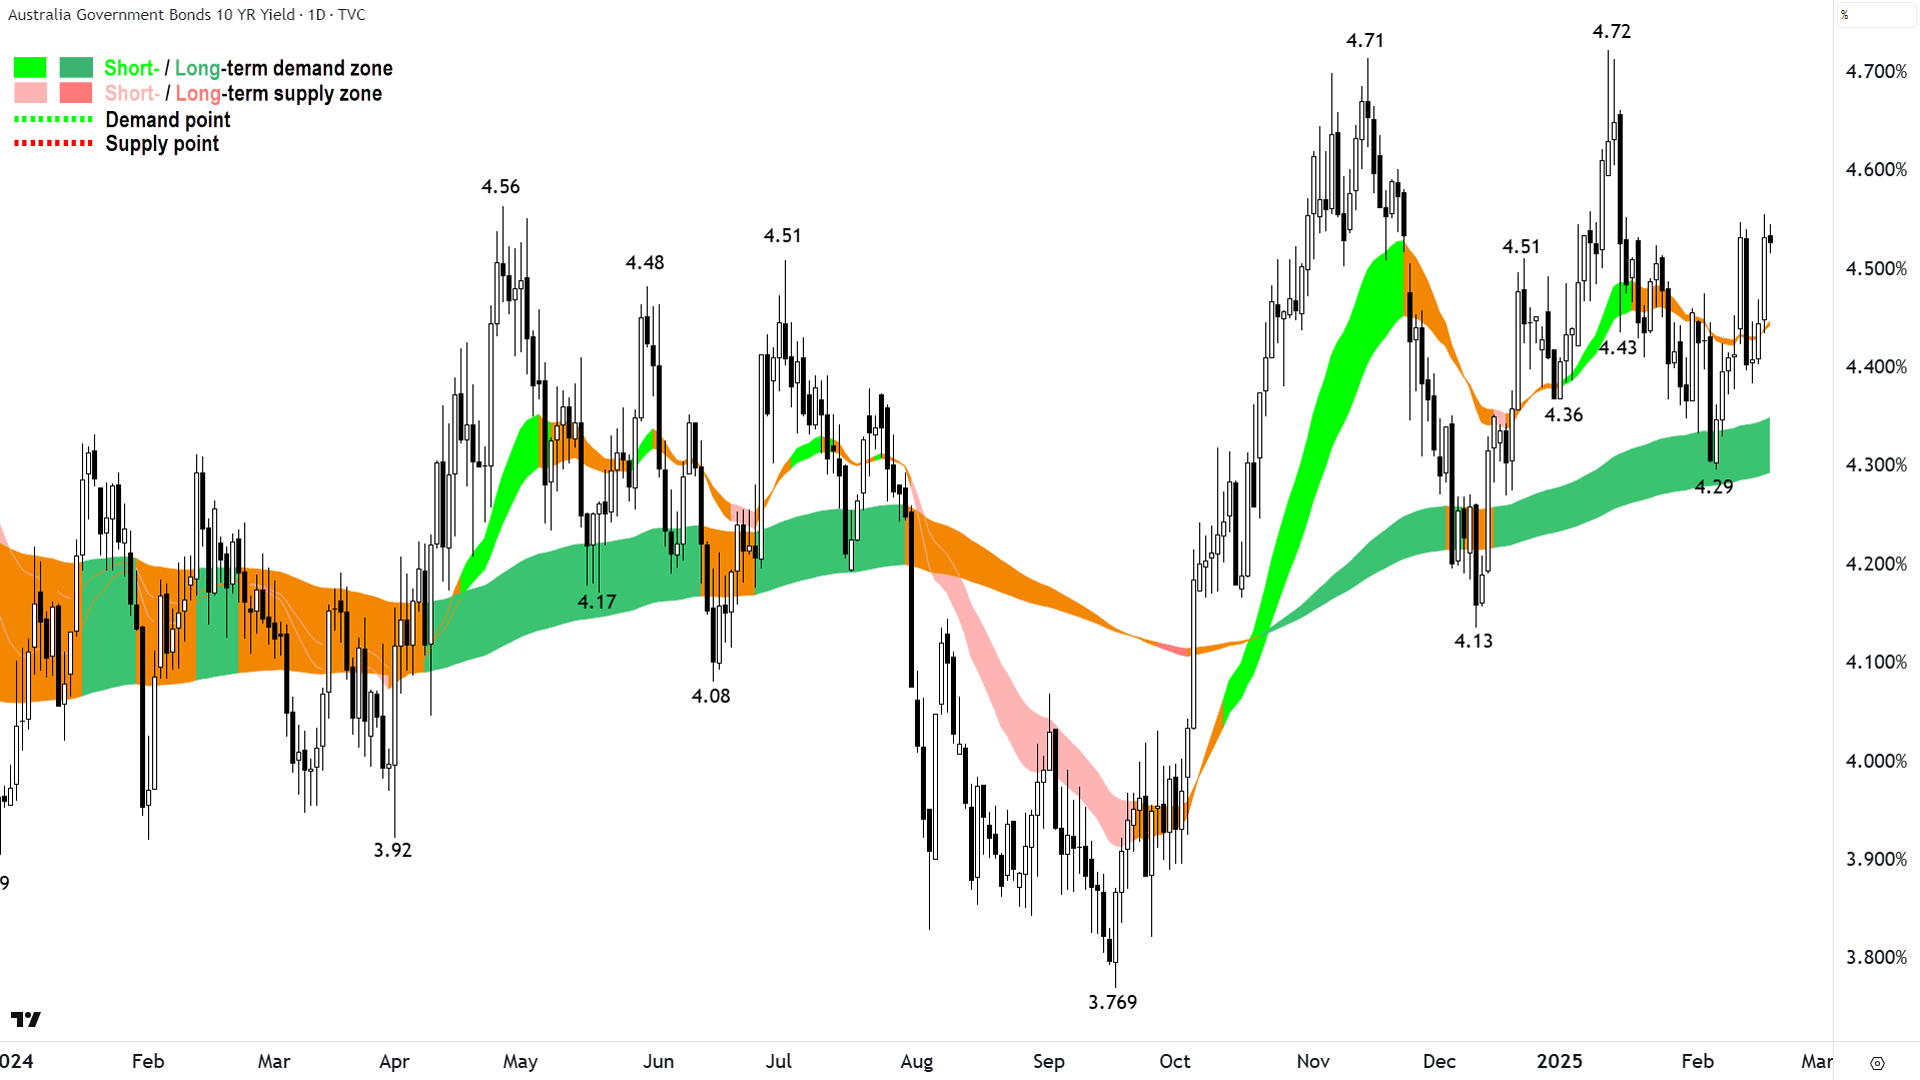
Australian 10-year bond yield (click here for full size image)
Local long term risk free yields were jammed higher as a result, and you know that stocks hate higher risk-free market yields.
There was some encouragement from the modest downward pointing shadow today, seemingly for now holding the dynamic demand I’d usually expect to kick in at the short term uptrend ribbon. 8445 was dispensed with, however.
As suggested previously, the real / important point of demand is more likely 8353, and so far, it appears intact. Below it, though, I’d ratchet up my concern level a notch. ⚠️
The obvious counter for the last two sessions is white candles and high closes. This would put us back on track in the still-prevailing short and long term uptrends.
Should we see a righting of the ship into week’s end, then supply is now likely substantial between 8567-8616.
Natural Gas Futures (Front month, back-adjusted) NYMEX
%20NYMEX%20chart%2019%20Februuary%202024.png)
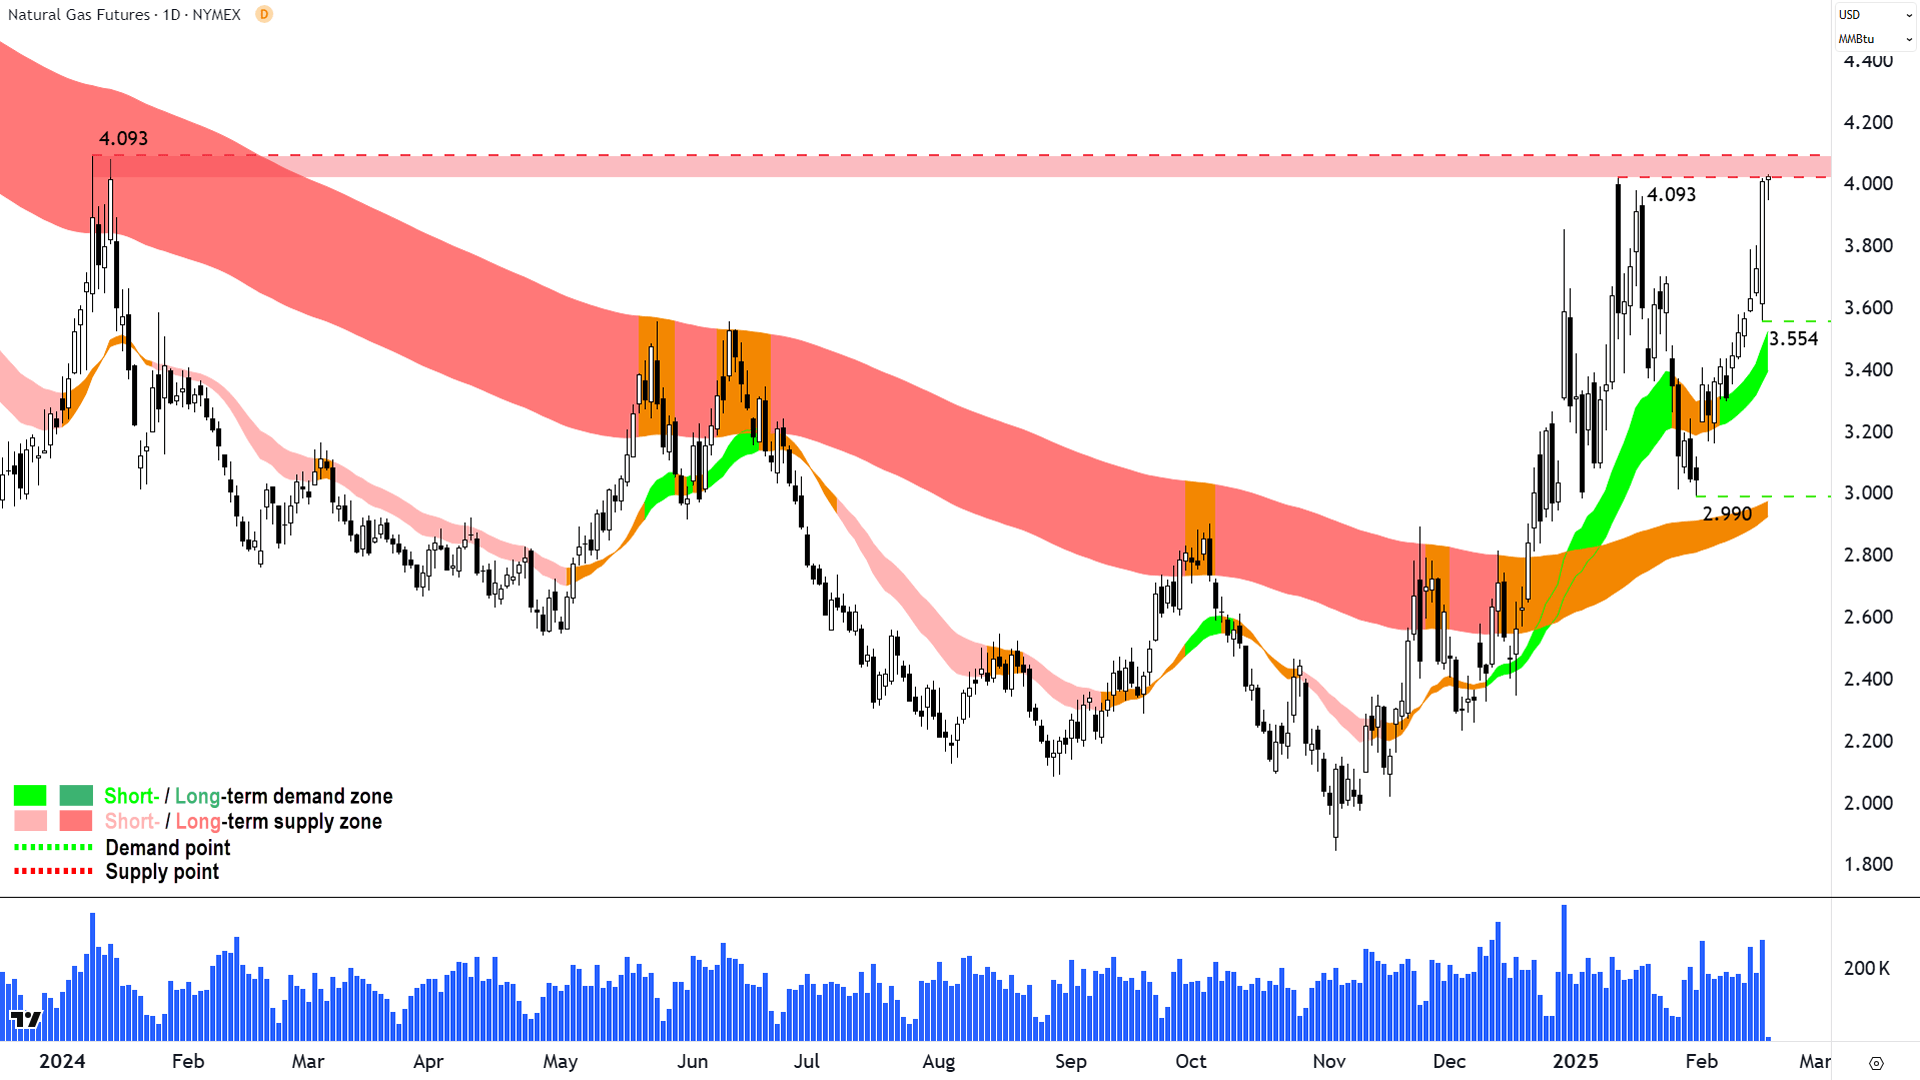
A really interesting chart! 📉📈 (click here for full size image)
We’ve never covered US Natural Gas before, because it is a price point that is very specific to US natural gas producers and consumers. There’s another completely different contract for the European market, and also one for the Chinese / Asian markets.
So, one can’t really look at this chart and go – “Ooh, ooh that must be good for Woodside and Santos”.
It doesn’t really work like that, but it would also be inaccurate to say that a move in one regional contract doesn’t influence moves in others. Arbitrage ensures there’s some linkages.
Either way, it’s just a chart I think is really interesting – and that’s all I aim to do here – show you really interesting charts! 🧐
This looks like a classic turnaround setup here, specifically a long term downtrend to long term uptrend turnaround – because you can also have the opposite.
As you know, my rules for a turnarounds are as follows:
The price must close above the long term trend ribbon
The long term trend ribbon must transition to at least amber (i.e., at least long term equilibrium in the demand-supply environment)
The long term trend ribbon must demonstrate that it is now acting as a zone of dynamic demand (as opposed to the likely long period of it acting as dynamic supply in the long term downtrend – e.g., check the chart above because my long term downtrend ribbon was darn-near perfection 💯!)
The short term trend ribbon shows an uptrend, it is expanding, and it’s also acting as a zone of dynamic demand
The price action has switched to rising peaks and rising troughs (i.e., back to demand reinforcement and supply removal)
The candles are predominantly demand-side in nature (i.e., white-bodied and or downward pointing shadows indicating accumulation and buy the dip activity)
As each of the above are consistent with a demand-side market in both the long and short term – then what other option do I have but to adopt a bullish posture and look for long-side trading opportunities?
Keep in mind my usual disclaimer that even if one ticks all of the above checkboxes – continued price appreciation is NOT guaranteed. There are no guarantees in markets. Anything can and will happen in the chart (because anything can and will happen in the world around us).
My job is simply to identify how the demand-supply environment is placed – and to follow that broad consensus. If the consensus changes, so too will my view.
Your job is your job – and you can do it any way you like, of course. But if you want to do it my way, then I hope the above criteria for identifying a “Turnaround Setup”* as I call it, will be helpful.
We’ll keep tabs on the NatGas chart going forward to see how it turns out, but I suggest a close above the critical 4.02-4.093 static supply zone potentially frees the way for it to probe significantly higher supply zones (4.757 is the next key supply level from the Weekly chart, not shown).
(*Note: I have just 3 setups: Continuation, Turnaround, and Aggressive – the other two are perhaps topics for another ChartWatch!).
Economy
Today
AUS Wage Price Index December quarter
+0.7% q/q actual vs +0.9% q/q in September revised up from +0.8% q/q
Annual wage growth +3.2% p.a. vs +3.6% p.a. in September quarter
Will please RBA who yesterday cited wages growth as a particular pressure point with respect to the bank's rates calculations going forwards
Later this week
Thursday
06:00 USA Federal Open Markets Committee (FOMC) February meeting minutes
11:30 Employment Data January
Employment change: (+19,700 forecast vs +56,300 in December)
Unemployment rate: (4.1% forecast vs 4.0% in December)
12:00 CHN People's Bank of China (PBOC) key interest rates
1-y Loan Prime Rate: 3.10% (no change)
5-y Loan Prime Rate: 3.60% (no change)
Friday
09:00 Flash Manufacturing & Services Purchasing Managers Index (PMI) January
Manufacturing PMI (50.2 previous)
Services PMI (51.2 previous)
09:30 RBA Governor Michelle Bullock speech
18:00 (from) Various EU Manufacturing and Services PMIs January
Saturday
01:45 USA Flash Manufacturing & Services Purchasing Managers Index (PMI) January
Manufacturing PMI (forecast 51.2 vs 51.2 in December)
Services PMI (forecast 53.2 vs 52.9 in December)
Latest News
Interesting Movers
Trading higher
+16.3% Biome Australia (BIO) - Continued positive response to 18-Feb Biome First Half FY25 Results and Highlights, rise is consistent with prevailing short and long term uptrends 🔎📈
+15.5% Navigator Global Investments (NGI) - Appendix 4D and Interim Financial Report and Interim Results Presentation.
+14.2% Southern Cross Electrical Engineering (SXE) - Appendix 4D and Investor Presentation - H1 FY25 Results.
+10.3% Corporate Travel Management (CTD) - Profit Guidance, rise is consistent with prevailing short and long term uptrends, a recent regular in ChartWatch ASX Scans Uptrends list 🔎📈
+9.6% Light & Wonder (LNW) - Strategic Acquisition - Charitable Gaming Assets, rise is consistent with prevailing short and long term uptrends 🔎📈
+8.7% Retail Food Group (RFG) - Appendix 4D & 1H25 Financial Report and Launch of Firehouse Subs in Australia.
+8.3% Meeka Metals (MEK) - 16m @ 9.45g/t Au - High-Grade Gold Continues at St Annes, general strength across the broader Gold sector today, rise is consistent with prevailing short and long term uptrends, a regular in ChartWatch ASX Scans Uptrends list 🔎📈
+7.7% Data#3 (DTL) - Half Yearly Report and Accounts.
+7.4% Bubs Australia (BUB) - No news, likely positive fall out from recent strong performance at A2 Milk Co. (A2M).
+7.4% Adriatic Metals (ADT) - Successful Completion of Placement, general strength across the broader Gold sector today, rise is consistent with prevailing short and long term uptrends, a regular in ChartWatch ASX Scans Uptrends list 🔎📈
+7.0% Shape Australia Corporation (SHA) - Appendix 4D and Half Year Report and Half Year Results Presentation, rise is consistent with prevailing short and long term uptrends, a regular in ChartWatch ASX Scans Uptrends list 🔎📈
+7.0% Ventia Services Group (VNT) - Appendix 4E and 2024 Annual Report and FY24 Results - Presentation.
+6.2% Pro Medicus (PME) - No news since 13-Feb HY25 Results, rise is consistent with prevailing short and long term uptrends, one of the most Featured (highest conviction) stocks in ChartWatch ASX Scans Uptrends list 🔎📈
+6.1% Smart Parking (SPZ) - Successful Completion of Institutional Offer, rise is consistent with prevailing short and long term uptrends, a regular in ChartWatch ASX Scans Uptrends list 🔎📈
+5.9% St Barbara (SBM) - December 2024 Half Year Report, general strength across the broader Gold sector today.
+5.8% Seek (SEK) - Continued positive response to 18-Feb FY2025 Half Year Results.
Trading lower
-28.8% Step One Clothing (STP) - 1H25 Appendix 4D & Half Year Report and 1H25 Results Presentation, fall is consistent with prevailing short term downtrend and long term trend is transitioning from up to down 🔎📉
-20.7% Mineral Resources (MIN) - FY25 Half Year Financial Report and Appendix 4D and FY25 Half Year Results Presentation, fall is consistent with prevailing short and long term downtrends, one of the most Featured (highest conviction) stocks in ChartWatch ASX Scans Downtrends list 🔎📉
-11.4% Lycopodium (LYL) - Half Yearly Report and Investor Presentation 1HFY2025.
-9.7% The Star Entertainment Group (SGR) - No news since 17-Feb Debt Refinancing Proposal, today's move is consistent with recent volatility.
-8.3% Audinate Group (AD8) - No news since 17-Feb 2025 Half Year Results, repelled perfectly from long term downtrend ribbon! 🔎📉
-8.1% National Australia Bank (NAB) - 2025 First Quarter Trading Update.
-7.1% Imugene (IMU) - No news, fall is consistent with prevailing short and long term downtrends, a regular in ChartWatch ASX Scans Downtrends list 🔎📉
-5.1% Lotus Resources (LOT) - No news, general weakness across the broader Uranium sector today, fall is consistent with prevailing short and long term downtrends, a regular in ChartWatch ASX Scans Downtrends list 🔎📉
-4.8% Mystate (MYS) - MyState Limited HY25 Investor Presentation and MyState Limited and Auswide Bank Merger Implemented.
-4.8% Pilbara Minerals (PLS) - Becoming a substantial holder, plenty of references to "securities lending agreement" in there…means short sellers, fall is consistent with prevailing short and long term downtrends, one of the most Featured (highest conviction) stocks in ChartWatch ASX Scans Downtrends list 🔎📉
-4.8% Emeco (EHL) - Appendix 4D Half Year Report 1H25 and 1H25 Results Presentation.
-4.6% Hansen Technologies (HSN) - Appendix 4D 31 December 2024 and 1H25 Results Presentation.
-4.5% Santos (STO) - Appendix 4E and 2024 Annual Report and Santos 2024 Full-year results, general weakness across the broader Energy sector today, fall is consistent with prevailing short and long term downtrends, a regular in ChartWatch ASX Scans Downtrends list 🔎📉
Broker Moves
3P Learning (3PL)
Retained at equal-weight at Morgan Stanley; Price Target: $0.900 from $1.050
Aristocrat Leisure (ALL)
Retained at overweight at Morgan Stanley; Price Target: $75.00
ARB Corporation (ARB)
Retained at hold at Canaccord Genuity; Price Target: $34.70
Retained at buy at Citi; Price Target: $51.20 from $49.22
Retained at neutral at Goldman Sachs; Price Target: $38.00 from $39.20
Upgraded to neutral from underweight at JP Morgan; Price Target: $37.00
Upgraded to outperform from neutral at Macquarie; Price Target: $45.40 from $43.80
Retained at overweight at Morgan Stanley; Price Target: $46.00
Retained at hold at Morgans; Price Target: $35.76 from $37.75
Retained at buy at Ord Minnett; Price Target: $45.00 from $47.15
Retained at outperform at RBC Capital Markets; Price Target: $45.00
Retained at sell at UBS; Price Target: $34.00 from $34.50
Aurizon (AZJ)
Retained at neutral at Macquarie; Price Target: $3.41 from $3.52
Bapcor (BAP)
Retained at neutral at Citi; Price Target: $5.17
Baby Bunting Group (BBN)
Retained at buy at Citi; Price Target: $2.42 from $2.01
Retained at neutral at Macquarie; Price Target: $1.850 from $1.650
Retained at overweight at Morgan Stanley; Price Target: $2.20 from $2.00
Retained at hold at Morgans; Price Target: $1.900 from $1.800
Retained at accumulate at Ord Minnett; Price Target: $2.15
BHP Group (BHP)
Retained at buy at Citi; Price Target: $46.00
Retained at buy at Goldman Sachs; Price Target: $47.40 from $46.80
Retained at outperform at Macquarie; Price Target: $42.00
Retained at overweight at Morgan Stanley; Price Target: $48.50
Retained at add at Morgans; Price Target: $48.10 from $49.70
Retained at accumulate at Ord Minnett; Price Target: $43.00
Retained at sector perform at RBC Capital Markets; Price Target: $45.00
Biome Australia (BIO)
Retained at buy at Bell Potter; Price Target: $0.850
Big River Industries (BRI)
Retained at buy at Ord Minnett; Price Target: $1.760 from $1.730
Bluescope Steel (BSL)
Retained at accumulate at Ord Minnett; Price Target: $27.50 from $24.00
Challenger (CGF)
Retained at buy at Bell Potter; Price Target: $7.80 from $8.25
Retained at buy at Citi; Price Target: $6.70 from $7.80
Retained at buy at Goldman Sachs; Price Target: $7.30 from $7.60
Upgraded to overweight from neutral at JP Morgan; Price Target: $6.30 from $6.80
Retained at outperform at Macquarie; Price Target: $6.60 from $7.10
Retained at equal-weight at Morgan Stanley; Price Target: $5.95 from $6.60
Retained at add at Morgans; Price Target: $6.93 from $7.90
Retained at buy at UBS; Price Target: $7.65
Corporate Travel Management (CTD)
Retained at buy at Citi; Price Target: $13.90
Retained at sector perform at RBC Capital Markets; Price Target: $14.50
Retained at neutral at UBS; Price Target: $13.55
Cleanaway Waste Management (CWY)
Retained at outperform at RBC Capital Markets; Price Target: $3.40
Retained at buy at UBS; Price Target: $3.30
DigiCo REIT (DGT)
Retained at buy at UBS; Price Target: $5.60
Deterra Royalties (DRR)
Retained at buy at Canaccord Genuity; Price Target: $4.90
Retained at neutral at Citi; Price Target: $4.50 from $4.40
Retained at buy at Goldman Sachs; Price Target: $4.70
Data#3 (DTL)
Retained at positive at E&P; Price Target: $9.11
Retained at neutral at UBS; Price Target: $7.30
Dexus (DXS)
Retained at negative at Citi; Price Target: $7.80 from $7.30
Retained at outperform at Macquarie; Price Target: $8.08 from $7.74
Retained at underweight at Morgan Stanley; Price Target: $7.30
Goodman Group (GMG)
Retained at buy at Citi; Price Target: $40.00
Retained at neutral at UBS; Price Target: $38.45
HMC Capital (HMC)
Retained at buy at Goldman Sachs; Price Target: $12.30 from $9.86
Retained at equal-weight at Morgan Stanley; Price Target: $11.96
Retained at buy at UBS; Price Target: $12.40 from $10.85
Hansen Technologies (HSN)
Retained at outperform at RBC Capital Markets; Price Target: $6.20
Retained at buy at UBS; Price Target: $6.50
Hub24 (HUB)
Retained at buy at Bell Potter; Price Target: $93.00 from $79.20
Retained at hold at Canaccord Genuity; Price Target: $85.00 from $74.65
Retained at neutral at Macquarie; Price Target: $89.30 from $62.10
Retained at hold at Moelis Australia; Price Target: $88.58
Retained at hold at Moelis Australia; Price Target: $88.58
Retained at overweight at Morgan Stanley; Price Target: $79.00
Retained at hold at Morgans; Price Target: $80.16 from $69.55
Downgraded to hold from buy at Ord Minnett; Price Target: $84.00 from $73.00
Retained at sector perform at RBC Capital Markets; Price Target: $75.00 from $65.00
Retained at neutral at UBS; Price Target: $86.00 from $75.50
Downgraded to market-weight from overweight at Wilsons; Price Target: $82.00 from $80.00
Humm Group (HUM)
Retained at buy at Ord Minnett; Price Target: $0.900
Retained at buy at Shaw and Partners; Price Target: $1.000
Infomedia (IFM)
Retained at buy at Bell Potter; Price Target: $1.750 from $1.780
Retained at buy at Shaw and Partners; Price Target: $2.10
Retained at buy at UBS; Price Target: $1.750
Infratil (IFT)
Retained at overweight at Morgan Stanley; Price Target: NZ$15.00
Judo Capital (JDO)
Retained at sell at Citi; Price Target: $1.600 from $1.350
Retained at neutral at Macquarie; Price Target: $1.850 from $1.750
Retained at overweight at Morgan Stanley; Price Target: $2.30 from $1.79
Retained at hold at Morgans; Price Target: $2.08 from $1.96
Upgraded to buy at Ord Minnett; Price Target: $2.50 from $1.80
Retained at buy at UBS; Price Target: $2.55 from $2.50
James Hardie Industries (JHX)
Retained at neutral at Citi; Price Target: $56.00
Retained at sector perform at RBC Capital Markets; Price Target: $52.00
Retained at buy at UBS; Price Target: $61.00
Lendlease Group (LLC)
Retained at neutral at Citi; Price Target: $7.50 from $8.00
Retained at outperform at CLSA; Price Target: $7.40 from $7.30
Retained at neutral at JP Morgan; Price Target: $6.75 from $6.50
Retained at outperform at Macquarie; Price Target: $7.24 from $7.08
Retained at hold at Ord Minnett; Price Target: $6.30 from $6.40
Retained at sell at UBS; Price Target: $6.38 from $6.25
Light & Wonder (LNW)
Retained at neutral at Citi; Price Target: $156.00
Macmahon (MAH)
Retained at buy at Argonaut Securities; Price Target: $0.470 from $0.450
Retained at buy at Canaccord Genuity; Price Target: $0.370
Retained at buy at Euroz Hartleys; Price Target: $0.410
Retained at overweight at Jarden; Price Target: $0.340 from $0.320
Mineral Resources (MIN)
Retained at neutral at Citi; Price Target: $35.00
Retained at neutral at Macquarie; Price Target: $36.00
Monadelphous Group (MND)
Retained at hold at Bell Potter; Price Target: $15.90 from $13.90
Retained at neutral at Citi; Price Target: $16.65 from $16.30
Downgraded to neutral from overweight at Jarden; Price Target: $16.10 from $13.50
Retained at neutral at JP Morgan; Price Target: $15.80 from $13.60
Retained at outperform at Macquarie; Price Target: $17.40 from $15.93
Upgraded to add from hold at Morgans; Price Target: $17.50 from $14.80
Retained at neutral at UBS; Price Target: $16.00 from $15.45
National Australia Bank (NAB)
Retained at sell at Citi; Price Target: $26.50
Retained at sell at UBS; Price Target: $37.50
Orora (ORA)
Downgraded to neutral from buy at Goldman Sachs; Price Target: $2.40 from $2.75
Reliance Worldwide Corporation (RWC)
Retained at buy at Citi; Price Target: $5.90 from $5.85
Retained at buy at Goldman Sachs; Price Target: $6.00 from $6.05
Retained at neutral at Jarden; Price Target: $5.60 from $5.70
Retained at outperform at Macquarie; Price Target: $5.90 from $6.55
Retained at equal-weight at Morgan Stanley; Price Target: $5.00
Retained at add at Morgans; Price Target: $5.80 from $6.10
Retained at accumulate at Ord Minnett; Price Target: $5.70 from $5.80
Retained at neutral at UBS; Price Target: $5.60 from $5.85
Seek (SEK)
Retained at sell at Goldman Sachs; Price Target: $24.00 from $21.50
Retained at buy at Jarden; Price Target: $28.00
Retained at outperform at Macquarie; Price Target: $26.75 from $25.00
Retained at overweight at Morgan Stanley; Price Target: $30.00
Retained at add at Morgans; Price Target: $27.20
Retained at buy at UBS; Price Target: $30.10 from $29.20
Stockland (SGP)
Retained at buy at Citi; Price Target: $5.80
Retained at neutral at UBS; Price Target: $5.32
Select Harvests (SHV)
Retained at buy at Bell Potter; Price Target: $5.80 from $5.00
Retained at buy at Ord Minnett; Price Target: $5.85 from $4.95
Downgraded to neutral from buy at UBS; Price Target: $5.00 from $4.40
SRG Global (SRG)
Retained at buy at Argonaut Securities; Price Target: $1.540 from $1.430
Retained at buy at Bell Potter; Price Target: $1.650 from $1.550
Retained at accumulate at Ord Minnett; Price Target: $1.410 from $1.320
Retained at buy at Shaw and Partners; Price Target: $1.600 from $1.600
Retained at buy at Unified Capital Partners; Price Target: $1.780 from $1.670
Servcorp (SRV)
Retained at buy at UBS; Price Target: $5.50
Santos (STO)
Retained at buy at Citi; Price Target: $7.60
Downgraded to hold from add at Morgans; Price Target: $7.20 from $7.40
Retained at buy at UBS; Price Target: $8.10
The Lottery Corporation (TLC)
Retained at buy at Citi; Price Target: $5.60
Vicinity Centres (VCX)
Retained at neutral at Citi; Price Target: $2.20
Retained at neutral at UBS; Price Target: $2.24
Ventia Services Group (VNT)
Retained at outperform at RBC Capital Markets; Price Target: $4.75
Woodside Energy Group (WDS)
Retained at hold at Ord Minnett; Price Target: $25.50 from $26.00
Scans
Top Gainers
Code | Company | Last | % Chg |
|---|---|---|---|
| WC1 | West Cobar Metals Ltd | $0.024 | +50.00% |
| PNT | Panther Metals Ltd | $0.017 | +41.67% |
| CSS | Clean Seas Seafood Ltd | $0.125 | +35.87% |
| RGT | Argent Biopharma Ltd | $0.19 | +35.71% |
| C1X | Cosmos Exploration Ltd | $0.115 | +35.29% |
Top Fallers
Code | Company | Last | % Chg |
|---|---|---|---|
| STP | Step One Clothing Ltd | $1.015 | -28.77% |
| ANR | Anatara Lifesciences Ltd | $0.042 | -23.64% |
| MIN | Mineral Resources Ltd | $24.18 | -20.72% |
| SCP | Scalare Partners Holdings Ltd | $0.155 | -20.51% |
| AU1 | The Agency Group Australia Ltd | $0.018 | -18.18% |
52 Week Highs
Code | Company | Last | % Chg |
|---|---|---|---|
| C1X | Cosmos Exploration Ltd | $0.115 | +35.29% |
| EPX | Ep&T Global Ltd | $0.033 | +17.86% |
| WGR | Western Gold Resources Ltd | $0.074 | +15.63% |
| RXL | ROX Resources Ltd | $0.28 | +14.29% |
| KAI | Kairos Minerals Ltd | $0.021 | +10.53% |
52 Week Lows
Code | Company | Last | % Chg |
|---|---|---|---|
| STP | Step One Clothing Ltd | $1.015 | -28.77% |
| MIN | Mineral Resources Ltd | $24.18 | -20.72% |
| AU1 | The Agency Group Australia Ltd | $0.018 | -18.18% |
| EV1 | Evolution Energy Minerals Ltd | $0.014 | -17.65% |
| SRJ | SRJ Technologies Group Plc | $0.028 | -15.15% |
Near Highs
Code | Company | Last | % Chg |
|---|---|---|---|
| PCI | Perpetual Credit Income Trust | $1.18 | -0.42% |
| WVOL | Ishares MSCI World Ex Aust Minimum Volatility ETF | $43.45 | 0.00% |
| IAGPF | Insurance Australia Group Ltd | $104.14 | +0.23% |
| CTD | Corporate Travel Management Ltd | $16.54 | +10.27% |
| VVLU | Vanguard Global Value Equity Active ETF | $75.90 | +0.52% |
Relative Strength Index (RSI) Oversold
Code | Company | Last | % Chg |
|---|---|---|---|
| WDS | Woodside Energy Group Ltd | $23.03 | -1.96% |
| VFY | Vitrafy Life Sciences Ltd | $1.40 | -2.10% |
| AMP | AMP Ltd | $1.41 | 0.00% |
| NSC | Naos Small Cap Opportunities Company Ltd | $0.30 | -4.76% |
| SUNDD | Suncorp Group Ltd | $19.18 | +1.21% |
