News | Market Wraps
Evening Wrap: ASX 200 tips new record as falling market yields trigger broad gains, AMP and Cochlear tumble on earnings
The S&P/ASX 200 closed 15.8 points higher, up 0.19%.

Mentioned
The S&P/ASX 200 closed 15.8 points higher, up 0.19%.
Any day the ASX 200 closes at a new record high is a good day for Aussie investors! 🥳
This time it was lower benchmark risk-free yields, spurred by a positive response to Thursday's US inflation data, that bolstered most stocks on the Aussie market. I say most, because gainers beat decliners by nearly 3 to 1 in the ASX 300.
Technology, Telco, Consumer, Utilities, and Property stocks were the best, with a couple of earnings clangers from AMP and Cochlear (COH) weighing on the Financials and Healthcare sectors respectively. Energy stocks were really the only area of the market to suffer really nasty losses, though.
Click/scroll through for the usual reporting of the major sector and stock-specific moves, the broker responses to them, as well as all the key upcoming economic data in tonight's Evening Wrap.
Also, I have detailed technical analysis on the NASDAQ, ASX 200, and Copper in today's ChartWatch.
Let's dive in!
Today in Review
Fri 14 Feb 25, 5:09pm (AEST)
Name | Value | % Chg |
|---|---|---|
Major Indices | ||
| ASX 200 | 8,555.8 | +0.19% |
| All Ords | 8,825.1 | +0.24% |
| Small Ords | 3,235.1 | +1.00% |
| All Tech | 4,107.6 | +0.90% |
| Emerging Companies | 2,397.7 | +0.43% |
Currency | ||
| AUD/USD | 0.6319 | +0.02% |
US Futures | ||
| S&P 500 | 6,139.5 | +0.07% |
| Dow Jones | 44,840.0 | +0.06% |
| Nasdaq | 22,119.75 | +0.03% |
Name | Value | % Chg |
|---|---|---|
Sector | ||
| Consumer Staples | 11,983.5 | +1.91% |
| Information Technology | 2,890.3 | +1.05% |
| Consumer Discretionary | 4,253.5 | +0.74% |
| Utilities | 8,586.0 | +0.72% |
| Communication Services | 1,673.3 | +0.70% |
| Real Estate | 3,935.3 | +0.57% |
| Industrials | 8,048.0 | +0.41% |
| Materials | 17,198.0 | +0.25% |
| Financials | 9,213.0 | -0.23% |
| Health Care | 43,123.7 | -0.23% |
| Energy | 8,644.3 | -0.72% |
Markets

ASX 200 Session Chart
The S&P/ASX 200 (XJO) finished 15.8 points higher at 8,555.8, 0.69% from its session high and just 0.19% from its low. In the broader-based S&P/ASX 300 (XKO), advancers beat decliners by a resounding 208 to 77.
For the week, the XJO finished up 44.4 points or 0.52% higher, 1.31% from its intraweek low and 0.69% from its intraweek high.
If you’re new to Evening Wrap, you might not have heard me say this. Alternatively, if you are a long-suffering reader, you’ve heard me say it many times. I bet it’s something you’ve even begun to monitor quite closely yourself.
Bond yields represent risk-free market yields. Risk-free market yields set the price of money. The price of money sets the prices of all risky assets.
Including stocks. Yes, stocks are viewed by the professional investing community as risky assets. I know – you thought stocks were safe…well blue-chip stocks…and generally in the long run…right? 🤔
Wrong! 🚫 Stocks are always risky!
So, when risk-free yields rise – the returns of risky stocks (and other risk-assets) look less attractive. Fund managers will offload stocks in favour of better risk-adjusted returns in risk-free bonds.
The opposite is also true. Lower risk-free yields make the returns of risky stocks look more attractive. It means that fund managers can bid up the prices of stocks.
Exhibit A: US 10-year Treasury Bond (“T-bond”) yield. Big black candle – reversing the prior 5 days of increases.

Exhibit A: US 10-year Treasury Bond (“T-bond”) yield chart (click here for full size image)
Exhibit B is in tonight’s ChartWatch, a big white candle on the NASDAQ Composite index. Yields down, stock prices up – it’s a relationship that’s been around since the dawn of…well stocks and bonds!
Pivoting to our little corner of the global risk-assets spectrum. The impact of lower risk-free market yields (our own benchmark 10-Year Government bond yield fell 0.13% overnight) was far less impactful on ASX stocks.
But it is Friday. And we don’t expect much from the ASX on a Friday. ☹️
So, we’re not completely disappointed with our measly 0.19% gain – are we? It's a new record-high close after all! 🥳
I will discuss in greater detail the implications of today's long upward pointing XJO candle shadow, but for now I note that despite the pullback from this morning’s high, the breadth remained very good throughout the day. This is a potentially positive indicator of the general breadth of demand for Aussie stocks.
Turning to today’s moves…you will no doubt read in other evening wraps about "this stock announced this" and "that stock announced that"…I prefer to deal in how the big money moved on any one day.
And as I have set this up, today's ASX moves were all about big money moves – and big money moves with respect to changes in risk-free money pricing.
So, it is no surprise that the best performing sectors of the market were the most interest rate sensitive. -0.13% in the benchmark risk-free yield doesn't sound like much – but don’t forget that the RBA deals in 0.25% moves – so that’s better than a half-typical rate cut overnight.
Gold doesn't have yield – it usually has a cost of carry – so it loves lower risk-free yields. This his probably why it also logged a new record high close overnight, and that helped the local Gold (XGD) sub-index (+1.5%) to a solid gain today.
High-PE / long duration (just means extra-extra risk-free yield sensitive!) Information Technology (XIJ) (+1.0%) and Communication Services (XTJ) (+0.70%) stocks also excelled today, as did mortgage-hampered Consumer Staples (XSJ) (+1.9%) and Consumer Discretionary (XDJ) (+0.74%). Bond-proxies Utilities (XUJ) (+0.72%) and Real Estate Investment Trusts (XPJ) (+0.54%) also didn't miss out.
That was the top of the leaderboard. The rest weren't terrible, with only Financials (XFJ) (-0.23%), Health Care (XHJ) (-0.23%), and Energy (XEJ) (-0.72%) logging losses. Ebb and flow mostly through those with AMP and Cochlear earnings hurting the XFJ and XHJ respectively.
Energy didn't really have an "it was earnings' fault" excuse today – but I suggest today's decline is simply par for the course there...📉 (You can read all about the this stock did this and that stock did that in the Interesting Moves section below 👇)
ChartWatch
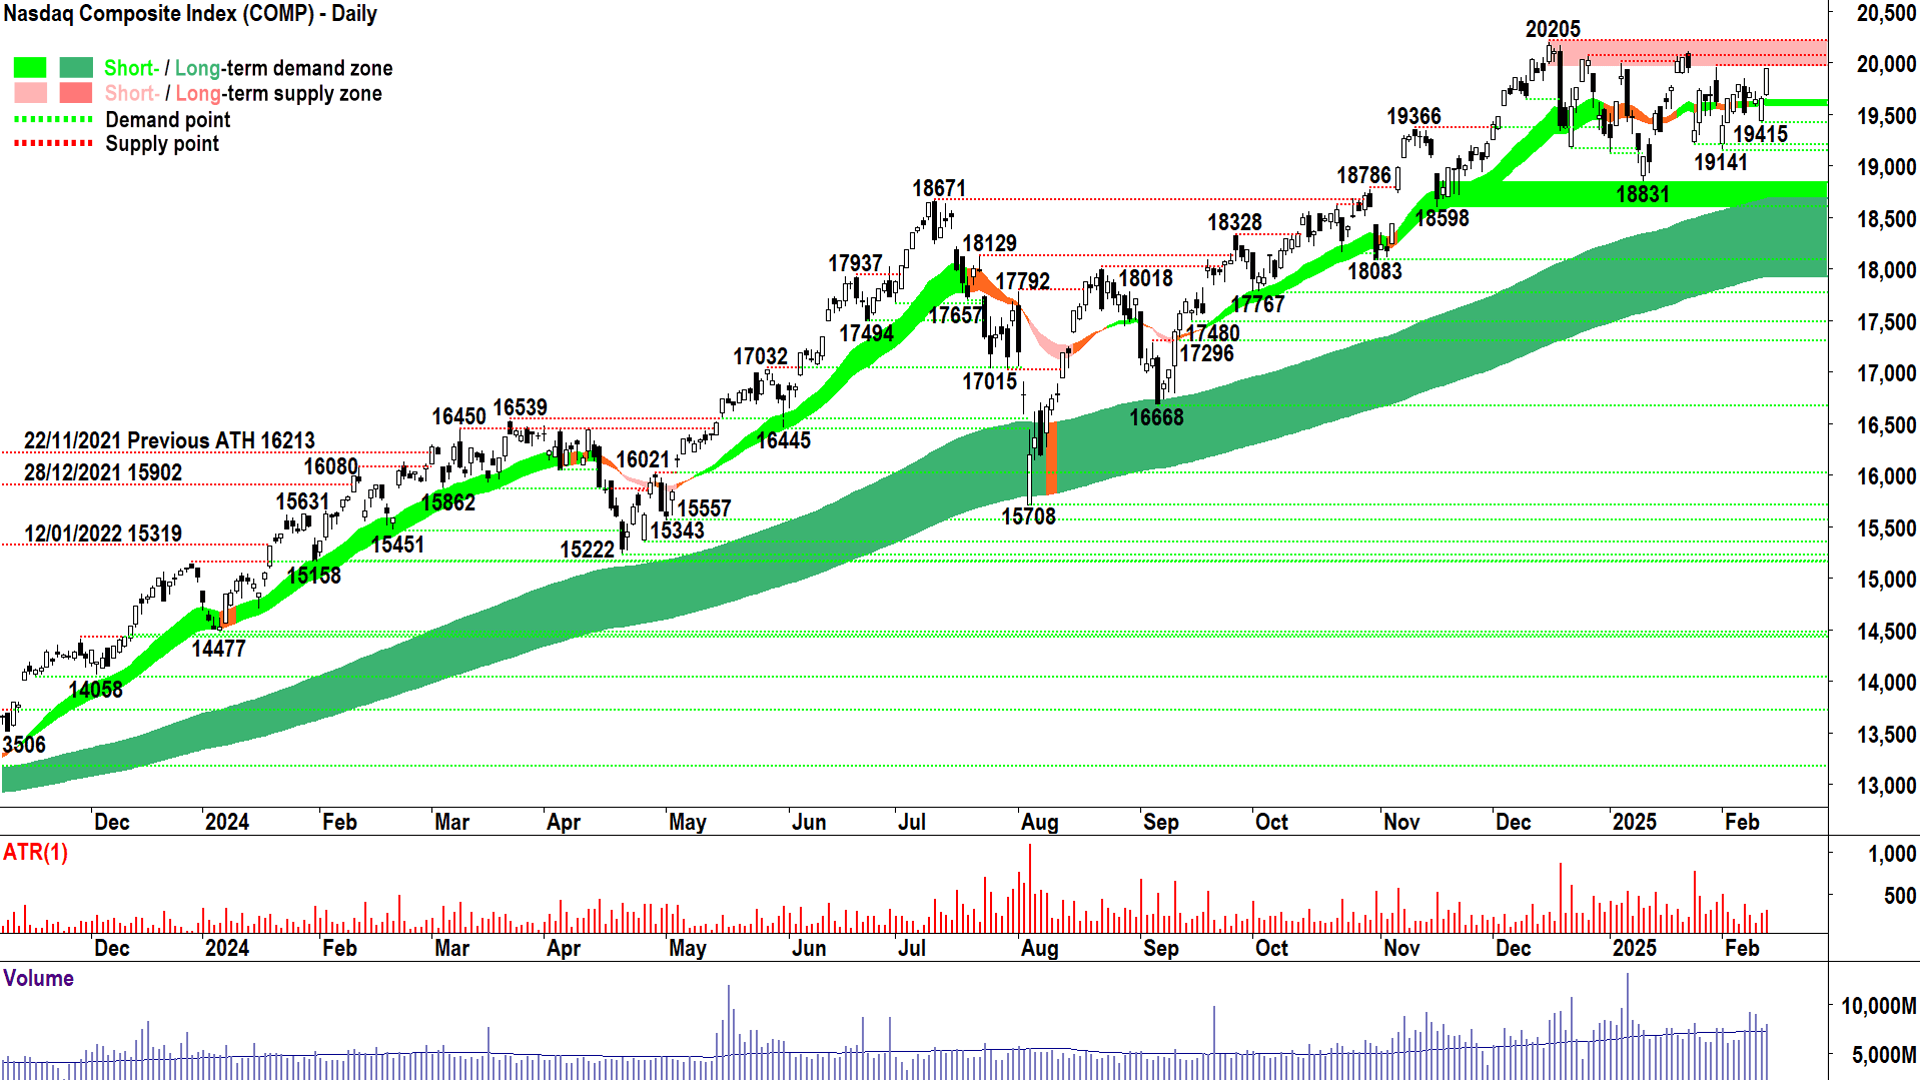
NASDAQ Composite Index

White candles indicate excess demand in the system (click here for full size image)
The last time we covered the Comp was in ChartWatch in the Evening Wrap on 10 February.
In that update, we were tracking a clear supply-side candle (i.e. a black body with low close and upward pointing shadow). We noted the Comp short term trend was largely sideways within a long term uptrend that remained “unequivocally demand-side in nature”.
That’s the important bit.
No bull market rises in a straight line. There are the inevitable phases of short term equilibrium (similar to the current environment), and even potential short term bouts of supply-side control. It’s a dance.
But, as long as that dark green ribbon is just that – dark green – and as long as the price continues to close above it, then in my experience the bull market is intact.
This implies that if the “NOT” of the above condition occurs, we’re in something of a "NOT bull market"!
So, NOT dark green ribbon = NOT bull market (let’s call it a long term demand-side market from here because that’s what a bull market really is!).
And NOT close above dark green ribbon = NOT a long term demand-side market.
Until either of the above occurs, my rules require me to simply trust the trend. This means hold any existing risk and or look for appropriate opportunities to add risk.
But here’s a little brain bender for you. You might think this mantra of trust the trend implies I have faith in its perpetuation.
This is not the case. I have exactly zero faith that any trend will continue. Extrapolate this out to any future outcome.
Just because I identify a really strong demand-side market – it doesn’t mean I have any faith it will continue.
This is because after a great deal of deliberation and over a great many years of watching markets – I eventually came to the conclusion that predicting or willing something to go in a particular direction is absolutely pointless.
I have conceded that I don’t control market prices. Absolutely no control. Zip, nada, bupkis.
So, I don’t stress about where the price might be going next when I make a call. Yes, trend following is how I make my calls – and I like to think you’d agree I get it right more often than not – but I never assume I’ll be right.
The market determines that bit, and the market reserves the right to do absolutely whatever it wants, when it wants. Including destroying the most beautiful set of technicals.
This is why I have a set of rules dictating how much I risk when I invest (I like to keep my risk per investment small, but have many small trend following positions), and I have strict rules dictating when I must exit. You know how I identify when a trend has changed – that’s when it’s time for me to get out.
And this brings us back to the Comp (we had to return at some point!). There is zero indication the long term uptrend in the Comp is under threat, and therefore I choose to continue to “unfaithfully” follow it.
The last few candles since our previous update suggest increasing short term demand-side control – the last two are of particularly credible proportions.
However, we are approaching a critical supply zone in the form of 19970-20205.
Thursday’s candle’s close suggests the demand-side isn’t too worried about it – yet. You see, supply-zones are only known on an ex-post basis. If we see supply-side candles there, and or the setting of a peak followed by a lower peak – then there is indeed supply in the zone!
If you don’t see these signals – then there’s a very strong chance the Comp is headed for new highs…📈
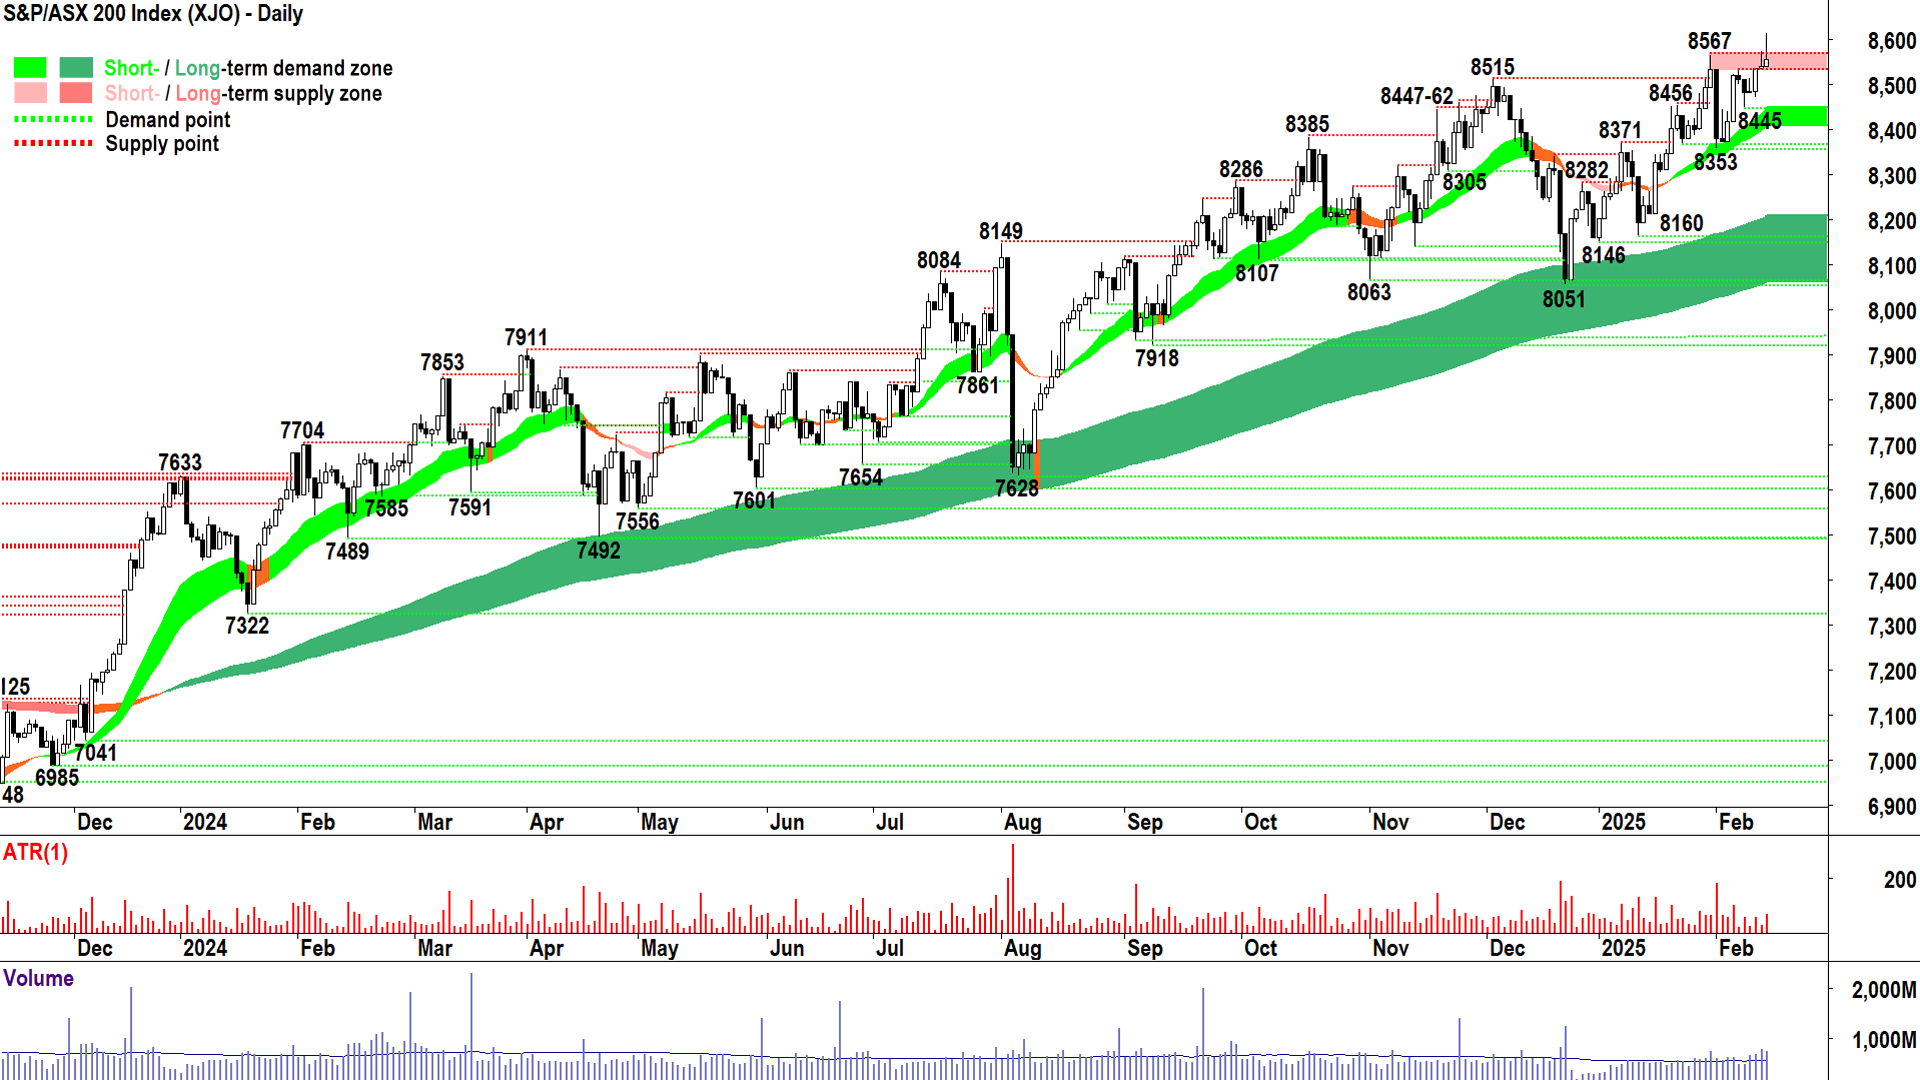
S&P/ASX 200 (XJO)
%20chart%2014%20February%202025.png)
(New) High anxiety... (click here for full size image)
The last time we covered the XJO was in ChartWatch in the Evening Wrap on 10 February.
In that update, I offered a similar “stay the course” theory with respect to our XJO. Indeed, this week’s price action has continued to imply that the demand-side remains firmly in control of ASX stock prices in both the short and long term.
Today’s candle isn’t great, though. That’s a decent upward pointing shadow – and one that was made into new highs, too.
It’s disappointing.
The demand-side clearly didn’t want to hang around after running a few short stops at the open and or the supply-side looked to take advantage of that early burst of demand rather than choose to hold through the weekend.
But it is Friday...and it is the ASX we’re talking about here. Hey – a new high on a fairly benign looking supply-side candle is still something I suspect most of us will happily take!
Such is the ebb and flow of a market that lacks anything that even resembles the firepower of a "Magnificent 7" (What’s our Mag-7 I ask…ANZ, CBA, NAB, WBC, BHP, RIO, and FMG? 🤔 See where I’m coming from!?)
On a day where the big banks were generally down (that’s nearly one-quarter of our market right there), it was always going to be a struggle.
Still, these are minor criticisms against what clearly remains a very strong set of long term demand-side credentials.
Moving forward, I propose key demand is at the short term uptrend ribbon, presently kicking in around 8408-8448. There’s also the 8445 point of demand lurking in and around there.
I’d prefer not to see a close below 8408-8448, but I suggest 8353 is shaping as the key short term demand point. If the XJO closes below that level, then I think we can be pretty sure the short term uptrend is over.
As always, you should remain attentive to black-bodied candles and or upward pointing shadows – we don’t want to see confirmation that today’s reversal is something more sinister than just Friday dispersal – and lower peaks would be another signal the supply-side is gaining the upper hand.
High Grade Copper Futures (Front month, back-adjusted) COMEX
%20COMEX%20chart%2014%20February%202025.png)
Copper renaissance continues (click here for full size image)
The last time we covered high grade copper was in ChartWatch in the Evening Wrap on 6 February.
In that update, I bet I was going to be disappointed by “taking the bait” and turning bullish again on copper.
I am glad to report that my copper analysis is so far disappointment-free! 😁
The copper price has logged several strong demand-side candles since that last update, confirming the consumption of supply at 4.47, then 4.5625-4.5685, and is now even threatening to probe the next critical supply zone at 4.831-4.8595.
The price action is back to strong trough-peak moves versus shallow peak-trough moves – a great indicator of strong demand-side control – as too are recent long white-bodied candles. Add in the fact that the long term trend ribbon has swung higher, and we're now short and long term demand-side control here.
So, there doesn’t appear to be anything in the technicals that suggests 4.831-4.8595 can’t also be consumed by the demand-side – in due course. A bit of a breather here, to consolidate demand-side control and further convince the supply side there's no desperate need to take profits into this move, would be a good thing.
I'll be watching the candles extra closely from here. We must see the candles in and around the 4.831-4.8595 zone before we can understand just how impactful – if at all – any latent supply lurking in this area will be.
Until then, demand is at 4.5625-4.5685 (it is the old supply zone). As if to prove 4.5625-4.5685’s credentials as a zone of demand, note how the 11-Feb trough occurred there.
The short term uptrend ribbon will likely catch up to 4.5625-4.5685 by the time any potential pullback eventuates, and potentially act as a further zone of dynamic demand supporting the short term uptrend.
Economy
Today
There weren't any major data releases in our time zone today (+0% actual vs +% forecast vs +% previous)
Later this week
Saturday
00:30 USA Core Retail Sales January (+0.3% m/m forecast vs +0.4% m/m in December)
Latest News
Interesting Movers
Trading higher
+11.8% Temple & Webster Group (TPW) - Continued positive response to 13-Feb Half Year Results & Trading Update, generally well received by the brokers with several large target target increases (see Broker Moves for more details), rise is consistent with prevailing short and long term uptrends, a regular in ChartWatch ASX Scans Uptrends list 🔎📈
+11.2% Avita Medical (AVH) - AVITA Medical Reports Q4 and FY2024 Financial Results and AVITA Medical Q4 & FY 2024 Earnings Presentation.
+10.3% Imugene (IMU) - Azer-cel demonstrates two additional Complete Responses.
+7.3% DUG Technology (DUG) - No news 🤔.
+7.2% Sigma Healthcare (SIG) - Confirmation of Sigma's future financial reporting, rise is consistent with prevailing short and long term uptrends, a regular in ChartWatch ASX Scans Uptrends list 🔎📈
+7.1% Echoiq (EIQ) - No news since 12-Feb $1.26M R&D Tax Incentive Received, rise is consistent with prevailing short and long term uptrends, a regular in ChartWatch ASX Scans Uptrends list 🔎📈
+6.7% Aurelia Metals (AMI) - No news, general strength across the broader Gold-Copper sector today, rise is consistent with prevailing short and long term uptrends, a regular in ChartWatch ASX Scans Uptrends list 🔎📈
+6.5% Healius (HLS) - No news 🤔.
+6.4% AIC Mines (A1M) - No news, general strength across the broader Gold-Copper sector today, rise is consistent with prevailing short and long term uptrends, a recent regular in ChartWatch ASX Scans Uptrends list 🔎📈
+6.2% Domain Australia (DHG) - Continued positive response to 13-Feb Domain HY25 Results Announcement, generally well received by the brokers with several target price increases (see Broker Moves for more details).
+6.0% Digitalx (DCC) - No news, general strength across the broader Information Technology sector today, rise is consistent with prevailing short and long term uptrends, added to ChartWatch ASX Scans Uptrends list yesterday 🔎📈
+5.5% Mirvac Group (MGR) - MGR 1H25 Interim Report, MGR 1H25 Results Presentation, and MGR 1H25 Property Compendium.
+5.4% Bellevue Gold (BGL) - No news, general strength across the broader Gold sector today.
+5.3% Ora Banda Mining (OBM) - No news since 13-Feb Riverina Exploration Update, general strength across the broader Gold sector today, rise is consistent with prevailing short and long term uptrends, a regular in ChartWatch ASX Scans Uptrends list 🔎📈
+4.3% Horizon Minerals (HRZ) - No news since 12-Feb Phillips Find - Processing of First Ore, general strength across the broader Gold sector today, rise is consistent with prevailing short and long term uptrends, a recent regular in ChartWatch ASX Scans Uptrends list 🔎📈
Trading lower
-14.9% AMP (AMP) - Appendix 4E & 2024 Annual Report and AMP FY24 Investor Presentation.
-13.7% Cochlear (COH) - Appendix 4D and Half Year Financial Report and HY25 Result - Presentation.
-13.1% Civmec (CVL) - Appendix 4D - Half Year Report 2025 and 1H FY25 Investor Presentation.
-9.1% Clarity Pharmaceuticals (CU6) - No news, fall is consistent with prevailing short and long term downtrends, a regular in ChartWatch ASX Scans Downtrends list 🔎📉
-4.9% Mineral Resources (MIN) - Ceasing to be a substantial holder (JP Morgan) and Ceasing to be a substantial holder (UBS), fall is consistent with prevailing short and long term downtrends, a regular in ChartWatch ASX Scans Downtrends list 🔎📉
-4.9% Lotus Resources (LOT) - No news, fall is consistent with prevailing short and long term downtrends, a regular in ChartWatch ASX Scans Downtrends list 🔎📉
-4.0% The Star Entertainment Group (SGR) - No news, fall is consistent with prevailing short and long term downtrends, a regular in ChartWatch ASX Scans Downtrends list 🔎📉
Broker Moves
AGL Energy (AGL)
Downgraded to hold from accumulate at Ord Minnett; Price Target: $11.00 from $11.20
Ampol (ALD)
Retained at neutral at Macquarie; Price Target: $30.65 from $31.00
Aristocrat Leisure (ALL)
Retained at overweight at Morgan Stanley; Price Target: $68.20
AMP (AMP)
Retained at sell at UBS; Price Target: $1.250
APA Group (APA)
Retained at equal-weight at Morgan Stanley; Price Target: $8.08
Alliance Aviation Services (AQZ)
Retained at add at Morgans; Price Target: $4.10
Arena Reit. (ARF)
Retained at accumulate at Ord Minnett; Price Target: $4.30 from $4.35
ASX (ASX)
Retained at neutral at Citi; Price Target: $68.50 from $66.70
Retained at hold at CLSA; Price Target: $65.20 from $61.90
Retained at sell at Goldman Sachs; Price Target: $61.00 from $59.50
Retained at hold at Jefferies; Price Target: $70.00 from $64.00
Retained at neutral at Macquarie; Price Target: $66.50 from $66.00
Retained at underweight at Morgan Stanley; Price Target: $56.15 from $55.05
Retained at hold at Morgans; Price Target: $67.20 from $66.35
Retained at sell at UBS; Price Target: $66.00 from $65.00
Bravura Solutions (BVS)
Retained at buy at Shaw and Partners; Price Target: $2.90 from $1.70
Commonwealth Bank of Australia (CBA)
Retained at sell at Citi; Price Target: $90.75 from $91.50
Cochlear (COH)
Retained at sell at UBS; Price Target: $270.00
Computershare (CPU)
Retained at equal-weight at Morgan Stanley; Price Target: $36.60 from $31.10
Charter Hall Retail Reit (CQR)
Retained at neutral at UBS; Price Target: $3.79
CSL (CSL)
Retained at buy at Shaw and Partners; Price Target: $1.700
Domain Australia (DHG)
Upgraded to buy from hold at Bell Potter; Price Target: $3.30 from $3.20
Retained at neutral at Citi; Price Target: $3.20
Retained at neutral at E&P; Price Target: $3.00
Retained at neutral at Goldman Sachs; Price Target: $3.00 from $2.90
Downgraded to overweight from buy at Jarden; Price Target: $3.30 from $3.25
Retained at neutral at Macquarie; Price Target: $3.00 from $2.85
Retained at underweight at Morgan Stanley; Price Target: $2.50
Retained at neutral at UBS; Price Target: $3.20 from $3.10
Downer EDI (DOW)
Retained at neutral at Macquarie; Price Target: $5.73 from $5.85
Deterra Royalties (DRR)
Retained at outperform at Macquarie; Price Target: $4.40
Dexus Industria Reit. (DXI)
Retained at hold at Bell Potter; Price Target: $2.90
Evolution Mining (EVN)
Retained at buy at Bell Potter; Price Target: $7.00 from $6.65
Firefly Metals (FFM)
Initiated at buy at BMO Capital Markets; Price Target: $1.750
Fisher & Paykel Healthcare Corporation (FPH)
Upgraded to overweight from market-weight at Wilsons; Price Target: $35.00 from $34.93
Graincorp (GNC)
Retained at hold at Bell Potter; Price Target: $7.54 from $9.25
Upgraded to buy from hold at Jefferies; Price Target: $9.00 from $9.30
Retained at outperform at Macquarie; Price Target: $8.76 from $9.85
Retained at buy at Ord Minnett; Price Target: $9.50 from $9.80
GQG Partners (GQG)
Retained at neutral at UBS; Price Target: $2.43
Homeco Daily Needs Reit (HDN)
Retained at hold at Bell Potter; Price Target: $1.350 from $1.400
Retained at neutral at Macquarie; Price Target: $1.140 from $1.110
Retained at equal-weight at Morgan Stanley; Price Target: $1.340
Retained at hold at Ord Minnett; Price Target: $1.300 from $1.270
Helia Group (HLI)
Retained at neutral at Goldman Sachs; Price Target: $4.52 from $4.29
Insurance Australia Group (IAG)
Retained at buy at Citi; Price Target: $9.05 from $9.65
Retained at neutral at Goldman Sachs; Price Target: $8.15 from $8.30
Retained at overweight at Jarden; Price Target: $8.00 from $8.40
Retained at buy at Jefferies; Price Target: $9.10 from $9.95
Retained at outperform at Macquarie; Price Target: $8.50 from $8.70
Retained at equal-weight at Morgan Stanley; Price Target: $8.05 from $8.35
Retained at hold at Morgans; Price Target: $8.02 from $8.65
Retained at accumulate at Ord Minnett; Price Target: $9.15 from $9.65
Retained at neutral at UBS; Price Target: $8.60 from $9.15
Infomedia (IFM)
Retained at positive at E&P; Price Target: $1.950
Iluka Resources (ILU)
Retained at outperform at Macquarie; Price Target: $6.80
Mirvac Group (MGR)
Retained at neutral at UBS; Price Target: $2.29
Mineral Resources (MIN)
Retained at neutral at Macquarie; Price Target: $36.00
Monadelphous Group (MND)
Retained at hold at Morgans; Price Target: $14.80 from $14.28
Newmont Corporation (NEM)
Upgraded to hold from underperform at CLSA; Price Target: $66.55 from $57.40
Northern Star Resources (NST)
Retained at buy at Canaccord Genuity; Price Target: $22.85
Retained at neutral at Citi; Price Target: $17.90
Upgraded to outperform from hold at CLSA; Price Target: $19.50 from $17.85
Retained at buy at Goldman Sachs; Price Target: $19.40 from $19.80
Retained at neutral at Jarden; Price Target: $15.40
Retained at hold at Ord Minnett; Price Target: $16.80
Retained at sector perform at RBC Capital Markets; Price Target: $20.00
Ora Banda Mining (OBM)
Retained at buy at Canaccord Genuity; Price Target: $1.050 from $0.850
Orora (ORA)
Retained at neutral at Citi; Price Target: $2.40 from $2.80
Downgraded to hold from buy at Jefferies; Price Target: $2.10 from $3.00
Retained at outperform at Macquarie; Price Target: $2.50 from $2.84
Retained at overweight at Morgan Stanley; Price Target: $2.70
Retained at hold at Morgans; Price Target: $2.15 from $2.60
Origin Energy (ORG)
Retained at buy at Citi; Price Target: $11.50
Upgraded to neutral from underweight at Jarden; Price Target: $10.25 from $10.45
Retained at neutral at Macquarie; Price Target: $9.94 from $9.83
Retained at underweight at Morgan Stanley; Price Target: $8.88
Retained at buy at Ord Minnett; Price Target: $11.00 from $11.10
Pro Medicus (PME)
Upgraded at buy at Bell Potter; Price Target: $330.00 from $260.00
Retained at sell at Citi; Price Target: $165.00 from $150.00
Retained at outperform at CLSA; Price Target: $308.00 from $310.00
Retained at buy at Goldman Sachs; Price Target: $309.00 from $310.00
Retained at neutral at JP Morgan; Price Target: $282.00 from $130.00
Retained at neutral at Macquarie; Price Target: $258.50
Retained at overweight at Morgan Stanley; Price Target: $310.00
Retained at hold at Morgans; Price Target: $250.00 from $225.00
Retained at sector perform at RBC Capital Markets; Price Target: $295.00
Downgraded to market-weight from overweight at Wilsons; Price Target: $297.00 from $275.00
Rio Tinto (RIO)
Retained at buy at Goldman Sachs; Price Target: $146.20
South32 (S32)
Retained at sell at Canaccord Genuity; Price Target: $2.50
Upgraded to buy from neutral at Citi; Price Target: $4.00 from $3.90
Retained at buy at Goldman Sachs; Price Target: $4.00
Retained at hold at Jefferies; Price Target: $3.40
Retained at outperform at Macquarie; Price Target: $4.40
Retained at overweight at Morgan Stanley; Price Target: $3.90
Retained at add at Ord Minnett; Price Target: $4.30
Retained at outperform at RBC Capital Markets; Price Target: $4.20
Retained at buy at UBS; Price Target: $4.00
SGH (SGH)
Retained at buy at Goldman Sachs; Price Target: $59.30 from $45.90
Sigma Healthcare (SIG)
Retained at add at Ord Minnett; Price Target: $3.00 from $2.98
Suncorp Group (SUN)
Retained at hold at Jefferies; Price Target: $21.00 from $20.90
Retained at overweight at JP Morgan; Price Target: $21.70 from $21.00
Syrah Resources (SYR)
Downgraded to neutral from buy at UBS; Price Target: $0.300 from $0.800
Temple & Webster Group (TPW)
Retained at hold at Bell Potter; Price Target: $15.60 from $12.20
Retained at buy at Citi; Price Target: $13.50
Retained at buy at Jarden; Price Target: $18.65 from $14.01
Retained at outperform at Macquarie; Price Target: $17.60 from $13.55
Retained at overweight at Morgan Stanley; Price Target: $18.50 from $13.15
Retained at outperform at RBC Capital Markets; Price Target: $19.00 from $16.00
Retained at neutral at UBS; Price Target: $11.80
Treasury Wine Estates (TWE)
Retained at buy at Citi; Price Target: $12.97
Retained at outperform at CLSA; Price Target: $15.50 from $16.00
Retained at buy at Goldman Sachs; Price Target: $12.90 from $13.00
Retained at buy at Jarden; Price Target: $13.90 from $14.70
Retained at overweight at JP Morgan; Price Target: $13.40 from $14.00
Retained at outperform at Macquarie; Price Target: $11.70 from $12.60
Retained at overweight at Morgan Stanley; Price Target: $14.60
Retained at add at Ord Minnett; Price Target: $13.43 from $14.80
Viva Energy Group (VEA)
Retained at outperform at Macquarie; Price Target: $3.40 from $3.60
Scans
Top Gainers
Code | Company | Last | % Chg |
|---|---|---|---|
| SCN | Scorpion Minerals Ltd | $0.027 | +80.00% |
| FRS | Forrestania Resources Ltd | $0.026 | +73.33% |
| MRZ | Mont Royal Resources Ltd | $0.041 | +28.13% |
| KFM | Kingfisher Mining Ltd | $0.053 | +26.19% |
| LSA | Lachlan Star Ltd | $0.075 | +25.00% |
Top Fallers
Code | Company | Last | % Chg |
|---|---|---|---|
| PFT | Pure Foods Tasmania Ltd | $0.015 | -28.57% |
| BPM | BPM Minerals Ltd | $0.057 | -20.83% |
| WNX | Wellnex Life Ltd | $0.64 | -20.00% |
| MML | Mclaren Minerals Ltd | $0.03 | -18.92% |
| OVT | Ovanti Ltd | $0.015 | -16.67% |
52 Week Highs
Code | Company | Last | % Chg |
|---|---|---|---|
| FXG | FELIX Gold Ltd | $0.18 | +16.13% |
| ASV | Asset Vision Co Ltd | $0.032 | +14.29% |
| TPW | Temple & Webster Group Ltd | $18.04 | +11.77% |
| SM1 | Synlait Milk Ltd | $0.74 | +10.45% |
| MRL | Mayur Resources Ltd | $0.38 | +8.57% |
52 Week Lows
Code | Company | Last | % Chg |
|---|---|---|---|
| COH | Cochlear Ltd | $262.73 | -13.73% |
| PRO | Prophecy International Holdings Ltd | $0.455 | -13.33% |
| LIT | Livium Ltd | $0.012 | -11.11% |
| EXR | Elixir Energy Ltd | $0.034 | -10.53% |
| AVG | Australian Vintage Ltd | $0.11 | -8.33% |
Near Highs
Code | Company | Last | % Chg |
|---|---|---|---|
| SMLL | Betashares Australian Small Companies Select ETF | $3.73 | +1.36% |
| EMC | Everest Metals Corporation Ltd | $0.165 | +3.13% |
| OZBD | Betashares Australian Composite Bond ETF | $44.34 | +0.48% |
| PCI | Perpetual Credit Income Trust | $1.18 | +0.43% |
| WVOL | Ishares MSCI World Ex Aust Minimum Volatility ETF | $43.81 | +0.37% |
Relative Strength Index (RSI) Oversold
Code | Company | Last | % Chg |
|---|---|---|---|
| VUL | Vulcan Energy Resources Ltd | $4.03 | -0.74% |
| VFY | Vitrafy Life Sciences Ltd | $1.445 | +1.05% |
| RFG | Retail Food Group Ltd | $1.84 | -3.67% |
| COH | Cochlear Ltd | $262.73 | -13.73% |
| PXA | Pexa Group Ltd | $11.87 | -0.17% |
