News | Market Wraps
Evening Wrap: ASX 200 dips on renewed Trump tariff uncertainty - PM to plead our case as Tech, Telco, Mining and Energy stocks fall
The S&P/ASX 200 closed 28.6 points lower, down 0.34%.

Mentioned
The S&P/ASX 200 closed 28.6 points lower, down 0.34%.
Yet more Trump tariff stuff for ASX investors to digest and integrate into risk-pricing today. 25% tariffs on steel and aluminum – but will Australia be included? That's yet to be determined, and the PM will be on the blower to the Don tonight to plead our case!
Tech, Telco, Consumer, and Mining and Energy stocks were hardest hit due to a combination of stock-specific news items (generally earnings related), and a pop in benchmark risk-free market yields in the US on Friday.
But it wasn't all doom and gloom on the ASX, sectors that are generally considered "defensives" still managed modest gains.
Click/scroll through for the usual reporting of the major sector and stock-specific moves, the broker responses to them, as well as all the key upcoming economic data in tonight's Evening Wrap.
Also, I have detailed technical analysis on the NASDAQ Composite, the S&P/ASX 200 (XJO) and Gold in today's ChartWatch.
Let's dive in!
Today in Review
Mon 10 Feb 25, 4:58pm (AEST)
Name | Value | % Chg |
|---|---|---|
Major Indices | ||
| ASX 200 | 8,482.8 | -0.34% |
| All Ords | 8,747.6 | -0.37% |
| Small Ords | 3,213.3 | -0.49% |
| All Tech | 3,992.9 | -1.03% |
| Emerging Companies | 2,367.6 | +0.32% |
Currency | ||
| AUD/USD | 0.6266 | -0.12% |
US Futures | ||
| S&P 500 | 6,068.25 | +0.31% |
| Dow Jones | 44,492.0 | +0.16% |
| Nasdaq | 21,718.5 | +0.59% |
Name | Value | % Chg |
|---|---|---|
Sector | ||
| Consumer Staples | 11,756.8 | +0.48% |
| Utilities | 8,667.8 | +0.45% |
| Health Care | 44,942.5 | +0.31% |
| Real Estate | 3,911.9 | -0.17% |
| Financials | 9,114.4 | -0.22% |
| Energy | 8,716.6 | -0.31% |
| Consumer Discretionary | 4,138.4 | -0.39% |
| Industrials | 7,778.7 | -0.51% |
| Materials | 16,941.0 | -0.71% |
| Communication Services | 1,657.9 | -1.13% |
| Information Technology | 2,871.4 | -1.38% |
Markets

ASX 200 Session Chart
The S&P/ASX 200 (XJO) finished 28.6 points lower at 8,482.8, roughly mid-range, 0.44% from its session low and 0.34% from its high. In the broader-based S&P/ASX 300 (XKO), advancers lagged decliners by a modest 107 to 166.
More Trump tariff stuff for markets to digest and integrate into risk-pricing today. No doubt you've already read about the 25% tariffs on steel and aluminum imports into the US that President Trump disclosed (off the cuff) to reporters early this morning our time. The official announcement, and we can only assume – finer details – are due to be released tonight our time.
In theory, they will impact "everybody", so that includes us. Our PM assured the House of Representatives today that he has an "urgent discussion scheduled" with the Don to plead Australia's case to be exempted from the latest batch of tariffs.
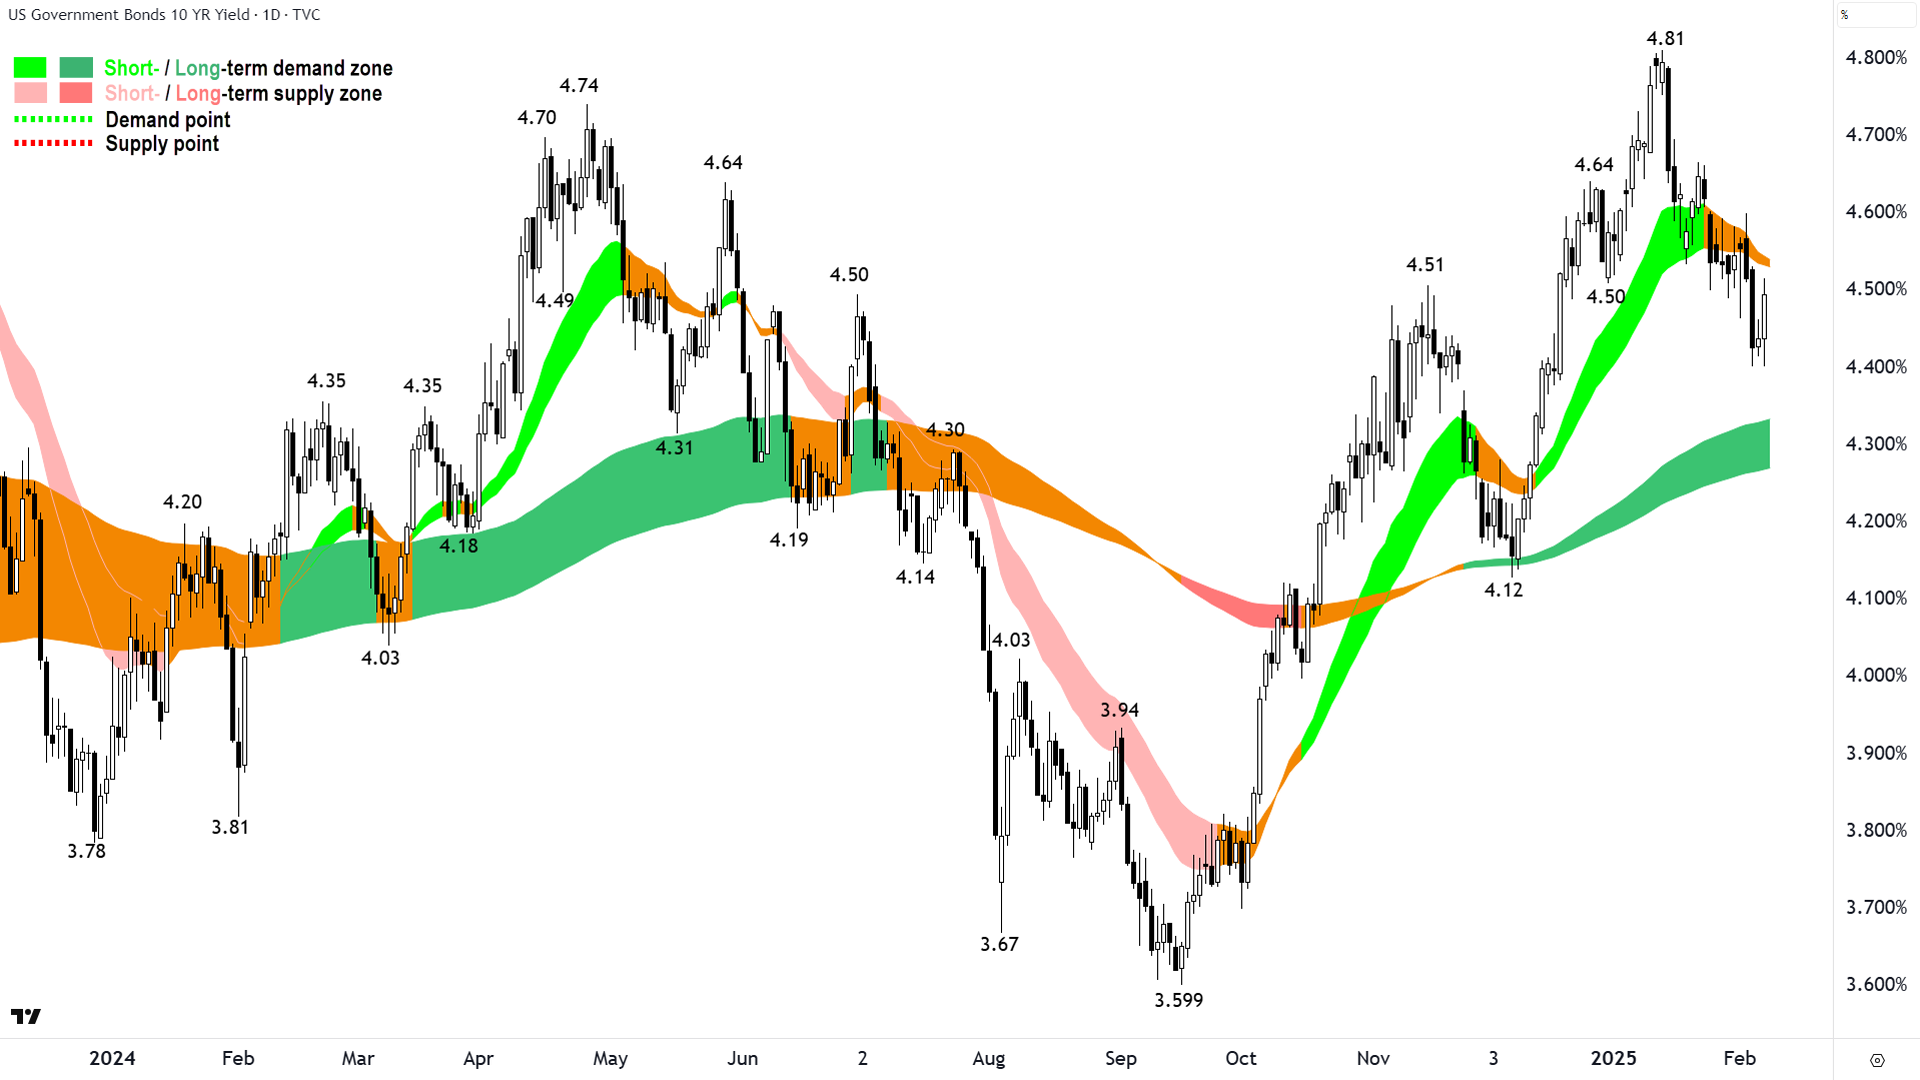
Add in the fact that US long term risk-free market yields popped back up to 4.5% from the week's low of 4.4% on Friday (and are hovering there or thereabouts in futures trade today) – and you can see why we had a generally lousy day's trade on the ASX today.

US 10 Year T-Bond Yield (click here for full size image)
On those risk free yields, there a couple of disturbing data points worth noting. Markets were initially spooked by the Non-farm Payroll data for January showing that average hourly earnings ("AHE") popped 0.5% month on month ("m/m"), ahead of consensus for a 0.3% m/m increase. On an annualised basis, AHE increased by 4.1% p.a., ahead of +3.8% p.a. consensus.
That's a much hotter than expected leading inflation print (but to be fair – also hot for growth/earnings). Add in a big jump in year-ahead inflation expectations shown up in the University of Michigan consumer sentiment data (to 4.3% p.a. from the prior 3.3% p.a.), you can see why the bond market sold off (remember: higher bond yields equals lower bond prices).
While we're on the topic of the U-Mich consumer sentiment data, it's also worth pointing out that consumer sentiment unexpectedly tanked to 67.8 – well below consensus for 72.0 – and down from January's 71.1. This is the second straight decline in consumer sentiment and the lowest reading since July last year.
Now you can see why the stock market also sold off. All things considered – our 28.6 point / 0.36% decline wasn't terrible. Most of the damage today was limited to the interest rate sensitives, and even then, losses were moderate.
High PE/long duration Information Technology (XIJ) (-1.4%) and Communication Services (XTJ) (-1.1%) were hardest hit – but there were several stock specific moves in each (see Interesting Moves for more details).
Growth-dependent Resources (XJR) (-0.63%) and Energy (XEJ) (-0.31%) pulled back despite generally strong base metals, iron ore, and crude oil prices on Friday.
Consumer debt-dependent Consumer Discretionary (XDJ) (-0.39%) rounded out the list of worst performing sectors.
Company | Last Price | Change $ | Change % | 1mo % | 1yr % |
|---|---|---|---|---|---|
WA1 Resources (WA1) | $14.70 | -$1.6 | -9.8% | +9.4% | +48.8% |
Car Group (CAR) | $38.36 | -$2.67 | -6.5% | +1.1% | +14.7% |
JB HI-FI (JBH) | $97.78 | -$4.67 | -4.6% | +1.4% | +76.0% |
Wisetech Global (WTC) | $124.20 | -$5.7 | -4.4% | -1.3% | +68.4% |
Bisalloy Steel Group (BIS) | $3.60 | -$0.16 | -4.3% | +1.4% | +35.3% |
Codan (CDA) | $16.31 | -$0.67 | -3.9% | +3.0% | +100.6% |
Nick Scali (NCK) | $17.34 | -$0.66 | -3.7% | +14.5% | +23.9% |
Iperionx (IPX) | $4.18 | -$0.14 | -3.2% | -19.6% | +134.8% |
Tuas (TUA) | $6.57 | -$0.21 | -3.1% | +5.3% | +109.9% |
Catapult Group International (CAT) | $3.88 | -$0.11 | -2.8% | +7.2% | +198.5% |
McMillan Shakespeare (MMS) | $13.43 | -$0.38 | -2.8% | -13.4% | -24.2% |
Accent Group (AX1) | $2.09 | -$0.05 | -2.3% | -12.6% | -0.9% |
Myer (MYR) | $0.850 | -$0.02 | -2.3% | -24.8% | +17.1% |
Reece (REH) | $22.70 | -$0.53 | -2.3% | -0.7% | +1.8% |
Ora Banda Mining (OBM) | $0.870 | -$0.02 | -2.2% | +21.7% | +286.7% |
Lovisa (LOV) | $28.05 | -$0.64 | -2.2% | +4.9% | +18.7% |
Bravura Solutions (BVS) | $2.22 | -$0.05 | -2.2% | +4.9% | +168.7% |
Spartan Resources (SPR) | $1.390 | -$0.03 | -2.1% | -13.9% | +197.7% |
Temple & Webster Group (TPW) | $14.43 | -$0.31 | -2.1% | +1.7% | +48.0% |
Eagers Automotive (APE) | $13.10 | -$0.26 | -1.9% | +6.5% | -6.5% |
Deep Yellow (DYL) | $1.265 | -$0.025 | -1.9% | +3.3% | -21.4% |
Boss Energy (BOE) | $3.28 | -$0.06 | -1.8% | +24.7% | -44.6% |
Yancoal Australia (YAL) | $6.09 | -$0.11 | -1.8% | +2.0% | +3.2% |
Perenti (PRN) | $1.385 | -$0.025 | -1.8% | -1.1% | +68.9% |
South32 (S32) | $3.44 | -$0.06 | -1.7% | +1.8% | +6.8% |
Today's worst performing ASX stocks from the worst performing ASX sectors
It wasn't all doom and gloom today. Sectors that are generally considered "defensives" still managed gains as the money had to go somewhere today. Consider that there's always cash earmarked for investment in Aussie shares, billions from superannuation guarantee, constantly trickling into the market.
Some days there's enough supply going the other way to swamp this default eff-and-flow...whereas on good days it is reinforced by active fund manager buying. Today all sources of demand facilitated modest gain in Consumer Staples (XSJ) (+0.48%), Utilities (XUJ) (+0.45%), and Health Care (XHJ) (+0.31%).
The Gold (XGD) (+-%) sub-index was also a winner, tracking a what is developing as a strong gain in Asian trade (I have technical analysis on gold for you in ChartWatch).
Company | Last Price | Change $ | Change % | 1mo % | 1yr % |
|---|---|---|---|---|---|
Mayne Pharma Group (MYX) | $5.82 | +$1.14 | +24.4% | +26.0% | +8.8% |
Ansell (ANN) | $37.77 | +$2.84 | +8.1% | +11.3% | +52.5% |
Botanix Pharmaceuticals (BOT) | $0.480 | +$0.03 | +6.7% | +5.5% | +174.3% |
Resolute Mining (RSG) | $0.370 | +$0.02 | +5.7% | -8.6% | +2.8% |
Santana Minerals (SMI) | $0.555 | +$0.03 | +5.7% | +18.1% | +12.5% |
Meeka Metals (MEK) | $0.120 | +$0.005 | +4.3% | +22.4% | +233.3% |
Predictive Discovery (PDI) | $0.360 | +$0.01 | +2.9% | +38.5% | +80.0% |
Ramsay Health Care (RHC) | $34.24 | +$0.75 | +2.2% | -0.6% | -32.0% |
Black Cat Syndicate (BC8) | $0.720 | +$0.015 | +2.1% | +13.4% | +188.0% |
Elders (ELD) | $7.35 | +$0.12 | +1.7% | +5.5% | -17.3% |
Treasury Wine Estates (TWE) | $10.95 | +$0.17 | +1.6% | +0.1% | -0.8% |
Healius (HLS) | $1.375 | +$0.02 | +1.5% | -4.5% | -1.8% |
Endeavour Group (EDV) | $4.26 | +$0.06 | +1.4% | +2.7% | -23.0% |
Graincorp (GNC) | $7.47 | +$0.09 | +1.2% | +0.7% | -10.9% |
Bega Cheese (BGA) | $5.83 | +$0.07 | +1.2% | +1.0% | +57.6% |
Origin Energy (ORG) | $10.12 | +$0.12 | +1.2% | -9.1% | +19.2% |
Fisher & Paykel Healthcare Corporation (FPH) | $31.59 | +$0.23 | +0.7% | -8.0% | +35.6% |
Perseus Mining (PRU) | $2.87 | +$0.02 | +0.7% | +9.1% | +68.3% |
Newmont Corporation (NEM) | $71.72 | +$0.49 | +0.7% | +14.3% | +38.9% |
Sonic Healthcare (SHL) | $28.42 | +$0.19 | +0.7% | +1.3% | -9.1% |
Metcash (MTS) | $3.12 | +$0.02 | +0.6% | +0.3% | -13.6% |
Resmed Inc (RMD) | $37.91 | +$0.22 | +0.6% | +0.2% | +29.9% |
Northern Star Resources (NST) | $17.82 | +$0.09 | +0.5% | +7.8% | +33.8% |
Pro Medicus (PME) | $285.21 | +$1.44 | +0.5% | +5.9% | +165.8% |
Catalyst Metals (CYL) | $4.00 | +$0.02 | +0.5% | +40.8% | +654.7% |
Today's best performing ASX stocks from the best performing ASX sectors
Tonight's US Earnings Season Releases
Given US quarterly earnings are upon us, and we hardly do anything without their lead, for the next couple of weeks I'll slip in the following data on scheduled US companies' earnings releases:
Monday pre-open: AIOT, ALX, CSPI, EPC, GCMG, HAIN, INCY, ISPR, MCD, MNDY, MPAA, ON, ROIV, ROK, TGI, TSEM
Monday after the close: ACGL, ACLS, ALAB, AMKR, ARI, ARWR, BRX, CINF, CMCO, CMP, CXW, DAC, FLNC, HLIT, INSP, KRC, LSCC, MEDP, MITK, NGL, NTB, PETS, PFLT, PNNT, PSEC, QIPT, RLGT, SEED, SLQT, SPSC, UTL, VNO, VRTX, WTS, XAIR
ChartWatch
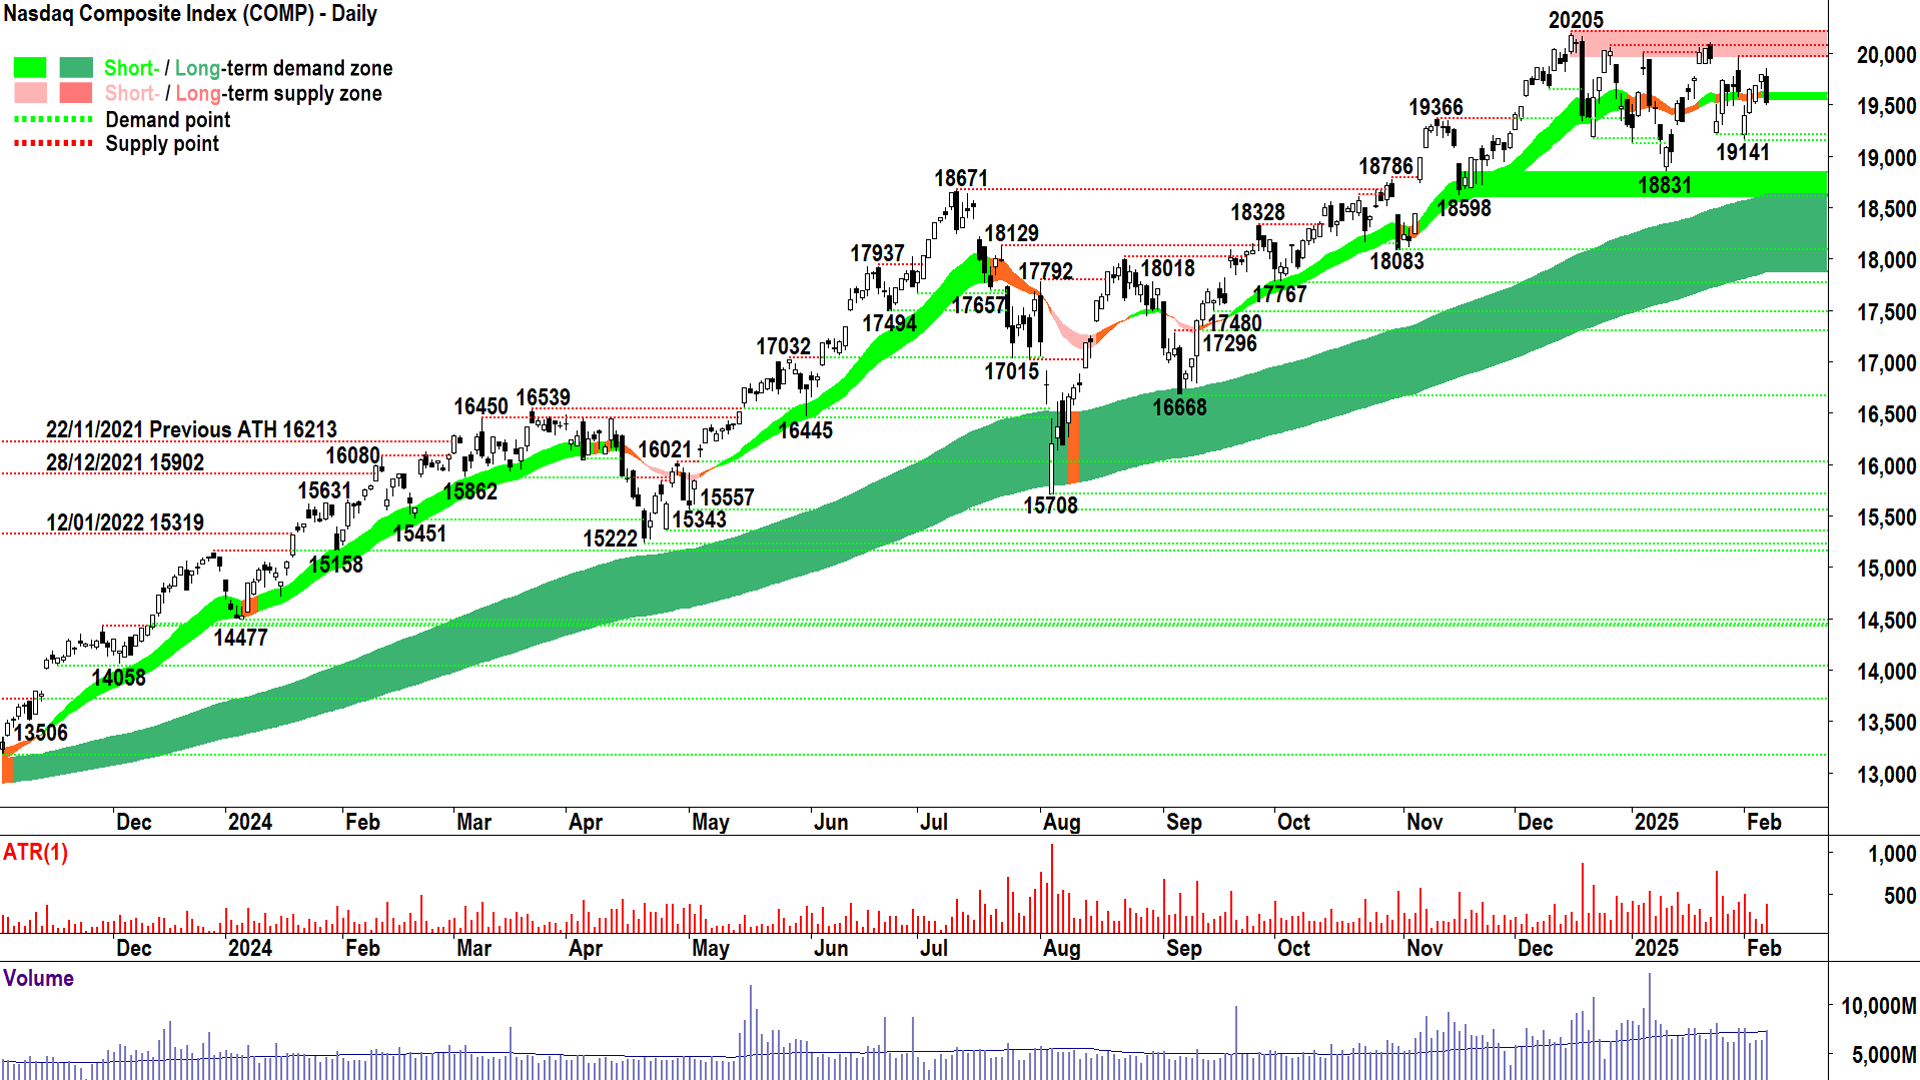
NASDAQ Composite Index

Overhead supply - a bridge too far? 🤔 (click here for full size image)
The last time we covered the Comp was in ChartWatch in the Evening Wrap on 4 February.
In that update, we were tracking a seemingly violent move to the downside due to the then latest market response to Trump tariffs.
I proposed the white body of the candle suggested not all was lost – as it signalled buy the dip market action.
Buy the dip, as I said is one half of the bull market equation – the other being FOMO’ing into rips. For those who aren’t familiar with the vernacular, FOMO stands for fear of missing out and “rips” refers to rallies.
Basically, bull markets are all about buying dips and rushing headlong into rallies so as not to miss out.
Three subsequent white bodied candles to the 3 Feb dip appears to have reinforced the case we’re still in a bull market – despite largely sideways (equilibrium) and choppy trade since the 20205 all time high.
Friday’s candle tells us that supply has again arrived, modestly, and it further confirms the growing supply zone between 19863 (Friday’s high) and 20205.
The flat nature of the short term trend ribbon and the choppy price action with peaks and troughs on either side of it, tells us that neither the demand-side nor the supply-side are in control of the Comp in the short term.
Long term control remains unequivocally demand-side in nature.
There’s not much to call in the short term – more of the same indecision until a close above at least 19863 (signalling the demand-side is wrestling control) or below 19141 (signalling the supply-side is wrestling control).
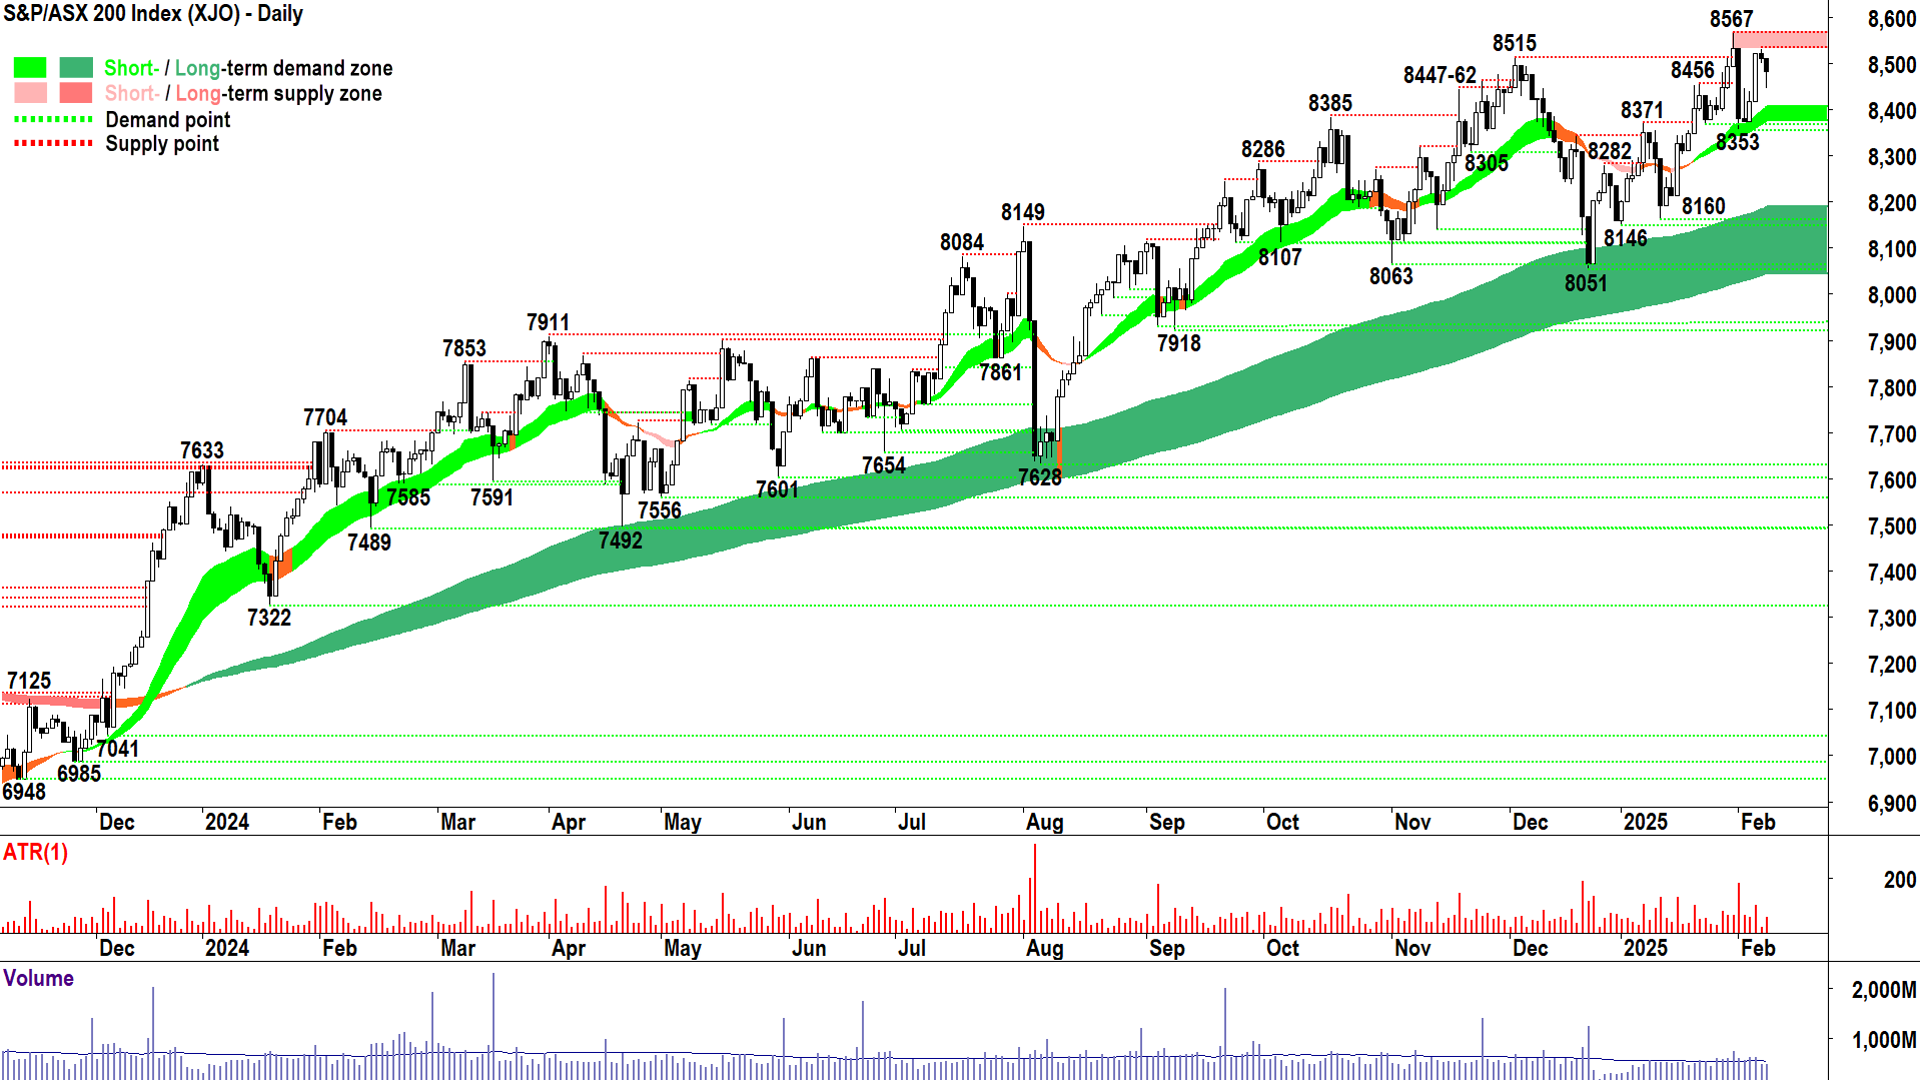
S&P/ASX 200 (XJO)
%20Chart%2010%20February%202025.png)
Solid, could have been much worse... (click here for full size image)
The last time we covered the XJO was in ChartWatch in the Evening Wrap on 4 February.
In that update, we were tracking a woeful performance from the benchmark, that had closed on the low of the session after a feeble rally on the open.
Fortunately for us, the sell the rally mentality among local market participants faded quickly, and gave way to solid demand-side candles on 5 and 6-Feb.
Today’s pullback was mild, particularly given the downward pointing shadow – the demand-side remains active.
There’s not a great dealt to add here. Short and long term trends are definitively up, both uptrend ribbons appear to be acting as dynamic demand.
The price action is flattening, however, as 8567 consolidates as a critical overhead point of supply. The demand-side must consume it before we can embark on the next leg up.
Demand is 8353, but I expect the short term trend ribbon which starts around 8407 will come into play before then.
I am "stay the course" here (i.e., prevailing uptrends) until I see falling peaks and falling troughs, and or predominance of supply-side candles, and or a close below the stated points of demand.
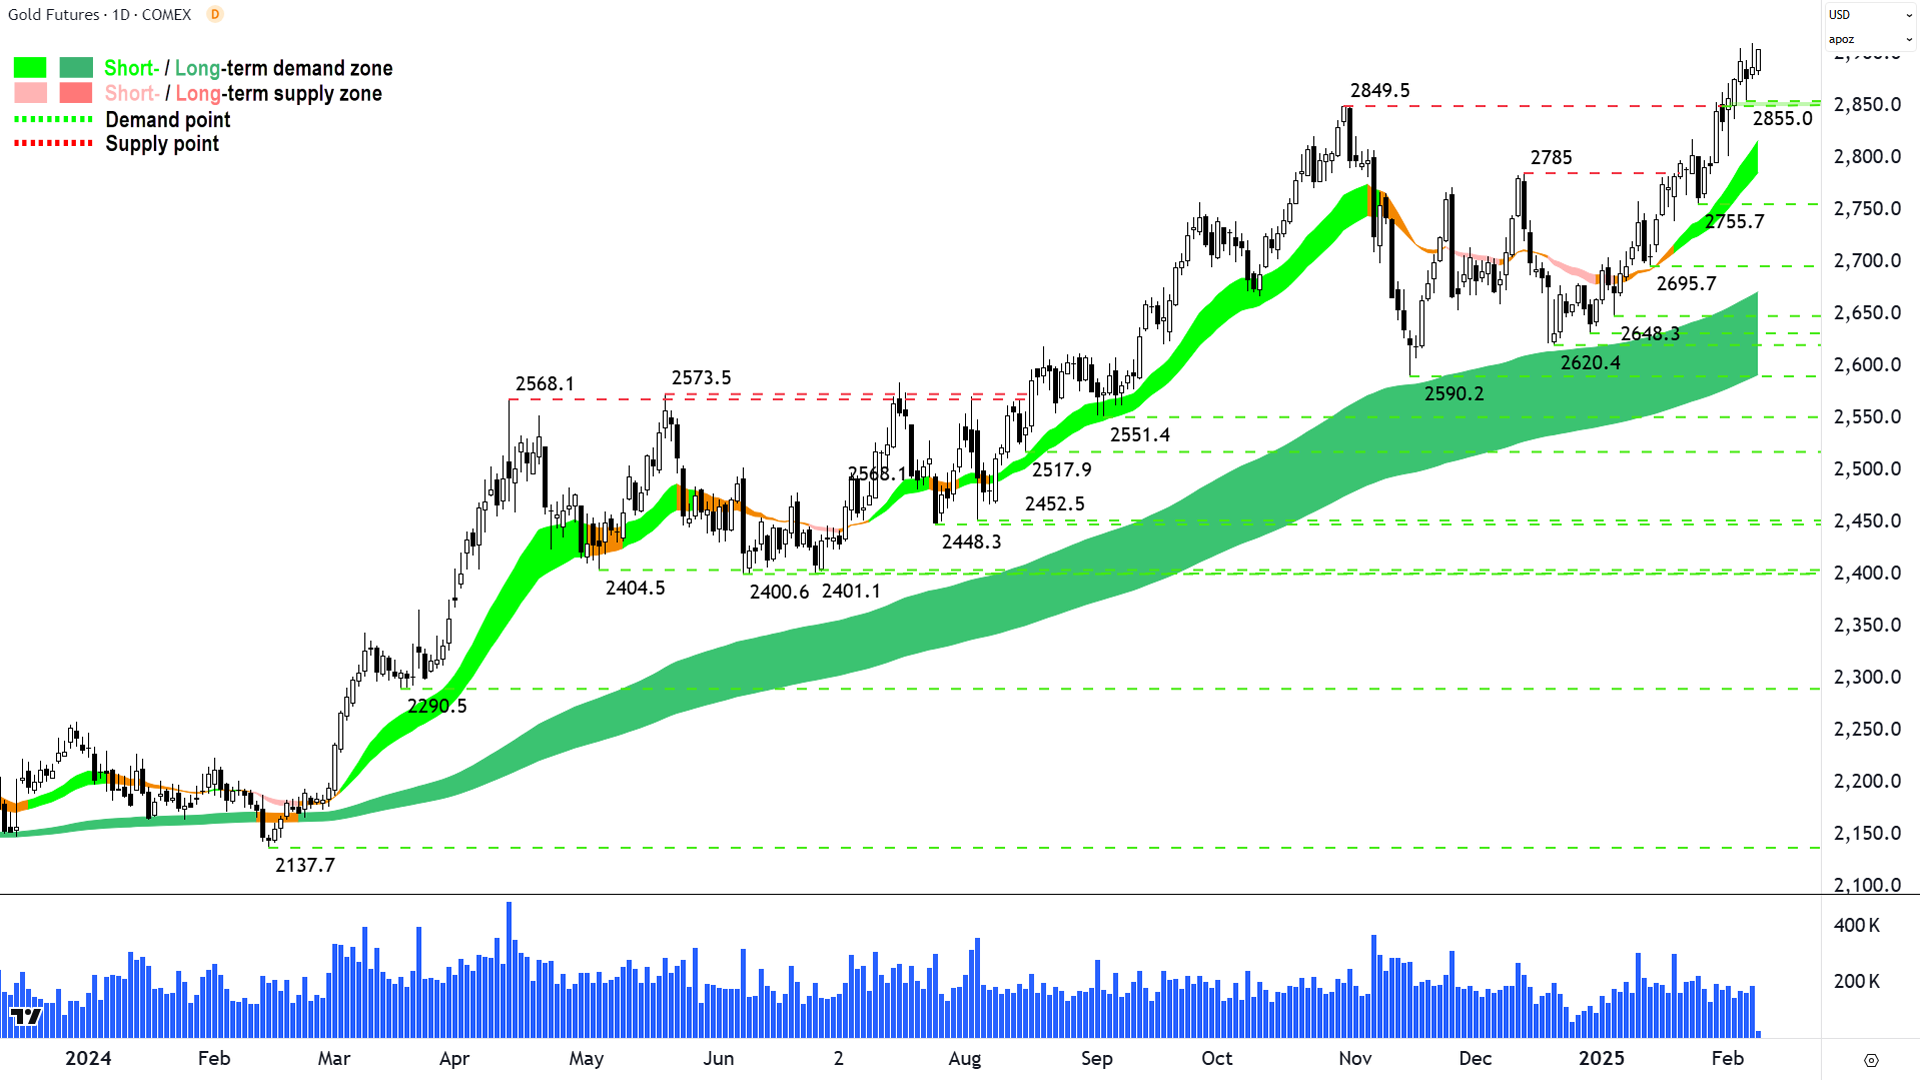
Gold Futures (Front month, back-adjusted) COMEX
%20COMEX%20Chart%2010%20February%202025.png)
A golden trend continues (click here for full size image)
The last time we covered the XJO was in ChartWatch in the Evening Wrap on 5 February.
Just as super-quick update here in the interests of posting charts that require updating! The update is this: Nothing has changed, the gold chart remains a picture of excess demand.
If you’ve been suffering through this section of the Evening Wrap for any length of time (and assuming I have converted you into a trend follower) – you know what that does / doesn’t mean and what to do / what not to do about it! 📈💪
Economy
Today
There weren't any major economic data releases in our time zone today
Later this week
Monday
Time TBA CHN New Loans & Money Supply
New Loans January: 770 billion forecast vs 990 billion previous
M2 Money Supply January: +7.3% p.a. forecast vs +7.3% p.a. previous
Tuesday
10:30 AUS Westpac Consumer Sentiment February (-0.7% in January)
11:30 NAB Business Confidence January (-2 points in December)
Wednesday
02:00 USA Federal Reserve Chairman Jerome Powell Semi-Annual Monetary Policy Report before the Senate Banking Committee - Day 1
Thursday
00:30 USA Core Consumer Price Index (CPI) January (+0.3% m/m and +3.2% p.a. forecast vs +0.2% m/m and +3.2% p.a. in December)
02:00 USA Federal Reserve Chairman Jerome Powell Semi-Annual Monetary Policy Report before the Senate Banking Committee - Day 2
AUS MI Inflation Expectations January (+4.0 p.a. in December)
Friday
00:30 USA Core Producer Price Index (PPI) January (+0.3% m/m and +3.3% p.a. forecast vs 0.0% m/m and +3.5% p.a. in December)
Saturday
00:30 USA Core Retail Sales January (+0.3% m/m forecast vs +0.4% m/m in December)
Latest News
Interesting Movers
Trading higher
+24.4% Mayne Pharma Group (MYX) - Mayne Pharma market update.
+15.5% Findi (FND) - No news since 06-Feb Findi secures additional 900 ATMs with Union Bank of India,
+13.6% The Star Entertainment Group (SGR) - Response to Media Speculation.
+8.1% Ansell (ANN) - Ansell HY FY25 Report & Accounts (Appendix 4D) and Ansell HY FY25 Results Presentation. rise is consistent with prevailing short and long term uptrends, a regular in ChartWatch ASX Scans Uptrends list 🔎📈
+7.8% Light & Wonder (LNW) - No news, possible positioning ahead of quarterly earnings results due 25-Feb 🤔
+7.8% Larvotto Resources (LRV) - No news, rise is consistent with prevailing short and long term uptrends, a regular in ChartWatch ASX Scans Uptrends list 🔎📈
+6.7% Botanix Pharmaceuticals (BOT) - No news, rise is consistent with prevailing short and long term uptrends, a regular in ChartWatch ASX Scans Uptrends list 🔎📈
+5.7% Santana Minerals (SMI) - No news since 07-Feb Corporate Presentation, rise is consistent with prevailing short and long term uptrends 🔎📈
+5.6% Develop Global (DVP) - No news, rise is consistent with prevailing short term uptrend and long term trend is transitioning from down to up 🔎📈
+5.0% Kelly Partners Group (KPG) - No news since 05-Feb Market Release 1H25 Half Year Results, rise is consistent with prevailing short and long term uptrends, a regular in ChartWatch ASX Scans Uptrends list 🔎📈
+4.3% Meeka Metals (MEK) - No news, rise is consistent with prevailing short and long term uptrends, a regular in ChartWatch ASX Scans Uptrends list 🔎📈
+4.0% Beach Energy (BPT) - No news, rebound following recent sharp sell-off due to 6-Feb Beach Energy FY25 half year results.
Trading lower
-9.8% WA1 Resources (WA1) - No news, move is consistent with recent volatility.
-6.5% Car Group (CAR) - Appendix 4D and FY25 Half Year Report and FY25 Half Year Results Presentation.
-4.6% JB HI-FI (JBH) - Appendix 4D and Financial Report - 2025 Half Year and Results Presentation - 2025 Half Year Results.
-4.4% Wisetech Global (WTC) - Media commentary.
-4.2% Pinnacle Investment Management Group (PNI) - No news since 04-Feb Half Yearly Report and Accounts, move is consistent with recent volatility since that announcement.
-3.9% Codan (CDA) - No news, general weakness across the broader Information Technology sector today.
-3.7% Nick Scali (NCK) - No news, pullback following Friday's sharp rally on the back of Half Yearly Report and Accounts.
Broker Moves
Audinate Group (AD8)
Retained at neutral at Macquarie; Price Target: $7.70 from $10.20
Aristocrat Leisure (ALL)
Initiated at buy at Bell Potter; Price Target: $83.00
Atlas Arteria (ALX)
Retained at buy at Citi; Price Target: $5.70 from $5.80
Ansell (ANN)
Retained at outperform at RBC Capital Markets; Price Target: $39.00
Retained at neutral at UBS; Price Target: $36.00
Baby Bunting Group (BBN)
Retained at accumulate at Ord Minnett; Price Target: $2.15
Bendigo and Adelaide Bank (BEN)
Retained at sell at Citi; Price Target: $9.75
BHP Group (BHP)
Retained at buy at Citi; Price Target: $46.00
Bigtincan (BTH)
Retained at equal-weight at Morgan Stanley; Price Target: $0.220 from $0.100
Brambles (BXB)
Downgraded to neutral from overweight at Jarden; Price Target: $19.45 from $17.90
Car Group (CAR)
Retained at buy at Citi; Price Target: $42.40
Retained at neutral at E&P; Price Target: $34.80
Retained at buy at UBS; Price Target: $42.50
Commonwealth Bank of Australia (CBA)
Retained at sell at Citi; Price Target: $91.50
Collins Foods (CKF)
Retained at buy at Citi; Price Target: $9.38
Charter Hall Long Wale Reit (CLW)
Retained at neutral at Citi; Price Target: $4.00 from $3.70
Retained at underweight at Jarden; Price Target: $3.80 from $3.90
Retained at underweight at JP Morgan; Price Target: $3.80 from $3.70
Retained at neutral at Macquarie; Price Target: $3.73 from $3.64
Retained at equal-weight at Morgan Stanley; Price Target: $4.55
Retained at hold at Ord Minnett; Price Target: $3.54 from $3.47
Retained at neutral at UBS; Price Target: $4.18 from $4.15
Cleanaway Waste Management (CWY)
Upgraded to overweight from neutral at Jarden; Price Target: $3.10 from $3.05
Domino's Pizza Enterprises (DMP)
Retained at neutral at Citi; Price Target: $33.25
Retained at buy at Goldman Sachs; Price Target: $40.20
Retained at overweight at Jarden; Price Target: $41.00 from $40.00
Retained at buy at Jefferies; Price Target: $42.00 from $43.00
Retained at underweight at JP Morgan; Price Target: $29.00
Upgraded to neutral from underperform at Macquarie; Price Target: $35.10 from $28.20
Retained at overweight at Morgan Stanley; Price Target: $40.00
Retained at hold at Morgans; Price Target: $32.70 from $30.70
Downgraded to sector perform from outperform at RBC Capital Markets; Price Target: $36.00 from $38.00
Retained at neutral at UBS; Price Target: $36.00 from $31.50
Evolution Mining (EVN)
Initiated at buy at Bell Potter; Price Target: $6.65
Findi (FND)
Retained at add at Morgans; Price Target: $7.68 from $7.17
GQG Partners (GQG)
Retained at outperform at Macquarie; Price Target: $3.00
Ingenia Communities Group (INA)
Downgraded to neutral from buy at UBS; Price Target: $6.15 from $5.79
Incitec Pivot (IPL)
Retained at outperform at RBC Capital Markets; Price Target: $3.90
JB HI-FI (JBH)
Retained at buy at Citi; Price Target: $110.00
Retained at sell at UBS; Price Target: $72.00
Johns Lyng Group (JLG)
Retained at neutral at Citi; Price Target: $3.95 from $4.55
Kinatico (KYP)
Initiated at buy at Shaw and Partners; Price Target: $0.280
Liontown Resources (LTR)
Upgraded to neutral from sell at UBS; Price Target: $0.750 from $0.500
Mineral Resources (MIN)
Retained at overweight at Morgan Stanley; Price Target: $50.00
Nick Scali (NCK)
Retained at buy at Citi; Price Target: $20.64 from $15.31
Downgraded to hold from outperform at CLSA; Price Target: $16.40 from $15.50
Downgraded to overweight from buy at Jarden; Price Target: $18.50 from $15.88
Retained at overweight at JP Morgan; Price Target: $19.50 from $18.00
Retained at outperform at Macquarie; Price Target: $19.90 from $15.60
Downgraded to sell from accumulate at Ord Minnett; Price Target: $14.50 from $15.00
Nufarm (NUF)
Retained at sell at Citi; Price Target: $3.75
News Corporation (NWS)
Upgraded to accumulate from hold at Ord Minnett; Price Target: $260.00 from $240.00
QPM Energy (QPM)
Initiated at buy at Bell Potter; Price Target: $0.110
Redox (RDX)
Retained at overweight at Morgan Stanley; Price Target: $4.50
REA Group (REA)
Retained at hold at Morgans; Price Target: $248.00 from $215.00
Scentre Group (SCG)
Upgraded to neutral from sell at UBS; Price Target: $3.74 from $3.53
Select Harvests (SHV)
Downgraded to market-weight from overweight at Wilsons; Price Target: $4.70 from $4.46
Sigma Healthcare (SIG)
Retained at neutral at Citi; Price Target: $2.90 from $2.50
Vitrafy Life Sciences (VFY)
Retained at buy at Ord Minnett; Price Target: $2.30 from $2.45
WEB Travel Group (WEB)
Initiated at buy at Canaccord Genuity; Price Target: $6.30
Wisetech Global (WTC)
Retained at sector perform at RBC Capital Markets; Price Target: $125.00
Scans
Top Gainers
Code | Company | Last | % Chg |
|---|---|---|---|
| HYD | HYDRIX Ltd | $0.025 | +66.67% |
| EMU | EMU NL | $0.035 | +34.62% |
| GRL | Godolphin Resources Ltd | $0.02 | +25.00% |
| MYX | Mayne Pharma Group Ltd | $5.82 | +24.36% |
| CRS | Caprice Resources Ltd | $0.026 | +23.81% |
Top Fallers
Code | Company | Last | % Chg |
|---|---|---|---|
| BGE | Bridge Saas Ltd | $0.02 | -16.67% |
| WNX | Wellnex Life Ltd | $0.76 | -16.48% |
| E79 | E79 Gold Mines Ltd | $0.033 | -15.39% |
| SUM | Summit Minerals Ltd | $0.115 | -14.82% |
| CTQ | Careteq Ltd | $0.012 | -14.29% |
52 Week Highs
Code | Company | Last | % Chg |
|---|---|---|---|
| HYD | HYDRIX Ltd | $0.025 | +66.67% |
| EMU | EMU NL | $0.035 | +34.62% |
| OZM | Ozaurum Resources Ltd | $0.16 | +23.08% |
| PWN | Parkway Corporate Ltd | $0.014 | +16.67% |
| AII | Almonty Industries Inc | $2.20 | +15.79% |
52 Week Lows
Code | Company | Last | % Chg |
|---|---|---|---|
| LIT | Livium Ltd | $0.013 | -13.33% |
| 1MC | Morella Corporation Ltd | $0.021 | -12.50% |
| PVW | PVW Resources Ltd | $0.012 | -7.69% |
| 5EA | 5E Advanced Materials Inc | $0.056 | -5.09% |
| CYG | Coventry Group Ltd | $0.985 | -4.37% |
Near Highs
Code | Company | Last | % Chg |
|---|---|---|---|
| WVOL | Ishares MSCI World Ex Aust Minimum Volatility ETF | $43.49 | +0.09% |
| IAGPF | Insurance Australia Group Ltd | $105.34 | +0.32% |
| VVLU | Vanguard Global Value Equity Active ETF | $75.33 | -0.58% |
| IHD | Ishares S&P/ASX DIV Opportunities Esg Screened ETF | $14.74 | -0.54% |
| AYLD | Global X S&P/ASX 200 Covered Call ETF | $10.66 | -0.28% |
Relative Strength Index (RSI) Oversold
Code | Company | Last | % Chg |
|---|---|---|---|
| VEA | Viva Energy Group Ltd | $2.42 | -0.82% |
| PLY | Playside Studios Ltd | $0.205 | +2.50% |
| CRN | Coronado Global Resources Inc | $0.64 | 0.00% |
| CXL | CALIX Ltd | $0.53 | +0.95% |
| ARX | Aroa Biosurgery Ltd | $0.53 | -3.64% |
