News | Market Wraps
Evening Wrap: ASX 200's Black Monday plunge lops billions from investors accounts: What, why, and where next?
The S&P/ASX 200 closed 324.5 points lower, down 4.23%.

Mentioned
The S&P/ASX 200 closed 324.5 points lower, down 4.23%.
Billions and billions 💰. Poof! 💥
Where did it go? Will it come back? And when? 🤔
I will try to answer these questions as we pick through the charred remains of the following charts: Nasdaq Composite, China A Shares, Gold, Copper, S&P/ASX 200. Among other items!
So, be sure to click/scroll through for the usual reporting of the major sector and stock-specific moves, the broker responses to them, as well as all the key upcoming economic data in tonight's Evening Wrap.
Let's dive in!
Today in Review
Mon 07 Apr 25, 5:48pm (AEST)
Name | Value | % Chg |
|---|---|---|
Major Indices | ||
| ASX 200 | 7,343.3 | -4.23% |
| All Ords | 7,524.3 | -4.12% |
| Small Ords | 2,751.4 | -4.02% |
| All Tech | 3,040.8 | -3.09% |
| Emerging Companies | 1,967.0 | -6.23% |
Currency | ||
| AUD/USD | 0.6015 | -0.42% |
US Futures | ||
| S&P 500 | 4,858.75 | -4.92% |
| Dow Jones | 36,882.0 | -4.28% |
| Nasdaq | 16,574.75 | -5.50% |
Name | Value | % Chg |
|---|---|---|
Sector | ||
| Communication Services | 1,624.7 | -0.93% |
| Consumer Staples | 11,853.6 | -1.89% |
| Utilities | 8,620.0 | -2.06% |
| Information Technology | 2,050.1 | -2.31% |
| Industrials | 7,395.8 | -2.56% |
| Real Estate | 3,341.8 | -3.56% |
| Health Care | 38,719.1 | -4.14% |
| Consumer Discretionary | 3,505.8 | -4.80% |
| Materials | 14,615.5 | -4.84% |
| Financials | 7,768.1 | -4.94% |
| Energy | 6,592.4 | -6.95% |
Markets

ASX 200 Session Chart
The S&P/ASX 200 (XJO) finished 324.5 points lower at 7,343.3, 4.42% from its session high and 2.43% from its low. In the broader-based S&P/ASX 300 (XKO), advancers lagged decliners by a near-unanimous 19 to 271.

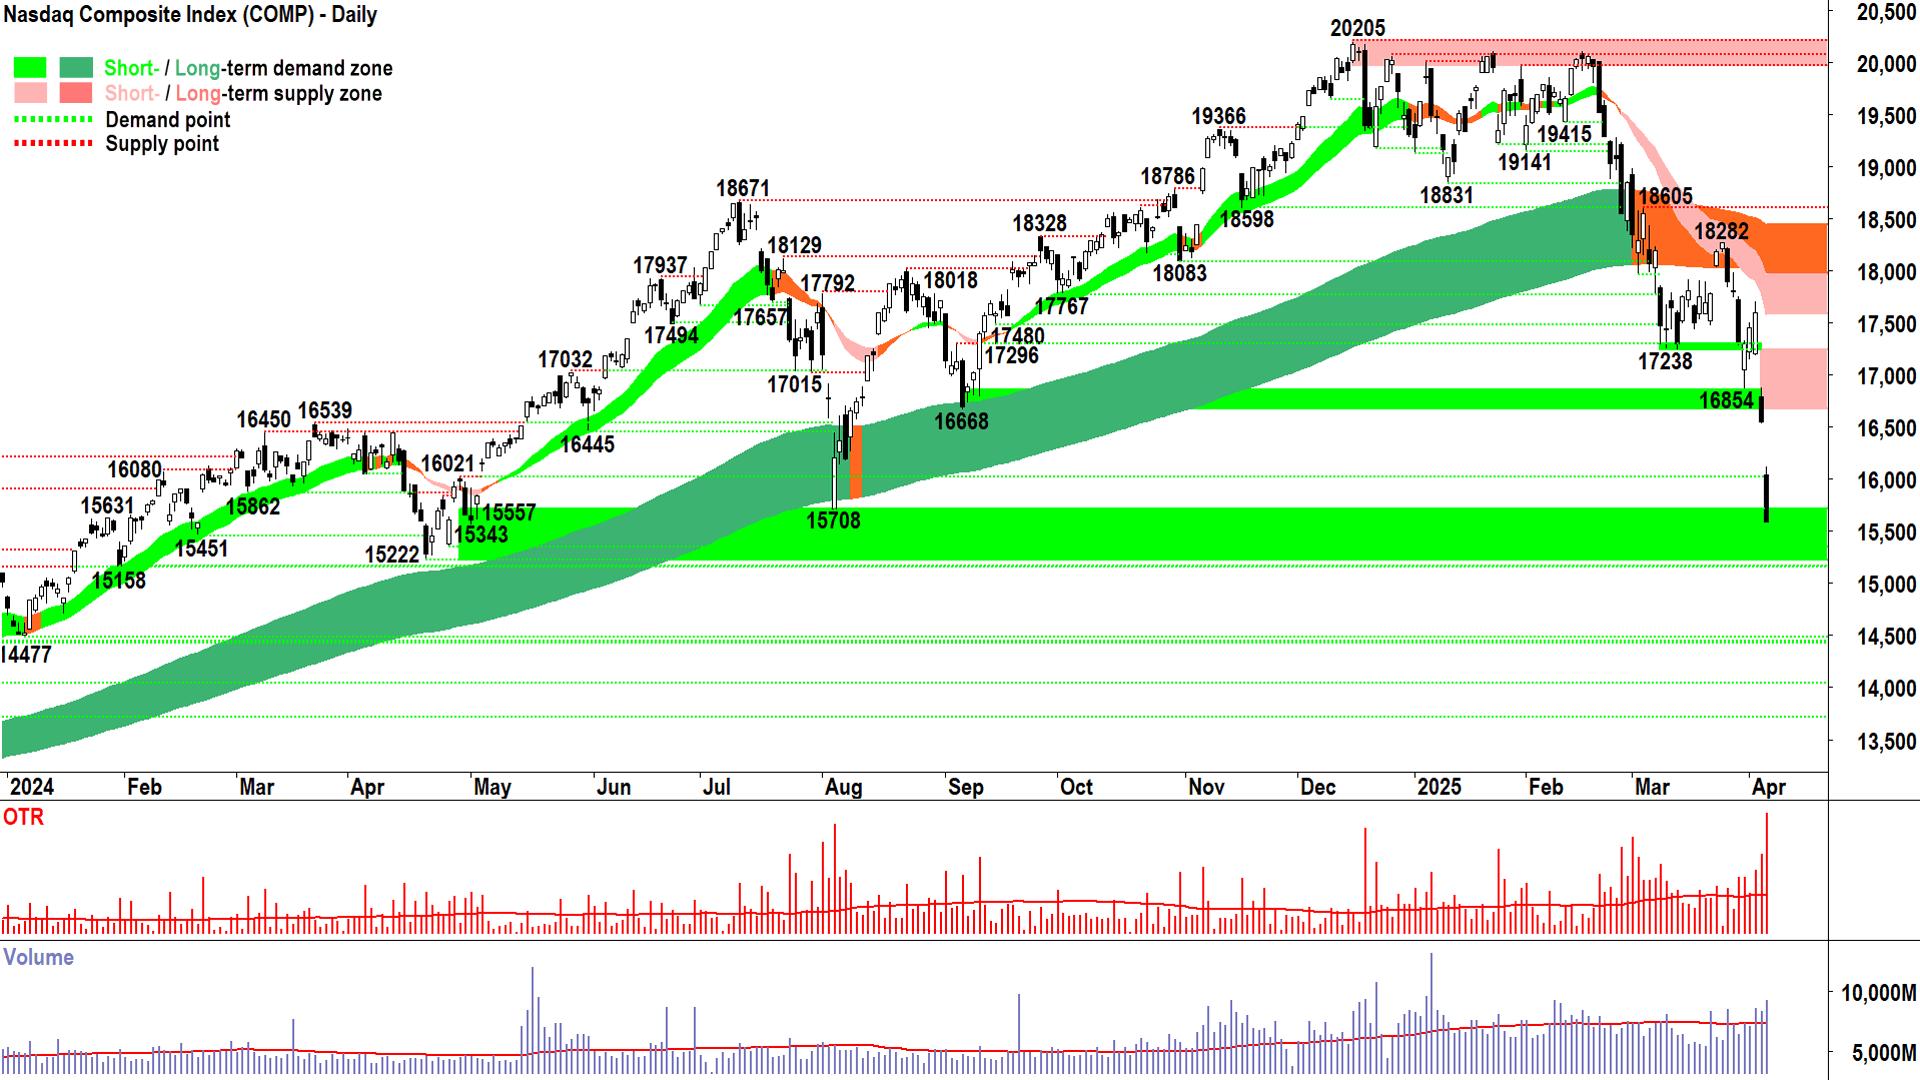
NASDAQ Composite Index (click here for full size image)
No typical market wrap (i.e., this went up and that went down) today because what’s the point? Let’s roll straight into ChartWatch – because let’s face it – the charts tell the story.
And there’s about a zillion charts I wan to show you today to try and tell that story, but I only have the same amount of time to write stuff up in (I think probably a video approach might be a better way to go, and perhaps we can do something in this regard in the near future 🎥).
For now, just a few of the most interesting charts, starting with the Comp (of course). To be fair, I think I did pretty well here calling the unfolding trainwreck, and if you’d headed the signals (50% cash, then 66% cash several weeks ago) then maybe the damage wasn’t so bad for you today.
But that’s gazing into one’s navel. What about now? 🤔
There’s a bit of a level here – 15222-ish to 15708. US futures are down another 2.5%-3% at the time of writing so we’re probably going to tickle the bottom end or lower of that range on the open.
Still, as mentioned here so many times – it is irrelevant how the candle starts – and it is ONLY relevant how it closes.
In fact, I think I said that on Friday (feels like a long time ago!).
Friday’s candle closed on the low. This means the only thing that stopped the wall of supply was…ding ding ding 🛎️!
The market closed. That usually means follow through selling at least at the open the next session, i.e., today.
So, that idea, and those futures, suggest we open lower…and then what? Go down further and stay down? That would imply there’s more excess supply in the tank / the demand-side as AWOL = expect more selling.
However, if we get a high close, and probably with it a long downward pointing shadow – then the demand-side has stepped in to short cover (primarily), but also to scoop up some discounts = expect some sort of rally.
There’s no point trying to extrapolate past the next candle. It’s that kind of market.
What I can say is, plenty of damage has been done to those who were ill-prepared (not you, of course!).
Phase 1 is perhaps largely complete – the response to Trump’s tariffs. That’s no longer news. It’s most likely been factored in.
But phase 2 could be just as damaging – i.e., who just got their backsides handed to them and now must liquidate other assets.
Then, let’s call it Phase 2.1: Who’s no longer solvent (cue headlines such-and-such leveraged to the hilt momentum-based hedge fund just blew up…and such and such other hedge fund or financial institution is leveraged to them).
Hopefully those headlines are few and far between. Because if they start to run rampant, and spiral out of control, then a simple trade crisis becomes a credit crisis.
Trust is lost in the system.
And the you know what will really start to hit the fan.
That’s how garden variety bear markets of the past turned into the really, really bad ones…like in 2007, 1987, and coincidentally the last time a sweeping package of US trade tariffs were implemented – in the early 1930’s.

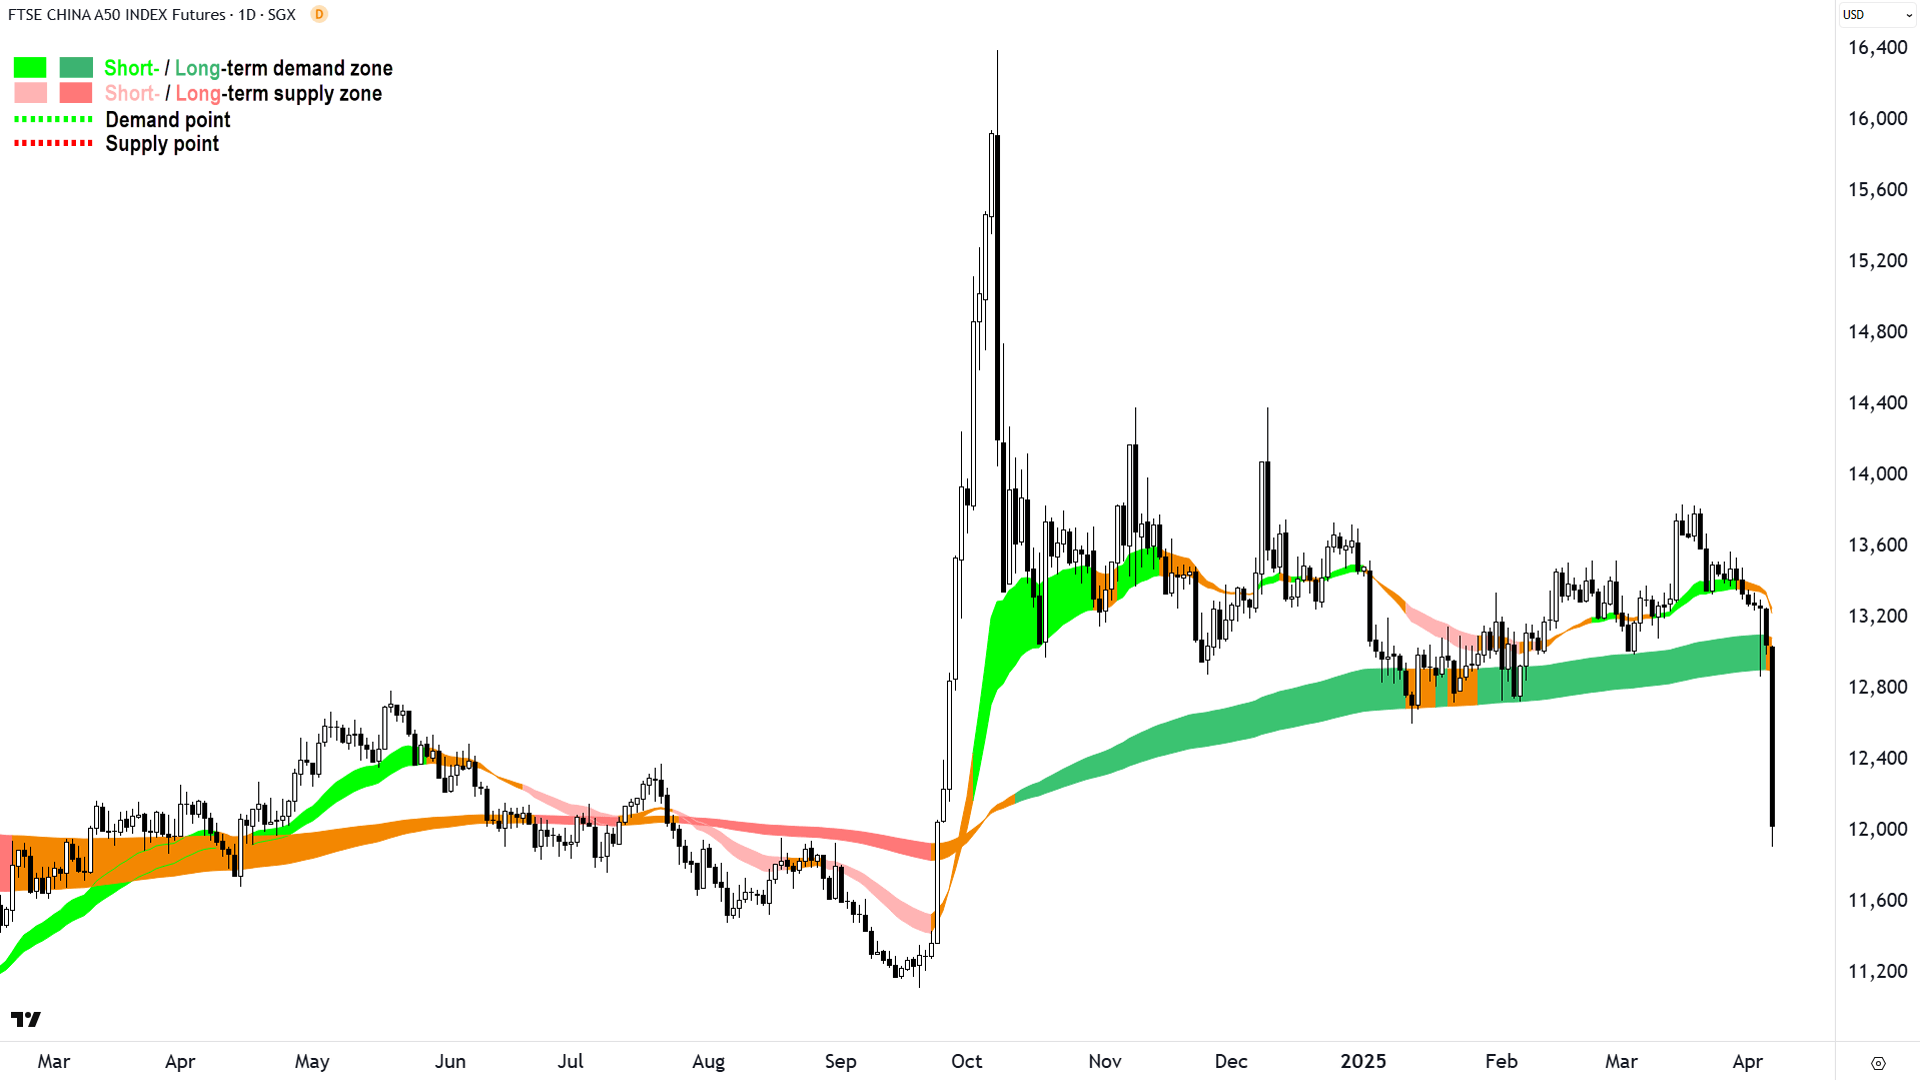
FTSE China A50 Index Futures (click here for full size image)
Now that I have your attention. A few of the other interesting charts. Exhibit 1: Chinese stocks today. No commentary required. Just sit there and look at it in quiet admiration.

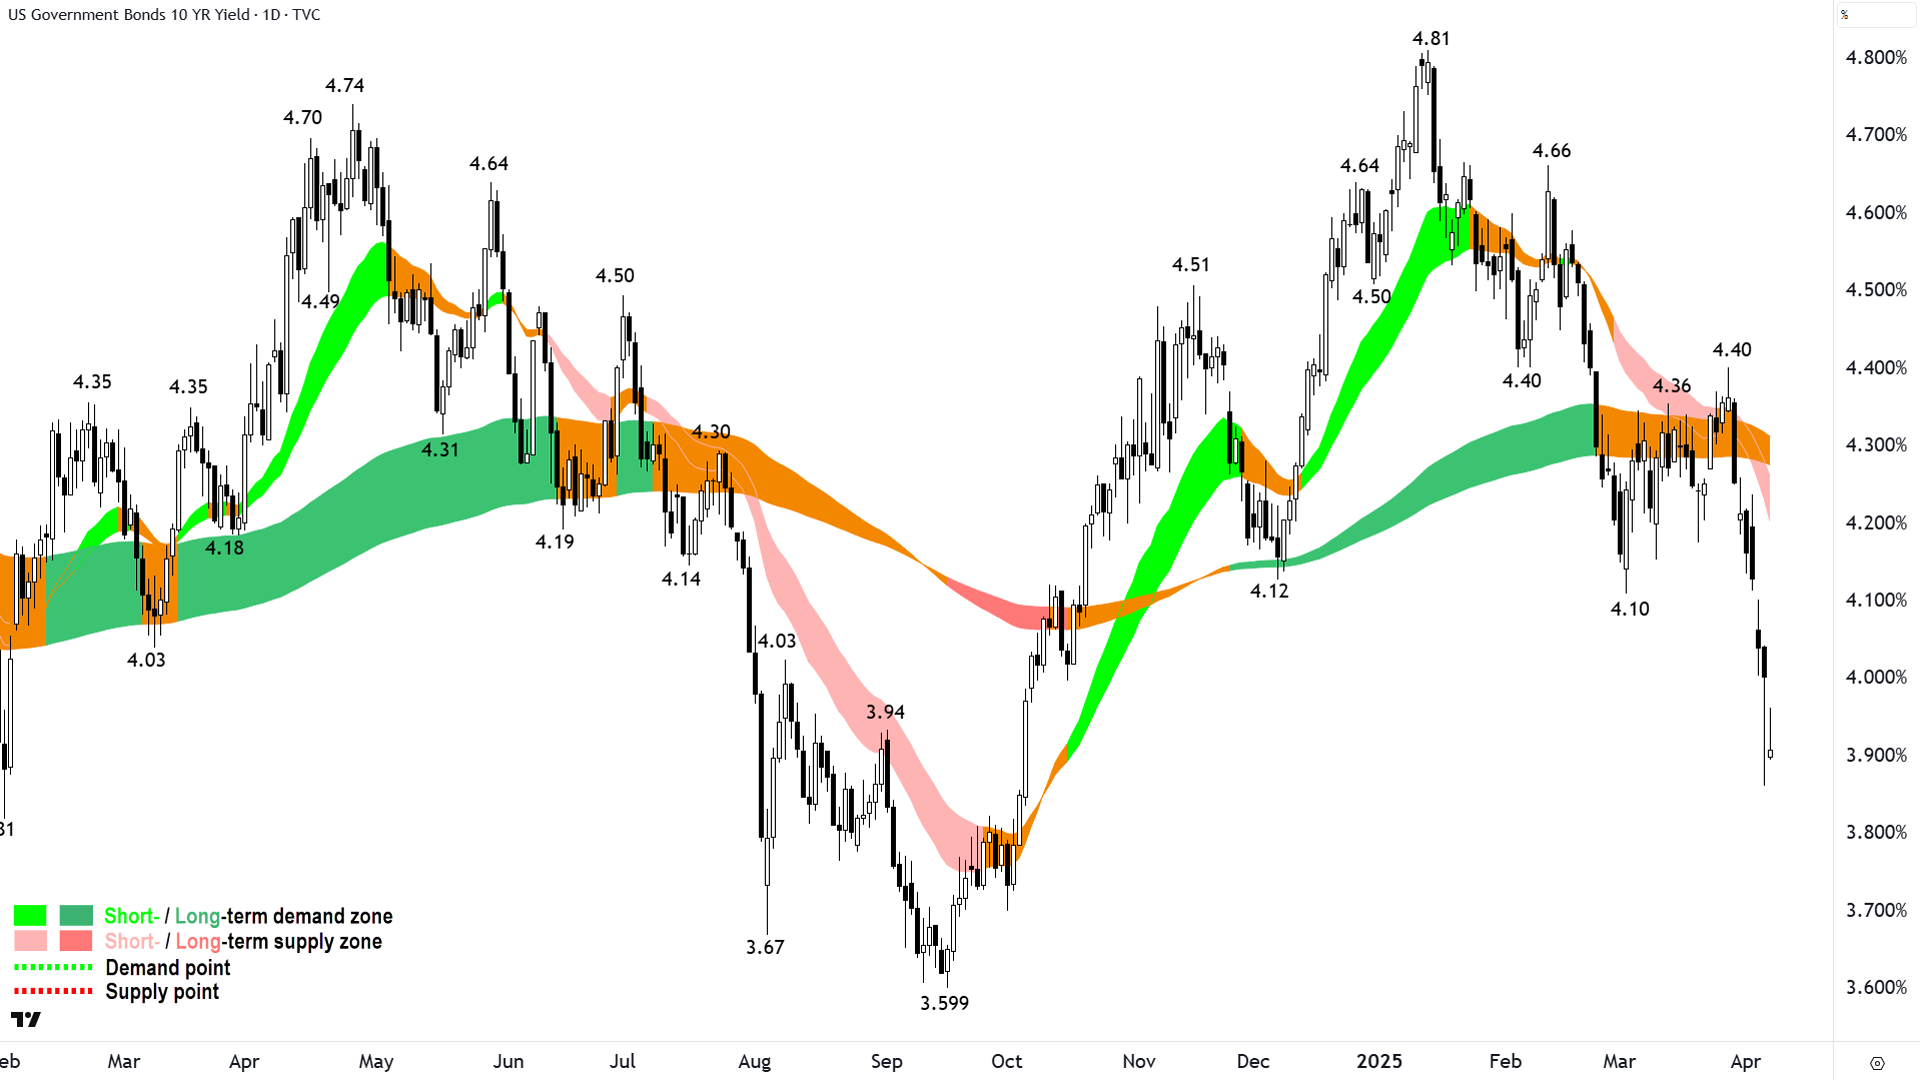
US 10 Year T-Bond Yield (click here for full size image)
Next, the canary in the mineshaft. Wow, this told us everything we need to know a few weeks ago! As you might have figured out, this is not my first rodeo – and I have learned to trust the bond market over everything else. It always starts with the price of money. It must.
The smart money shifted into bonds weeks ago. Because of the inverse relationship between bond prices and bond yields, it sent this chart sharply lower – and that’s what we picked up on. But! There is a silver lining: The price of money is getting cheaper – and one can consider this a good thing (at some point).
Basically, the bond market predicted well in advance that Trump’s trade policy would probably tank global economic growth and trigger large cuts in official interest rates.
With time (how long is the key question), these lower rates will sow the seeds of the next major bull market because cheap money is forever blowing bubbles. I’m only saying that because it’s happened every time before.
%20COMEX%20chart%207%20April%202025.png)
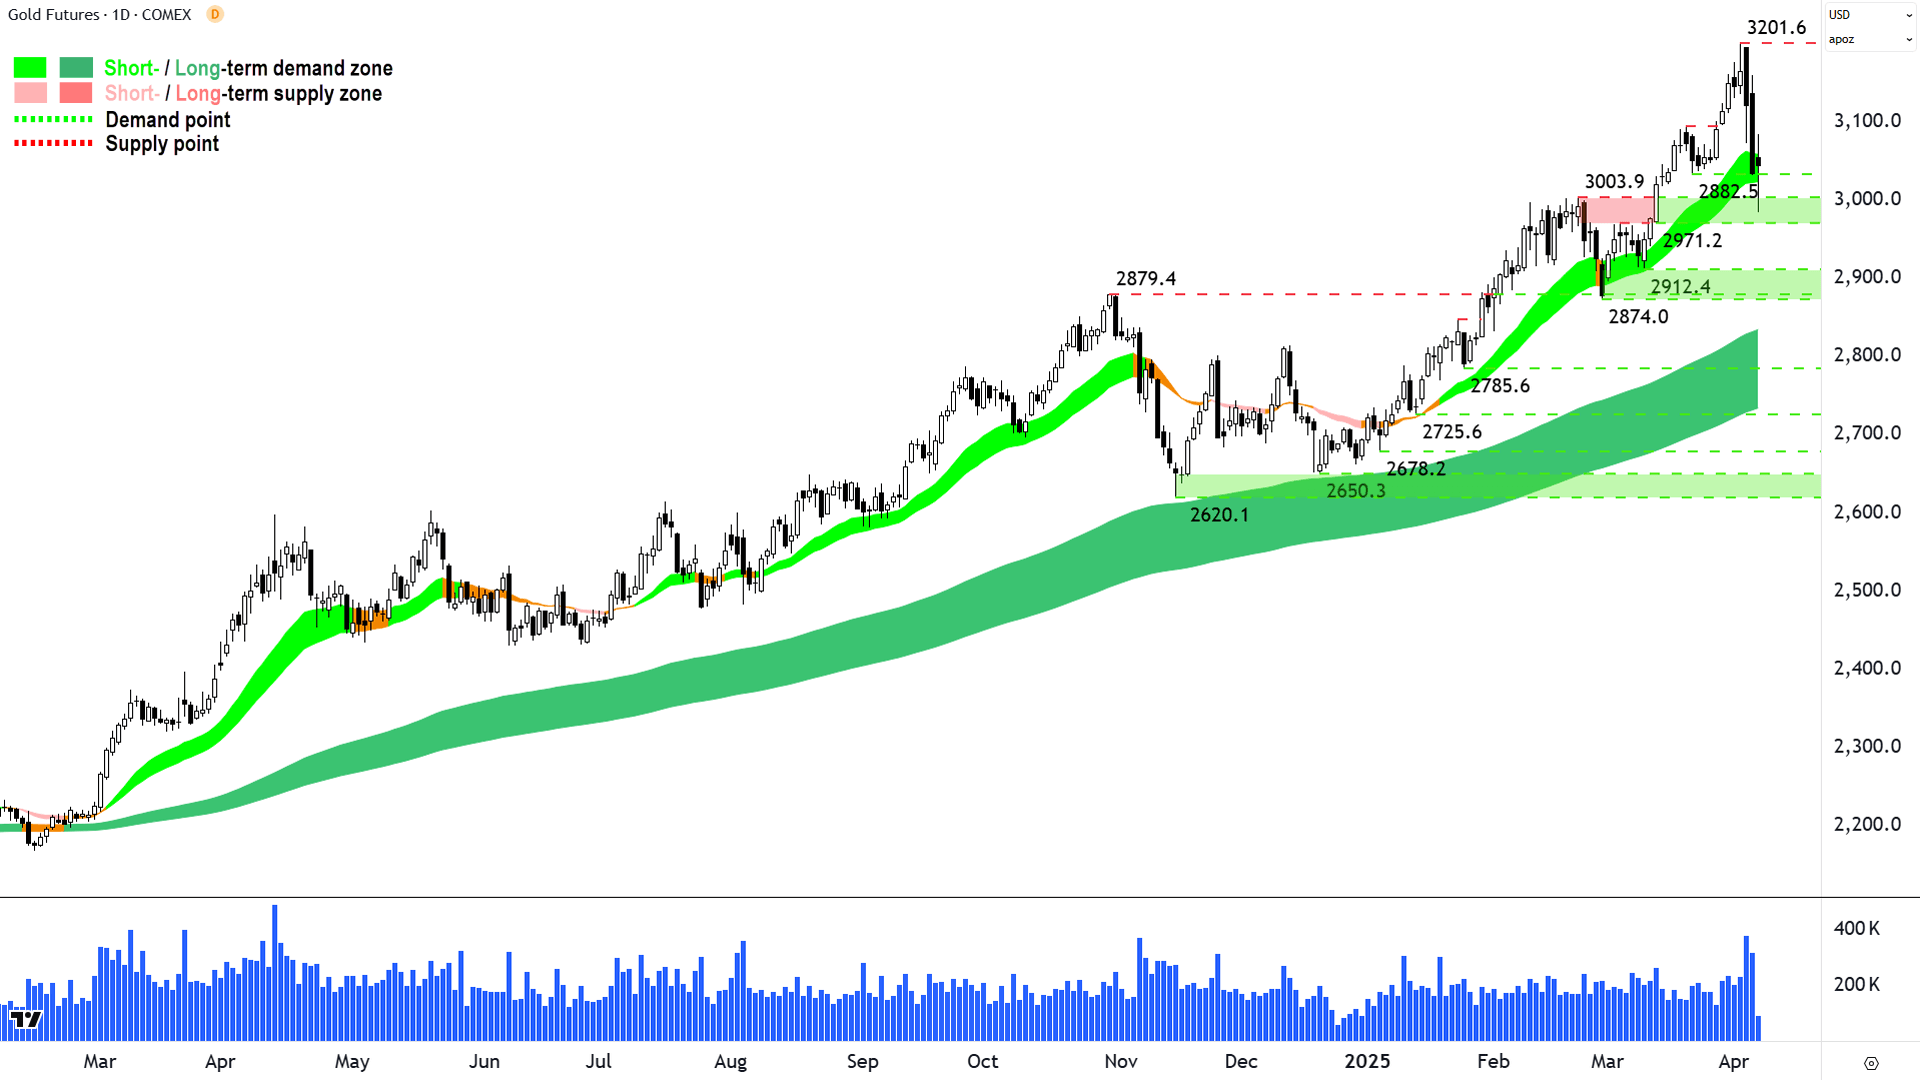
Gold Futures (Front month, back-adjusted) COMEX (click here for full size image)
Let’s change gears a little and switch out to two of the most popular commodities of the last few months. First, gold, which interestingly (but not surprisingly) also got hit in this last move. Many would say that gold is a safe haven asset, and therefore in light of the present uncertainty, should shine (no pun intended!).
It is, and under most normal circumstances it usually does. But these aren’t normal circumstances anymore. There are order of magnitude hundreds of hedge funds out there right now that just got:
Roasted
Toasted
Sliced
Diced
In no particular order.
So, to stem the bleeding from one or more severed limbs, the must liquify holdings elsewhere – even in safe haven gold.
When stuff gets really belted even safe assets can behave like risk assets.
%20COMEX%20chart%207%20April%202025.png)
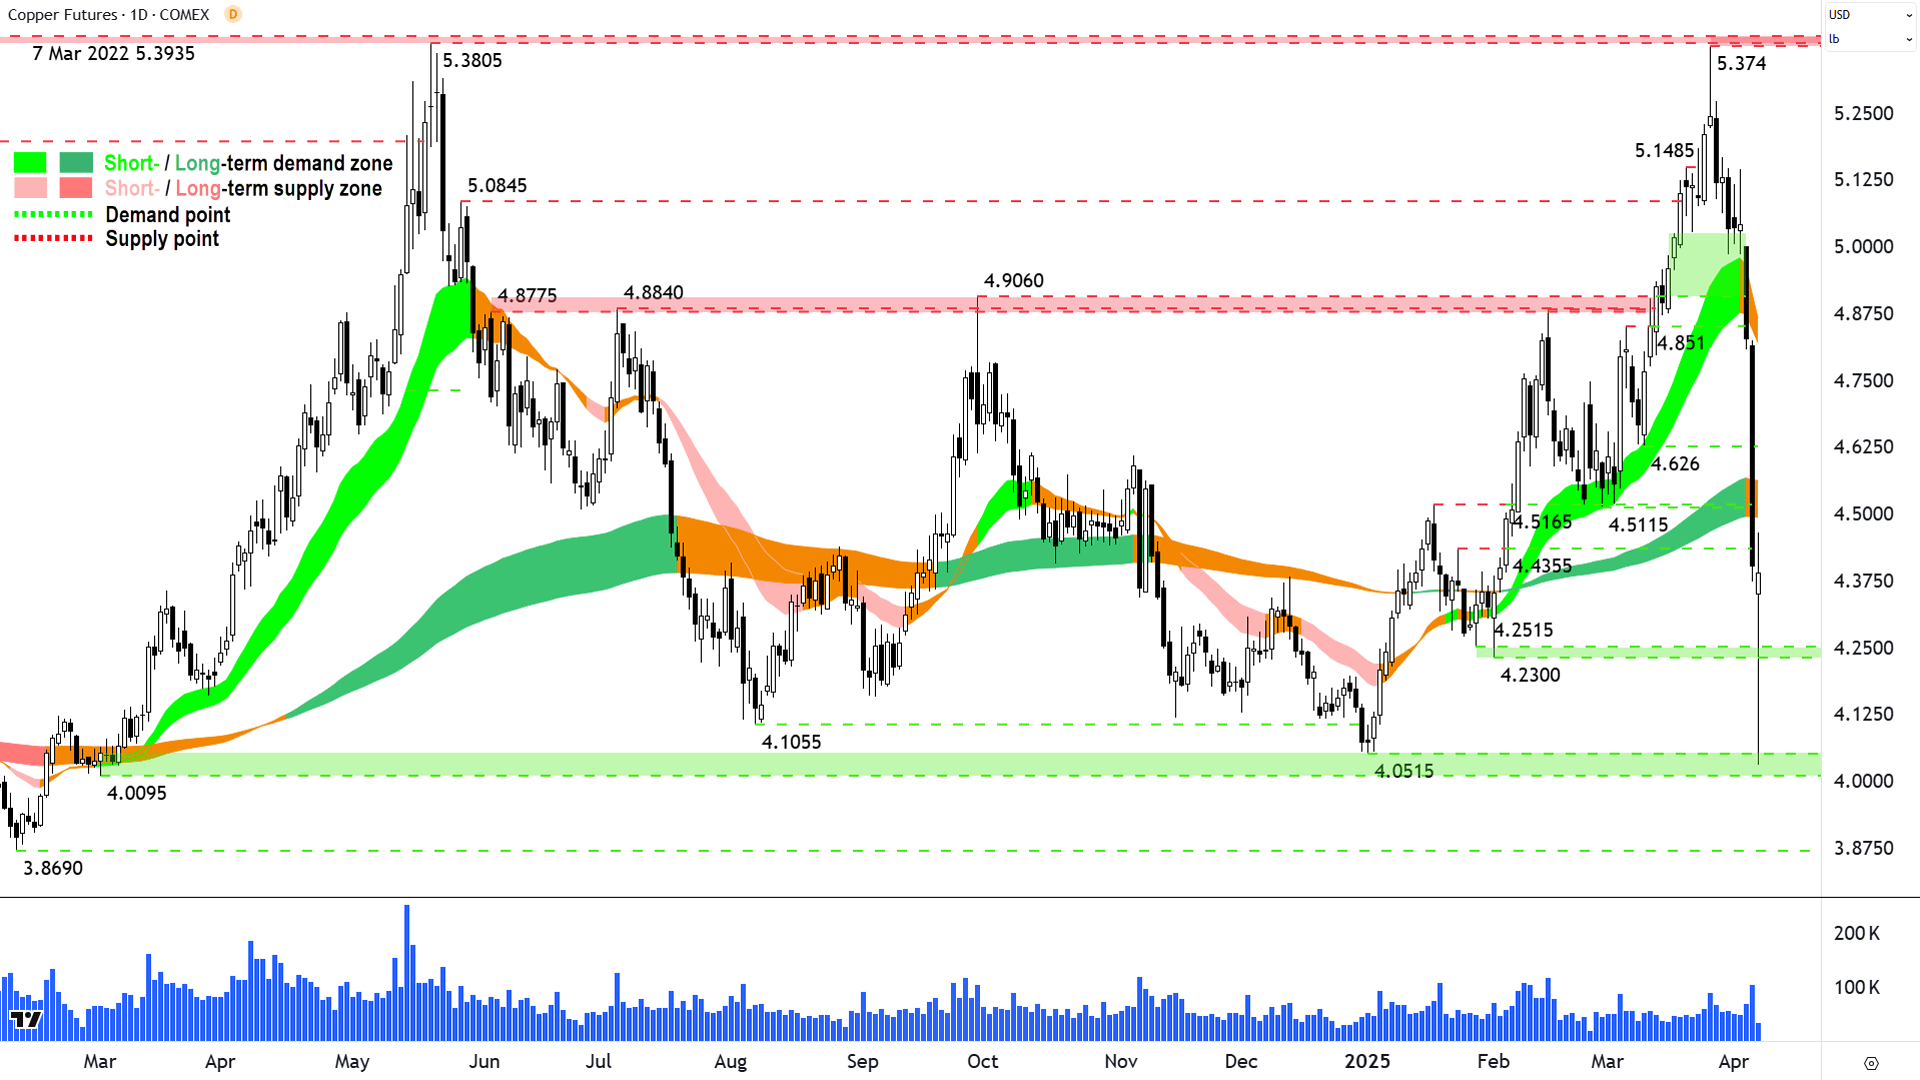
High Grade Copper Futures (Front month, back-adjusted) COMEX (click here for full size image)
Finally, copper – the next big thing (again (2024) + again (2025)). Boy, did you have to be quick on this one! But, that’s also a trait of melting markets – things play out much faster than usual. Copper knocked the 5.3805-5.3935 supply zone and tanked.
One could say: "Oh well, just because it hit that level doesn’t mean it was a signal to exit".
And one would be correct. But, one could also say that the big supply-side reversal candle on 26-Mar, with its tell-tale long upward pointing shadow was a clear warning signal to at least lighten risk, and then the follow through 27-Mar and 31-Mar confirming candles made continued long-side full risk exposure untenable. We did discuss as much in ChartWatch in last Wednesday's Wrap.
%20chart%207%20April%202024%20Source%20Market%20Index.png)
S&P/ASX 200 (XJO) (click here for full size image)
And finally, back home with the XJO. It could have been worse today – there was at least some short covering washing through the system / potentially some positional buying.
If the shorts are covering, that’s a sign those who foresaw this mess think it’s run its course – at least for now. They’re probably also looking to reload again at some, higher point in the future, though.
Still, the long black body, and the slicing through yet even more supposed (but not) zones of demand – tell a sorry tale of the demand-side’s lack of desire – or inability – to stop the rot.
Again, no point looking to much past the next candle here – but you know the drill: Fingerprints of demand = White candles, downward pointing shadows, higher troughs, interactions with points of supply etc.
7733-7808 is now a zone of supply – probably a significant one – and above that looms the short term trend ribbon. As I have maintained since the day we cracked below it – personally (you can do whatever you want to do) I cannot move off my present maximum conservatism level (max 1/3 invested min 2/3 cash) until we at least close above this key dynamic zone of supply.
Conclusions? Simple: Watch the charts! 👀
Economy
Today
AUS ANZ Job Advertisements March
+0.4% m/m vs -1.3% m/m in February
Later this week
Tuesday
10:30 Westpac Consumer Sentiment April (+3.7% to 95.9 in March)
11:30 NAB Business Confidence March (-6 points to -1 point in February)
Wednesday
(TENTATIVE) CHN New Loans March (2.36 billion forecast vs 1.01 billion in February)
(TENTATIVE) CHN M2 Money Supply March y/y (+7.0% p.a. forecast, steady with February)
Thursday
04:00 USA FOMC Meeting Minutes
11:30 CHN Consumer Price Index (CPI) & Producer Price Index (PPI) March
CPI: +0.1% p.a. vs -0.7% p.a. in February
PPI: -2.3% p.a. vs -2.2% p.a. in February
20:00 RBA Governor Michelle Bullock Speaks
22:30 USA Core CPI March (+0.3% m/m and 3.0% p.a. forecast vs +0.2% m/m and 3.1% p.a. in February)
Friday
22:30 USA Core PPI March (+0.3% m/m and 3.4% p.a. forecast vs -0.1% m/m and 3.2% p.a. in February)
Saturday
00:00 Preliminary University of Michigan Consumer Sentiment April (54.0 forecast vs 57.0 previous)
Latest News
Interesting Movers
Trading higher
+22.4% Global X Ultra Short Nasdaq-100 Hedge Fund ETF (SNAS) - No news, short Nasdaq ETF.
+20.7% Abacus Storage King (ASK) - Unsolicited Non Binding Indicative Proposal.
+18.0% BetaShares US EQY Strong Bear - CH ETF (BBUS) - No news, short US equities ETF.
+9.0% BetaShares Australian Strong Bear ETF (BBOZ) - No news, short ASX index fund.
+8.3% Challenger (CGF) - TAL Dai-ichi Life acquires minority investment in Challenger.
+4.1% BetaShares Australian Equities Bear ETF (BEAR) - No news, short ASX ETF.
Trading lower
-24.9% BetaShares Geared US Equity Fund Currency Hedged ETF (GGU) - No news, geared long US equities ETF.
-18.5% Larvotto Resources (LRV) - Bakers Creek and Eleanora-Garibaldi Drilling Update-Amended, general weakness across the broader Gold sector today.
-18.2% Titomic (TTT) - No news, general weakness across the broader Gold sector today.
-15.5% Dimerix (DXB) - No news.
-15.4% Firefly Metals (FFM) - No news, general weakness across the broader Copper sector today.
-14.9% St Barbara (SBM) - No news, general weakness across the broader Gold sector today.
-14.8% 29METALS (29M) - No news, general weakness across the broader Copper sector today, fall is consistent with prevailing short and long term downtrends, a regular in ChartWatch ASX Scans Downtrends list 🔎📉
-14.6% Novonix (NVX) - No news, fall is consistent with prevailing short and long term downtrends, a regular in ChartWatch ASX Scans Downtrends list 🔎📉
-14.1% Santana Minerals (SMI) - Update on Fast-track Approvals application submission, general weakness across the broader Gold sector today.
-12.6% Silex Systems (SLX) - No news, general weakness across the broader Uranium sector today, fall is consistent with prevailing short and long term downtrends, a regular in ChartWatch ASX Scans Downtrends list 🔎📉
-12.3% Metals Acquisition (MAC) - No news, general weakness across the broader Copper sector today, fall is consistent with prevailing short and long term downtrends, a regular in ChartWatch ASX Scans Downtrends list 🔎📉
-12.3% Core Lithium (CXO) - No news, general weakness across the broader Lithium sector today, fall is consistent with prevailing short and long term downtrends, a regular in ChartWatch ASX Scans Downtrends list 🔎📉
-11.8% Mineral Resources (MIN) - No news, general weakness across the broader Lithium sector today, fall is consistent with prevailing short and long term downtrends, a regular in ChartWatch ASX Scans Downtrends list 🔎📉
-11.5% Deep Yellow (DYL) - No news, general weakness across the broader Uranium sector today, fall is consistent with prevailing short and long term downtrends, a regular in ChartWatch ASX Scans Downtrends list 🔎📉
Broker Moves
Amplitude Energy (AEL)
Retained at buy at Bell Potter; Price Target: $0.260
Ampol (ALD)
Downgraded to neutral from outperform at Macquarie; Price Target: $23.70 from $28.00
Amotiv (AOV)
Retained at buy at Canaccord Genuity; Price Target: $11.00 from $14.40
Retained at buy at Citi; Price Target: $12.35 from $14.13
Retained at hold at CLSA; Price Target: $7.60 from $9.30
Retained at outperform at Macquarie; Price Target: $10.90 from $12.94
Retained at add at Morgans; Price Target: $10.75 from $12.95
Retained at outperform at RBC Capital Markets; Price Target: $12.00 from $13.50
Retained at buy at UBS; Price Target: $12.60
Eagers Automotive (APE)
Retained at neutral at UBS; Price Target: $14.80
ARB Corporation (ARB)
Retained at sell at UBS; Price Target: $34.00
Autosports Group (ASG)
Retained at neutral at UBS; Price Target: $1.800
ASX (ASX)
Retained at at Goldman Sachs; Price Target: $62.00 from $61.00
Retained at neutral at Macquarie; Price Target: $65.00 from $66.50
Retained at sell at UBS; Price Target: $62.50 from $66.00
Bellevue Gold (BGL)
Downgraded to hold from buy at Bell Potter; Price Target: $1.300 from $2.00
Boss Energy (BOE)
Retained at buy at Citi; Price Target: $3.30
Brazilian Rare Earths (BRE)
Retained at buy at Canaccord Genuity; Price Target: $8.20
Breville Group (BRG)
Retained at outperform at Macquarie; Price Target: $41.10
Collins Foods (CKF)
Retained at neutral at Macquarie; Price Target: $8.20
Coles Group (COL)
Retained at outperform at Macquarie; Price Target: $22.00
Coronado Global Resources (CRN)
Downgraded to hold from buy at Jefferies; Price Target: $0.300 from $1.000
Capstone Copper Corp. (CSC)
Retained at buy at Citi; Price Target: $11.80 from $12.80
Domino's Pizza Enterprises (DMP)
Retained at neutral at Macquarie; Price Target: $30.50
EBR Systems (EBR)
Initiated at buy at E&P; Price Target: $2.55
Endeavour Group (EDV)
Retained at neutral at Macquarie; Price Target: $4.10
Fletcher Building (FBU)
Retained at neutral at UBS; Price Target: NZ$3.40 from NZ$3.45
Harvey Norman (HVN)
Retained at outperform at Macquarie; Price Target: $5.50
IGO (IGO)
Upgraded to buy from hold at Jefferies; Price Target: $5.00
Imricor Medical Systems (IMR)
Retained at buy at Morgans; Price Target: $2.28 from $2.18
Inghams Group (ING)
Retained at outperform at Macquarie; Price Target: $3.50
JB HI-FI (JBH)
Retained at outperform at Macquarie; Price Target: $111.00
James Hardie Industries (JHX)
Retained at neutral at Citi; Price Target: $56.00
Lovisa (LOV)
Downgraded to neutral from overweight at Jarden; Price Target: $22.87 from $29.02
Lynas Rare Earths (LYC)
Retained at buy at Canaccord Genuity; Price Target: $0.350
Meteoric Resources (MEI)
Retained at buy at Canaccord Genuity; Price Target: $5.00
Magellan Financial Group (MFG)
Retained at at Goldman Sachs; Price Target: $8.75 from $10.70
Upgraded to neutral from underweight at JP Morgan; Price Target: $7.60 from $9.00
Metcash (MTS)
Retained at neutral at Macquarie; Price Target: $3.30
Mystate (MYS)
Retained at buy at Ord Minnett; Price Target: $4.53 from $4.74
Nick Scali (NCK)
Retained at outperform at Macquarie; Price Target: $19.90
Paladin Energy (PDN)
Retained at buy at Citi; Price Target: $10.20 from $11.00
Pilbara Minerals (PLS)
Upgraded to buy from hold at Jefferies; Price Target: $2.20
Premier Investments (PMV)
Retained at neutral at Macquarie; Price Target: $21.80
Sandfire Resources (SFR)
Upgraded to buy from hold at Jefferies; Price Target: $10.50 from $10.00
Sigma Healthcare (SIG)
Retained at underperform at Macquarie; Price Target: $2.70
Santana Minerals (SMI)
Retained at outperform at RBC Capital Markets; Price Target: $0.750
Super Retail Group (SUL)
Retained at neutral at Macquarie; Price Target: $15.40
Tasmea (TEA)
Retained at buy at Shaw and Partners; Price Target: $3.00 from $2.85
Temple & Webster Group (TPW)
Retained at outperform at Macquarie; Price Target: $17.60
Treasury Wine Estates (TWE)
Retained at outperform at Macquarie; Price Target: $11.70
Universal Store (UNI)
Retained at outperform at Macquarie; Price Target: $9.80
Viva Energy Group (VEA)
Downgraded to neutral from outperform at Macquarie; Price Target: $1.700 from $2.80
Woodside Energy Group (WDS)
Retained at neutral at Macquarie; Price Target: $29.50
Wesfarmers (WES)
Retained at neutral at Macquarie; Price Target: $75.00
Woolworths Group (WOW)
Retained at outperform at Macquarie; Price Target: $30.80
Wisetech Global (WTC)
Retained at outperform at CLSA; Price Target: $122.00
Scans
Top Gainers
Code | Company | Last | % Chg |
|---|---|---|---|
| BDT | Birddog Technology Ltd | $0.046 | +48.39% |
| ABE | Australian Bond Exchange Holdings Ltd | $0.043 | +30.30% |
| CVR | Cavalier Resources Ltd | $0.28 | +27.27% |
| SNAS | Global X Ultra Short Nasdaq 100 Complex ETF | $39.67 | +22.40% |
| LSR | Lodestar Minerals Ltd | $0.017 | +21.43% |
Top Fallers
Code | Company | Last | % Chg |
|---|---|---|---|
| PSC | Prospect Resources Ltd | $0.09 | -30.77% |
| FCT | Firstwave Cloud Technology Ltd | $0.012 | -29.41% |
| IRX | Inhalerx Ltd | $0.018 | -28.00% |
| ASH | Ashley Services Group Ltd | $0.135 | -27.03% |
| RMY | Rma Global Ltd | $0.025 | -26.47% |
52 Week Highs
Code | Company | Last | % Chg |
|---|---|---|---|
| CVR | Cavalier Resources Ltd | $0.28 | +27.27% |
| SNAS | Global X Ultra Short Nasdaq 100 Complex ETF | $39.67 | +22.40% |
| ASK | Abacus Storage King | $1.40 | +20.69% |
| BBUS | Betashares US EQY Strong Bear CCY H Complex ETF | $6.62 | +18.00% |
| YANK | Betashares Strong US Dollar Complex ETF | $15.06 | +11.80% |
52 Week Lows
Code | Company | Last | % Chg |
|---|---|---|---|
| IRX | Inhalerx Ltd | $0.018 | -28.00% |
| ASH | Ashley Services Group Ltd | $0.135 | -27.03% |
| RMY | Rma Global Ltd | $0.025 | -26.47% |
| HFR | Highfield Resources Ltd | $0.10 | -25.93% |
| WNX | Wellnex Life Ltd | $0.26 | -25.71% |
Near Highs
Code | Company | Last | % Chg |
|---|---|---|---|
| GLDN | Ishares Physical Gold ETF | $40.20 | +1.62% |
| GXLD | Global X Gold Bullion ETF | $50.32 | +1.19% |
| BTH | Bigtincan Holdings Ltd | $0.215 | -2.27% |
| TLS | Telstra Group Ltd | $4.31 | -0.46% |
| NUGG | Vaneck Gold Bullion ETF | $50.46 | +1.75% |
Relative Strength Index (RSI) Oversold
Code | Company | Last | % Chg |
|---|---|---|---|
| FFM | Firefly Metals Ltd | $0.685 | -15.43% |
| AYLD | Global X S&P/ASX 200 Covered Call ETF | $9.53 | -3.35% |
| SFC | Schaffer Corporation Ltd | $20.50 | -1.91% |
| JEPI | Jpmorgan Equity Premium Income Active ETF | $50.92 | -4.52% |
| RWC | Reliance Worldwide Corporation Ltd | $3.94 | -2.23% |
