
News | Market Wraps
Evening Wrap: ASX 200 surges on inflation beat, economists now tipping 4 rate cuts by May 2026
The S&P/ASX 200 closed 51.8 points higher, up 0.60%.

Mentioned
The S&P/ASX 200 closed 51.8 points higher, up 0.60%.
Aussie shares shrugged off less than ideal leads from overseas stock and commodity markets to add over 50 points and close just 0.8 of a point from a new record high.
Better than expected inflation data was the catalyst, with annual inflation in Australia dipping to 2.1% in the June quarter (down from 2.4% in the March quarter and below the midpoint of the RBA's target 2-3% range for two quarters in a row).
To make sense of all the above, I have detailed technical analysis on the Nasdaq Composite, S&P/ASX 200, and Uranium in today's ChartWatch.
Be sure to click/scroll through for the usual reporting of the major sector and stock-specific moves, the broker responses to them, as well as all the key economic data in tonight's Evening Wrap.
Let's dive in!
Today in Review
Wed 30 Jul 25, 5:03pm (AEST)
Name | Value | % Chg |
|---|---|---|
Major Indices | ||
| ASX 200 | 8,756.4 | +0.59% |
| All Ords | 9,015.4 | +0.54% |
| Small Ords | 3,353.2 | +0.47% |
| All Tech | 4,218.5 | -0.53% |
| Emerging Companies | 2,391.8 | -0.20% |
Currency | ||
| AUD/USD | 0.6509 | -0.02% |
US Futures | ||
| S&P 500 | 6,414.25 | +0.13% |
| Dow Jones | 44,838.0 | +0.05% |
| Nasdaq | 23,502.0 | +0.21% |
Name | Value | % Chg |
|---|---|---|
Sector | ||
| Consumer Staples | 12,161.1 | +1.29% |
| Real Estate | 4,012.2 | +1.26% |
| Consumer Discretionary | 4,229.0 | +1.19% |
| Financials | 9,387.6 | +1.13% |
| Industrials | 8,480.6 | +0.70% |
| Communication Services | 1,883.5 | +0.19% |
| Materials | 16,937.0 | -0.10% |
| Energy | 9,212.3 | -0.14% |
| Health Care | 45,332.4 | -0.17% |
| Information Technology | 3,005.5 | -0.37% |
| Utilities | 9,611.9 | -0.79% |
Markets
%20intraday%20chart%2030%20Jul%202025.png)
ASX 200 Session Chart
The S&P/ASX 200 (XJO) finished 51.8 points higher at 8,756.4, 0.78% from its session low and just 0.19% from its high. In the broader-based S&P/ASX 300 (XKO) advancers beat decliners by 177 to 105.
Better than expected inflation data was the catalyst for today's strong performance, as the ASX 200 shrugged off negative leads from US stocks and base metals markets overnight, as well as lower major Asian bourses today.
Annual inflation in Australia dipped to 2.1% in the June quarter (down from 2.4% in the March quarter and below the midpoint of the RBA's target 2-3% range for two quarters in a row). Most economists said today that the result clears the way for further RBA rate cuts – as many as four more in the next 10 months according to one (see Economy section below).
The good news on inflation sent investors hunting for consumer stocks, both defensive supermarkets like Coles (COL) (+1.7%) and Woolworths (WOW) (+1.6%), but also discretionary consumer plays like Collins Food (CKF) (+2.0%) and Breville (BRG) (+1.7%) benefiting.
Interest rate sensitives (i.e., long duration and bond proxies) like Real Estate Investment Trusts (XPJ) (+1.3%) and Financials (XFJ) (+1.1%), also prospered.
There weren't too many losers in today's outpouring of inflation-based relief, but those weaker base metals prices overnight (and a pullback in the iron ore price in Asian trade today) dragged on Resources (XJR) (-0.25%), while falling US technology stocks (see Comp analysis in ChartWatch below) dragged on Information Technology (XIJ) (-0.4%).
Company | Last Price | Change $ | Change % | 1mo % | 1yr % |
|---|---|---|---|---|---|
Worley (WOR) | $13.68 | +$0.42 | +3.2% | +4.6% | -8.4% |
Santos (STO) | $7.91 | +$0.16 | +2.1% | +3.3% | +3.4% |
Light & Wonder (LNW) | $152.00 | +$2.8 | +1.9% | +3.1% | -2.9% |
Woodside Energy Group (WDS) | $26.60 | +$0.41 | +1.6% | +12.6% | -1.0% |
Sandfire Resources (SFR) | $11.16 | +$0.17 | +1.5% | -0.5% | +36.8% |
Challenger (CGF) | $8.17 | +$0.12 | +1.5% | +1.1% | +20.7% |
Fisher & Paykel Healthcare Corporation (FPH) | $33.78 | +$0.48 | +1.4% | +0.4% | +15.4% |
Technology One (TNE) | $40.20 | +$0.55 | +1.4% | -2.0% | +108.5% |
National Australia Bank (NAB) | $38.20 | +$0.44 | +1.2% | -2.9% | +2.6% |
Metcash (MTS) | $3.90 | +$0.04 | +1.0% | -0.3% | +9.6% |
The A2 Milk Company (A2M) | $8.09 | +$0.08 | +1.0% | +1.0% | +17.1% |
AMP (AMP) | $1.610 | +$0.015 | +0.9% | +27.8% | +43.1% |
Insurance Australia Group (IAG) | $8.67 | +$0.08 | +0.9% | -4.0% | +21.3% |
Aurizon (AZJ) | $3.29 | +$0.03 | +0.9% | +8.6% | -8.6% |
Pro Medicus (PME) | $323.21 | +$2.77 | +0.9% | +13.4% | +138.7% |
Today's blue chip winners
Company | Last Price | Change $ | Change % | 1mo % | 1yr % |
|---|---|---|---|---|---|
Flight Centre Travel Group (FLT) | $12.74 | -$0.48 | -3.6% | +2.1% | -40.2% |
Treasury Wine Estates (TWE) | $7.68 | -$0.23 | -2.9% | -1.7% | -37.1% |
Telix Pharmaceuticals (TLX) | $20.54 | -$0.55 | -2.6% | -15.9% | +6.9% |
IDP Education (IEL) | $3.62 | -$0.08 | -2.2% | -1.4% | -74.1% |
Perseus Mining (PRU) | $3.41 | -$0.07 | -2.0% | +0.3% | +32.2% |
Reece (REH) | $13.36 | -$0.26 | -1.9% | -6.9% | -49.8% |
Orora (ORA) | $2.08 | -$0.04 | -1.9% | +10.1% | +1.5% |
Bluescope Steel (BSL) | $24.36 | -$0.46 | -1.9% | +5.4% | +14.8% |
Vicinity Centres (VCX) | $2.43 | -$0.04 | -1.6% | -1.6% | +21.8% |
Ansell (ANN) | $30.39 | -$0.49 | -1.6% | +0.3% | +13.5% |
Ampol (ALD) | $26.86 | -$0.42 | -1.5% | +4.4% | -17.4% |
Pilbara Minerals (PLS) | $1.675 | -$0.025 | -1.5% | +25.5% | -41.6% |
Today's blue chip losers
ChartWatch
NASDAQ Composite Index

No a reason to panic just yet (click here for full size image)
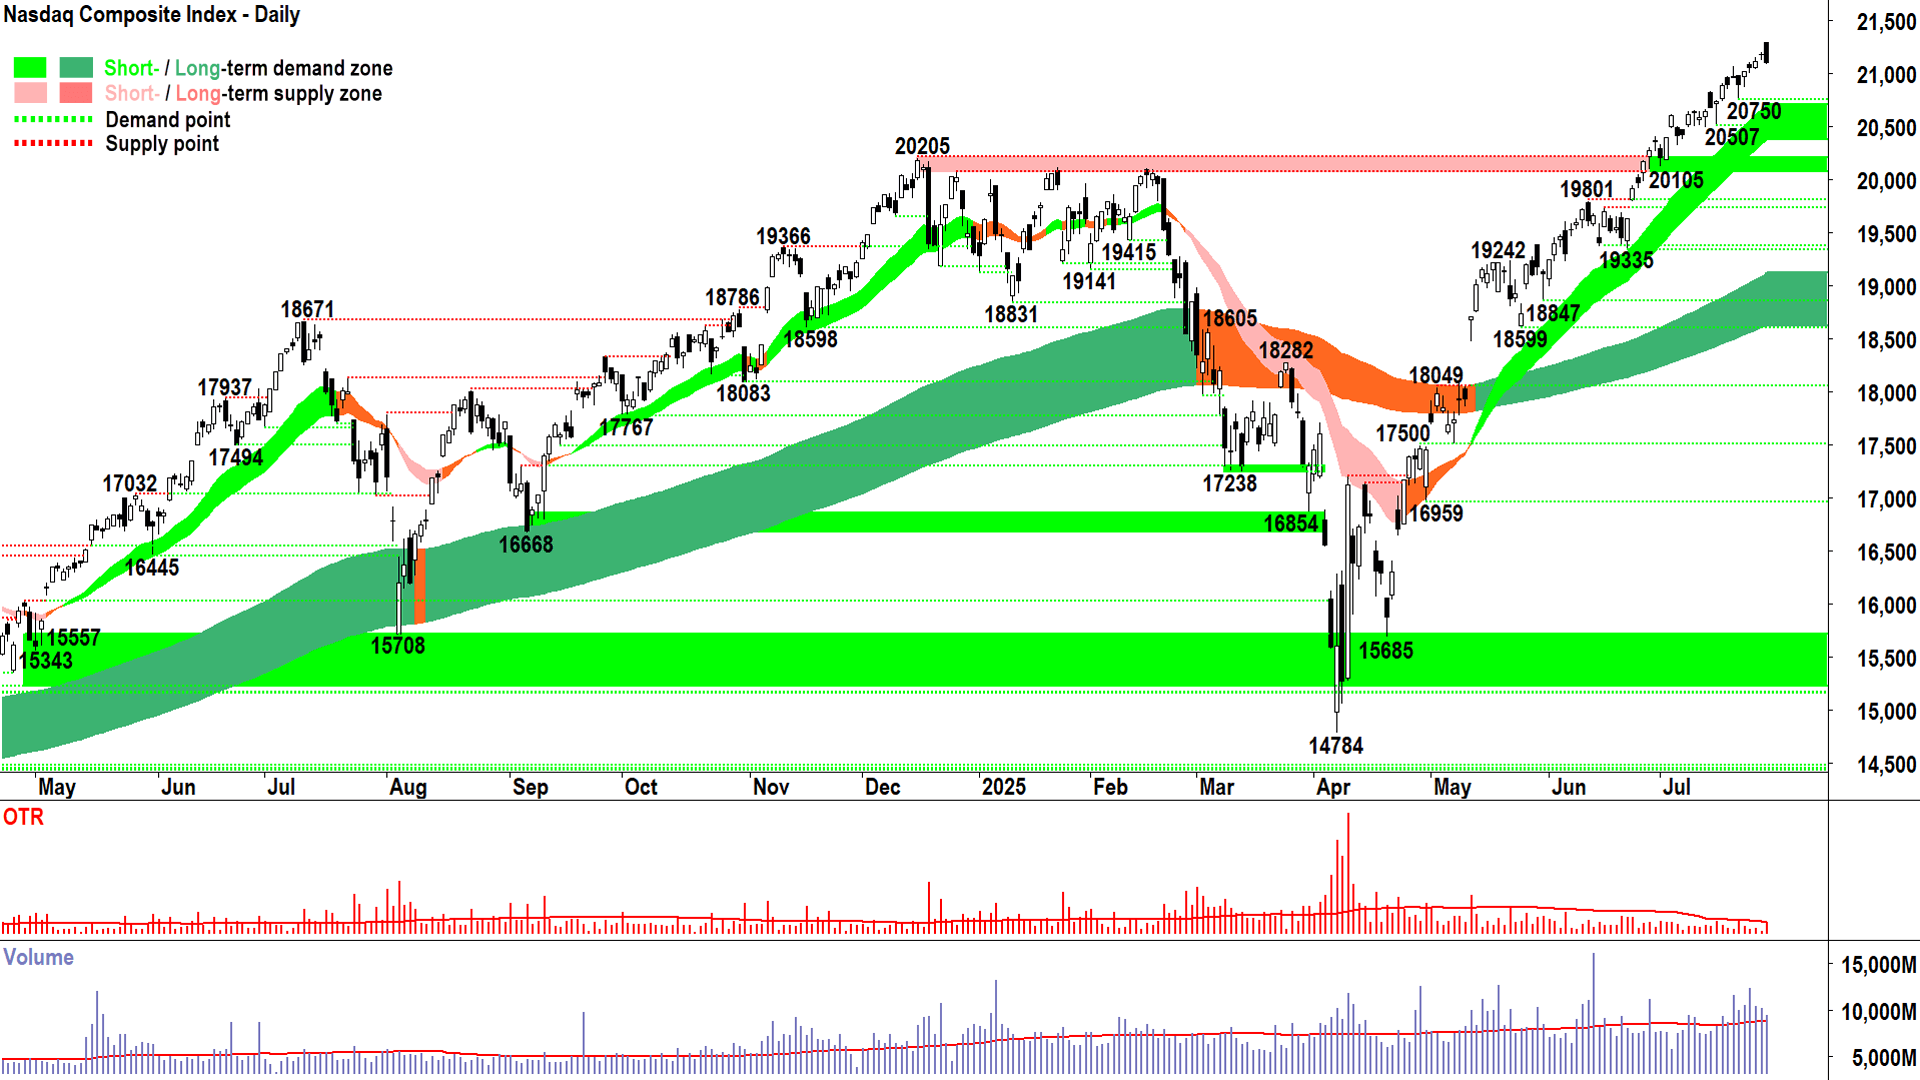
Okay, not quite the “steady as she goes…nothing to see here narrative” of the last couple of sessions – but I’m going to say not a reason to panic just yet!
Certainly, last night’s clear supply-side showing (full black candle completely engulfing the prior session’s range and the largest range in the last 5 candles) is a warning signal that we’ve finally found some credible supply on the Comp. However, one candle doesn’t constitute a reversal!
We’ll need some confirmation for that. So, another, similar supply-side candle tonight would definitely get my attention – i.e., a long full black, or (even more disturbing) a long upward shadow pushing back into last night's high.
What we don’t want to see is the supply-side feeding aggressively into higher prices (i.e., sell the rally).
What we do want to see is the demand-side buying aggressively into lower prices (i.e., buy the dip).
For the latter, that means candles with white bodies and or downward pointing shadows – the longer the better for demonstrating continued demand-side control.
In conclusion, I think if you’re adjusting your risk settings based solely on Tuesday’s candle you’re either very jittery, or you’re betting on the next candle and not the broader technicals…Which remain:
Strong short term uptrend + short term uptrend ribbon behaving as a zone of dynamic demand ✅
Strong long term uptrend + long term uptrend ribbon behaving as a zone of dynamic demand ✅
Price action = rising peaks and rising troughs = supply removal and demand reinforcement ✅
Despite Tuesday's showing, arguably a continuing predominance of demand-side candles ✅
20750 is the closest point of demand. We shouldn’t close below there if all is well with this trend. Until then, happy to stay the course on the Comp.
S&P/ASX 200 (XJO)
%20chart%2030%20Jul%202025.png)
A+! (click here for full size image)
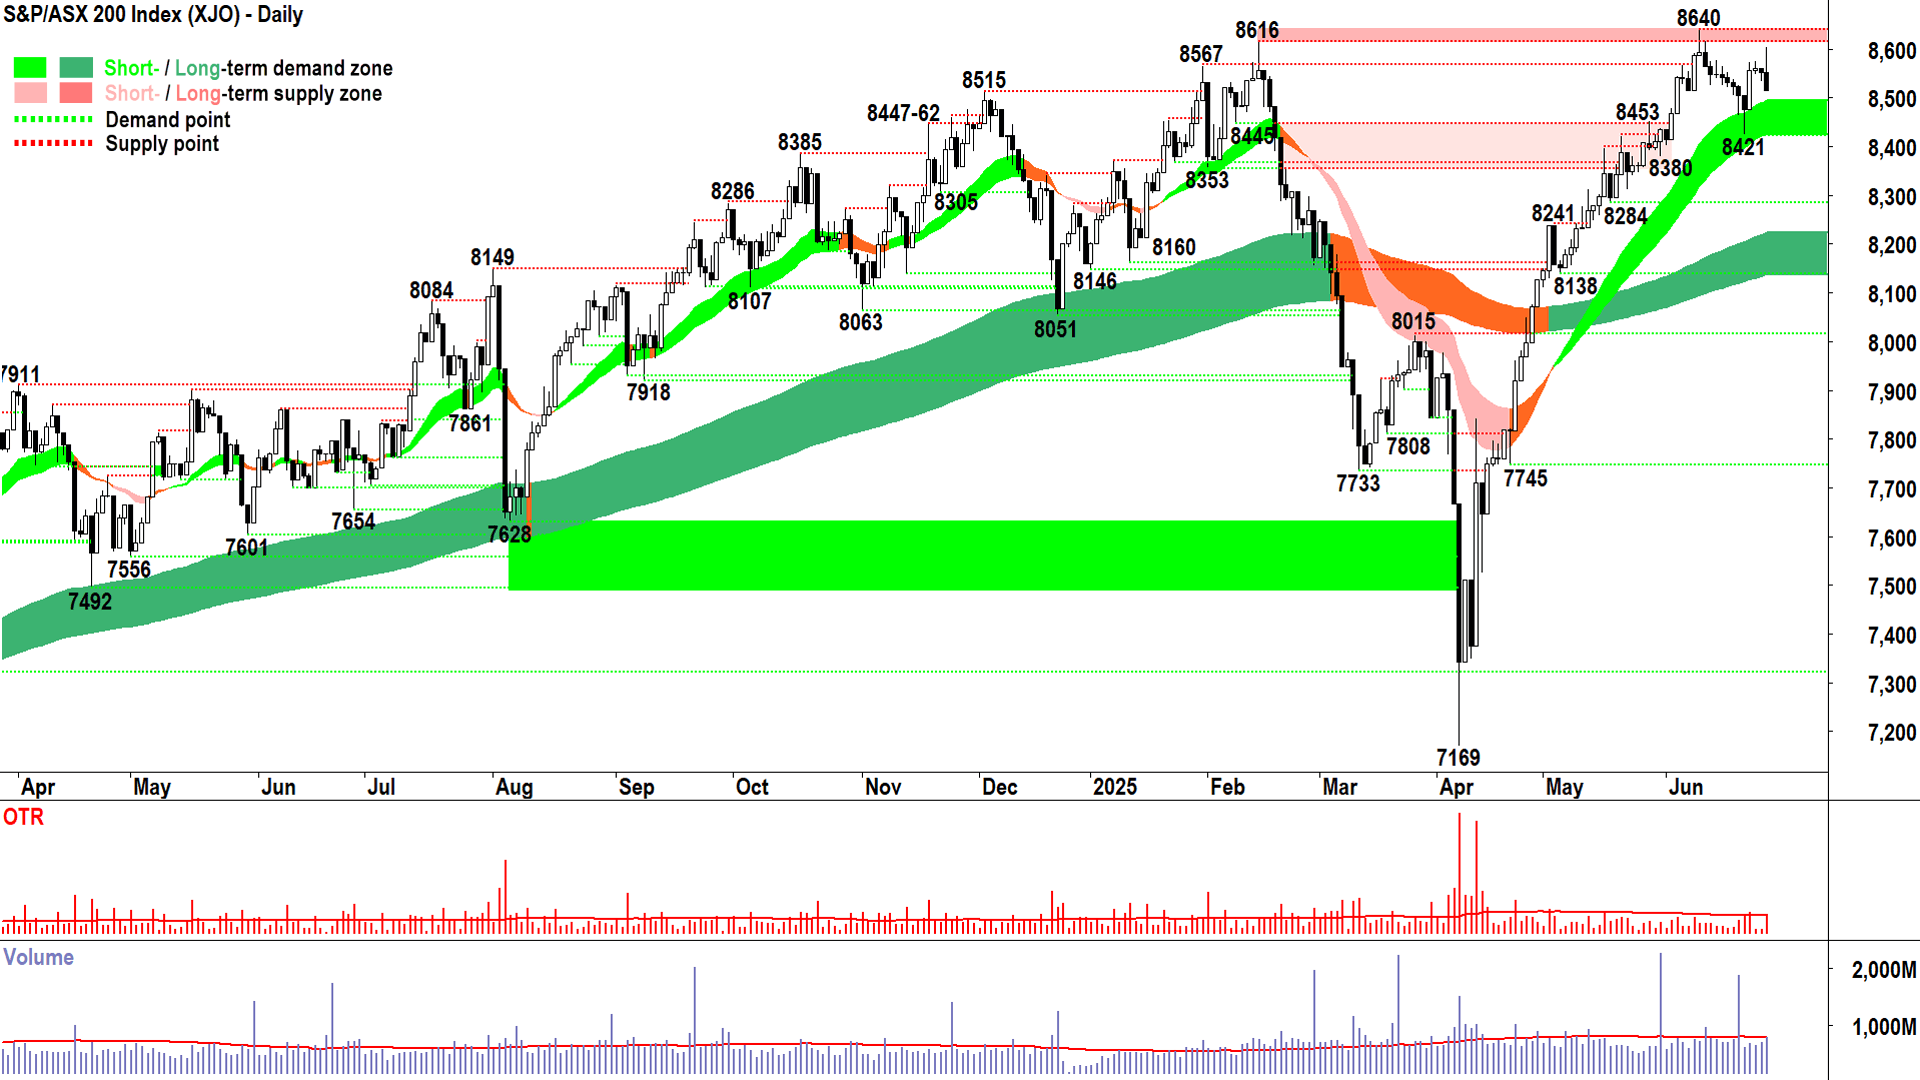
Full credit to the old Tin Pot today! I don’t even think I can even call it that after the stonking long white candle which it delivered in the face of the Comp’s malaise.
Is this the decoupling we’ve been waiting for? 🤔
I doubt it… we’re likely still one bad US trading session away from falling back into line! Oh well, let’s just enjoy it while we can! 🥳
If this was the chart of anything else, I’d be compelled to say it looks pretty darn good 😍. I’m going to do a copy and paste from the Comp’s criteria above – because that’s what we’re supposed to be doing as technical analysts – ticking the boxes!
Strong short term uptrend + short term uptrend ribbon behaving as a zone of dynamic demand ✅
Strong long term uptrend + long term uptrend ribbon behaving as a zone of dynamic demand ✅
Price action = rising peaks and rising troughs = supply removal and demand reinforcement ✅
A continuing predominance of demand-side candles ✅
There’s one change, on the candles, which I think we can all agree are sorted in the right direction after today’s strong demand-side showing.
Here’s the thing about trend following (and NEVER forget it!): A chart can look 100% demand-side control on one day, and anything else the next.
We can’t tell the future. We can only tell the balance between demand and supply right now. As a trend follower, you must at some point dispense with the desire to absolutely must know what’s going to happen next! Whatever will happen will happen! You can’t change it, so don’t worry about it!
Trend following (i.e., the good trend following I teach you) is about continuously putting one’s self on the right side of the trend because this means that more often than not (MOTN) we’re going to on the right side of the highest probability outcome.
Not certainty. Just MOTN.
Compare this to most other investors and traders who are transfixed by the monetary outcome of their actions… i.e., the profitability part. I say, forget about the profitability part and focus solely on the probability part.
Because in my experience, if you get the probability part of it right… the profitability part usually takes care of itself.
Uranium Futures (Front month, back-adjusted) COMEX
%20COMEX%20chart%2029%20Jul%202025.png)
Meltdown... (click here for full size image)
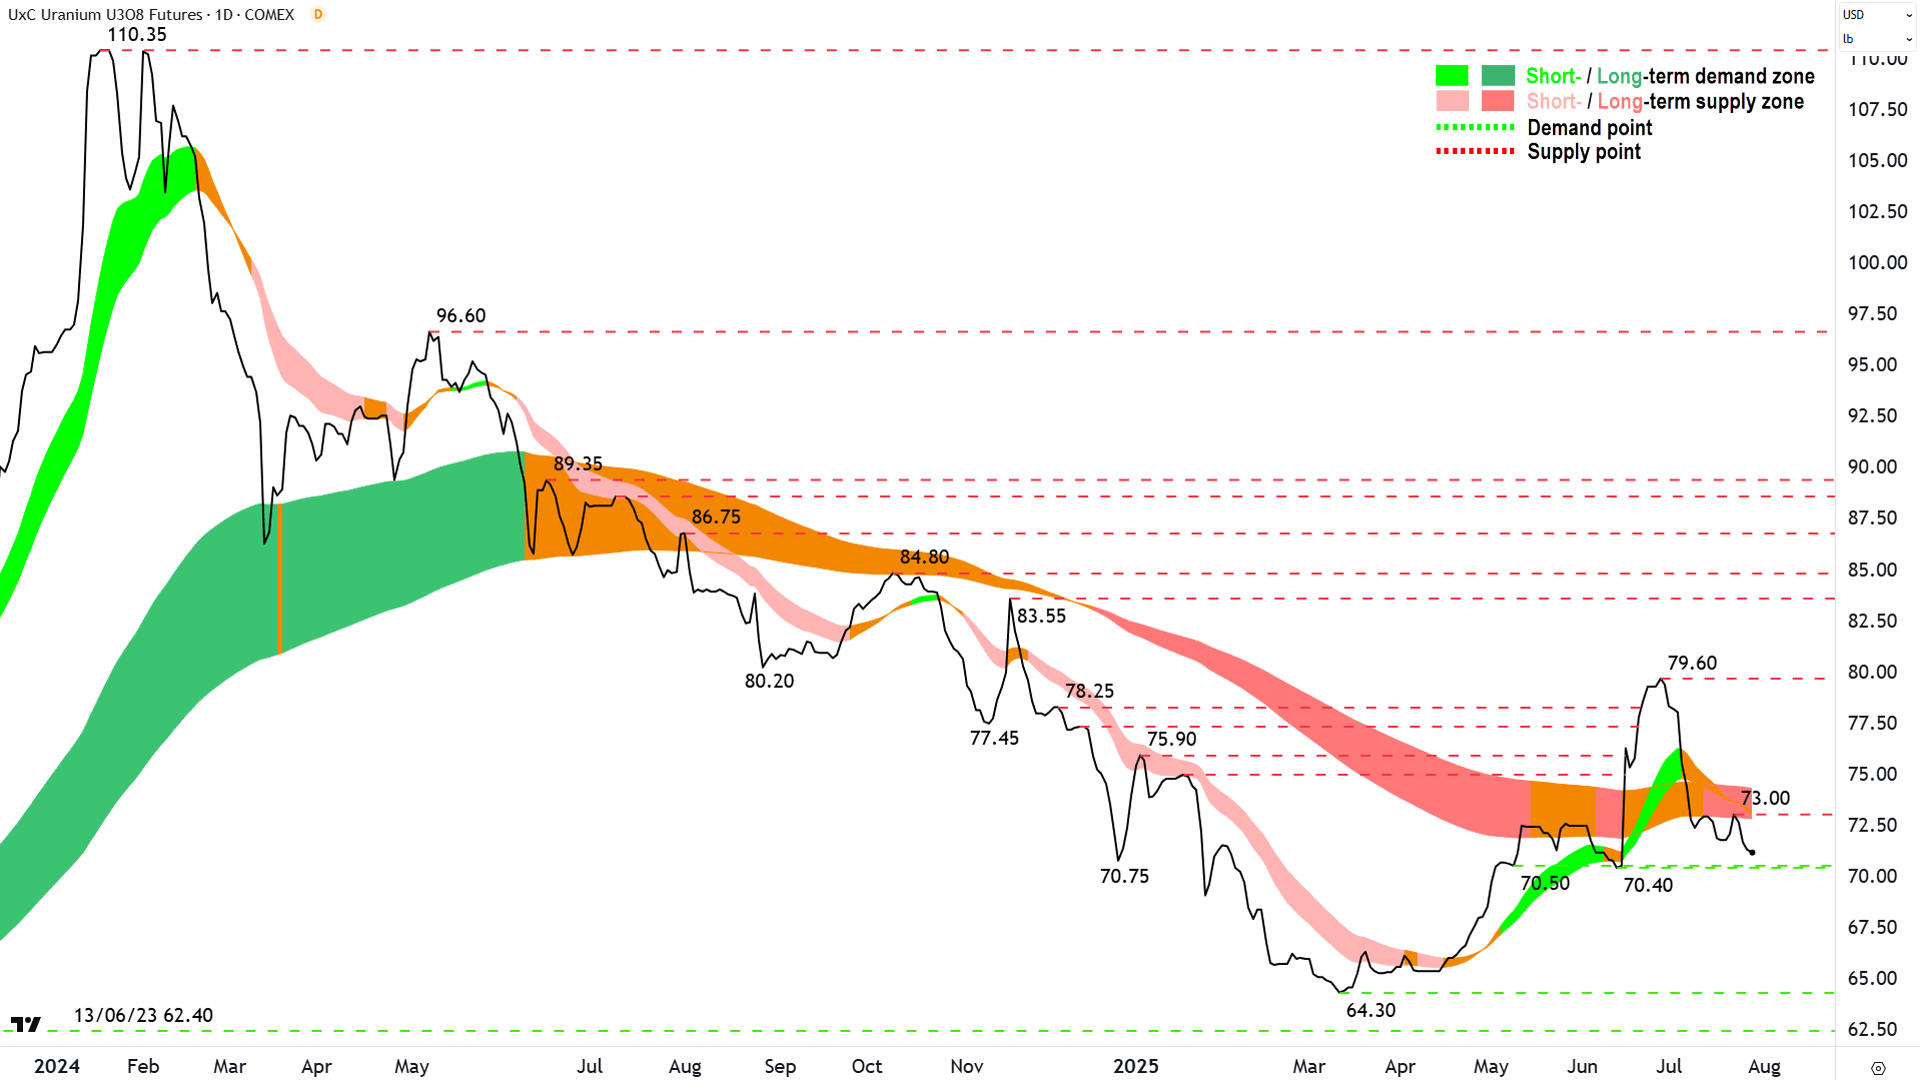
The last time we covered Uranium in ChartWatch in the Evening Wrap on 24 Jun, it was just about at the peak of its recent rally. More specifically, it was at the peak of a short term uptrend that was challenging the long term downtrend, causing the long term trend ribbon to neutralise after nearly 12 months bear market.
That neutralisation, along with a strong short term uptrend, plus demand-side price action (i.e., rising peaks and rising troughs), and the formation of a trough above the long term trend ribbon – led me to declare the commencement of a new long term uptrend.
That call is under some severe pressure (!!!) given subsequent proceedings! Such is the nature of trying to call the bottom of a bear market – it is hardly a case of prolonged prevailing demand-side control and more of trying to call the transition to it...
With the uranium price now back below the long term trend ribbon, with that trend ribbon back to down (dark pink), and with two troughs formed below the long term downtrend ribbon (demonstrating it is again acting as a zone of dynamic supply), I must conclude that uranium is again stuck in a bear market.
It’s not what I would describe as a strong bear just yet – the price action is largely sideways since May, and therefore one could argue we're in more of a state of equilibrium than anything else.
Moving forward, the point of demand at 70.40 is critical. It must hold if there’s to be any hope of a recovery back above the long term trend ribbon. If it goes, then it could be a slippery slope back to the 64.30 bear market lows.
In summary, my view is back to neutral at best here on uranium, but even that neutrality is hanging by a thread!
Economy
Today

Australian Consumer Price Index (CPI). Source: ABS and AMP Economics
AUS Consumer Price Index (CPI) June Quarter
Headline: +0.8% q/q and +2.1% p.a. vs +0.9% q/q and +2.1% p.a. in March
Trimmed Mean: +0.7% q/q forecast vs +0.7% p.a. in March
"Today’s inflation report has been widely touted as a “make or break” for the upcoming RBA decision in August, as the bank indicated that the direction for rates will be down from here, but they needed more confirmation that inflation can move sustainably back to the midpoint of the target. We believe that today’s trimmed mean reading of just 0.6%qoq/2.7%yoy likely met the RBA’s criteria for a rate cut. We continue to see four more rate cuts from here (Aug, Nov, Feb & May), taking the cash rate to 2.85% by 2Q26." – My Bui, AMP Economist
Later this week
Wednesday
22:30 USA Advance GDP June Quarter (+2.4% p.a. forecast vs -0.5% p.a. (revised down from -0.3% p.a.) in March)
Thursday
04:00 USA Federal Funds Rate & Statement (no change at 4.50% forecast)
04:30 USA Federal Reserve Chairman Jerome Powell Press Conference
11:30 AUS Retail Sales June (+0.4% m/m vs +0.2% m/m in May)
11:30 AUS Building Approvals June (+1.7% m/m vs +3.2% m/m in May)
11:30 CHN Purchasing Managers Index (PMI) July (+1.7% m/m vs +3.2% m/m in May)
Manufacturing: 49.7 forecast vs 49.7 in June
Non-manufacturing: 50.3 forecast vs 50.5 in June
Tentative JPN BOJ Policy Rate, Monetary Policy Statement & Press Conference (unchanged at <0.50% forecast)
22:30 USA Core PCE June
Price Index: +0.3% m/m vs +0.2% m/m in May
Personal Income: +0.2% m/m vs -0.4% m/m in May
Personal Spending: +0.4% m/m vs -0.1% m/m in May
Friday
00:00 USA Non-Farm Payrolls July
Employment Change: +108,000 forecast vs 147,000 in June
Average Hourly Earnings: +0.3% forecast vs +0.2% in June
Unemployment Rate: 4.2% forecast vs 4.1% in June
Saturday
00:00 USA ISM Manufacturing PMI (49.5 forecast vs 49.0 previous)
Latest News
Interesting Movers
Trading higher
+13.0% Viridis Mining and Minerals (VMM) – A$11.5m Placement Further Strengthens Balance Sheet to FID, rise is consistent with prevailing short term uptrend and long term trend is transitioning from down to up, a recent regular in ChartWatch ASX Scans Uptrends list 🔎📈
+7.9% MTM Critical Metals (MTM) – No news, rise is consistent with prevailing short and long term uptrends, a regular in ChartWatch ASX Scans Uptrends list 🔎📈
+7.8% Polynovo (PNV) – FY25 Trading Result.
+7.3% Ora Banda Mining (OBM) – Continued Exploration Success at Little Gem.
+7.1% Metro Mining (MMI) – No news, rise is consistent with prevailing short and long term uptrends, a regular in ChartWatch ASX Scans Uptrends list 🔎📈
+7.1% Green Critical Minerals (GCM) – GCM US Listing Scheduled for First Half 2026 and Results of General Meeting, rise is consistent with prevailing short and long term uptrends 🔎📈
+7.1% Droneshield (DRO) – July 2025 Investor Presentation and Quarterly Activities/Appendix 4C Cash Flow Report, rise is consistent with prevailing short and long term uptrends, a regular in ChartWatch ASX Scans Uptrends list 🔎📈
+6.3% Alkane Resources (ALK) – Quarterly Activities Report, rise is consistent with prevailing long term uptrend 🔎📈
+6.1% Greatland Gold (GGP) – No news, rebounded after yesterday's sharp sell-off due to June 2025 Quarter Presentation.
+5.4% Catalyst Metals (CYL) – No news 🤔.
+5.3% Platinum Asset Management (PTM) – No news, rise is consistent with prevailing short term uptrend and long term trend is transitioning from down to up 🔎📈
Trading lower
-12.8% Appen (APX) – June 2025 Quarterly Report, fall is consistent with prevailing short and long term downtrends, a regular in ChartWatch ASX Scans Downtrends list 🔎📉
-12.2% Vection Technologies (VR1) – Continued negative response to 29-Jul Vection Secures $7.2m Defence Order.
-9.4% Silex Systems (SLX) – No news, ongoing weakness in several uranium stocks today….
-8.6% Novonix (NVX) – No news, closed back below long term trend ribbon….
-7.7% Strike Energy (STX) – Quarterly Activities/Appendix 5B Cash Flow Report, fall is consistent with prevailing short and long term downtrends, a regular in ChartWatch ASX Scans Downtrends list 🔎📉
-7.2% IGO (IGO) – June 2025 Quarterly Presentation.
-6.3% Emerald Resources (EMR) – Quarterly Report, fall is consistent with prevailing short term downtrend and long term trend is transitioning from up to down 🔎📉
-6.1% Botanix Pharmaceuticals (BOT) – No news, fall is consistent with prevailing short and long term downtrends, a regular in ChartWatch ASX Scans Downtrends list 🔎📉
-4.8% Metals X (MLX) – No news since 29-Jul 2025 Renison Mineral Resource Update.
-4.5% Sayona Mining (SYA) – Quarterly Activities Report June 2025.
-4.3% The Star Entertainment Group (SGR) – Quarterly Activities/Appendix 4C Cash Flow Report, fall is consistent with prevailing short and long term downtrends, one of the most Featured (highest conviction) stocks in ChartWatch ASX Scans Downtrends list 🔎📉
Broker Moves
AIC Mines (A1M)
Retained at Buy at Shaw and Partners; Price Target: $0.70
The a2 Milk Company (A2M)
Retained at Equal-weight at Morgan Stanley; Price Target: $6.60 from $5.90
Aussie Broadband (ABB)
Retained at Buy at Citi; Price Target: $4.80
Adveritas (AV1)
Retained at Buy at Bell Potter; Price Target: $0.20 from $0.18
Antipa Minerals (AZY)
Retained at Buy at Shaw and Partners; Price Target: $0.86
Beforepay Group (B4P)
Retained at Buy at Shaw and Partners; Price Target: $3.00 from $2.15
BCI Minerals (BCI)
Retained at Speculative Buy at Canaccord Genuity; Price Target: $0.50 from $0.49
Biome Australia (BIO)
Retained at Buy at Bell Potter; Price Target: $0.95 from $0.84
Bannerman Energy (BMN)
Retained at Buy at Shaw and Partners; Price Target: $4.70
Boss Energy (BOE)
Retained at Buy at Bell Potter; Price Target: $2.90 from $4.65
Downgraded to Hold from Buy at Euroz Hartleys; Price Target: $2.80 from $5.10
Beach Energy (BPT)
Retained at Sell at Citi; Price Target: $1.15
Bathurst Resources (BRL)
Retained at Buy at Ord Minnett; Price Target: $0.94 from $1.10
Brambles (BXB)
Downgraded to Hold from Outperform at CLSA; Price Target: $24.30 from $22.30
Domino's Pizza Enterprises (DMP)
Retained at Equal-weight at Morgan Stanley; Price Target: $24.00
Endeavour Group (EDV)
Retained at Equal-weight at Morgan Stanley; Price Target: $4.60
FINEOS Corporation Holdings PLC (FCL)
Retained at Outperform at Macquarie; Price Target: $3.29 from $2.45
Fortescue (FMG)
Retained at Underperform at Macquarie; Price Target: $16.00 from $17.00
Retained at Overweight at Morgan Stanley; Price Target: $19.50 from $20.15
Greatland Resources (GGP)
Retained at Buy at Argonaut Securities; Price Target: $10.00
Retained at Neutral at Goldman Sachs; Price Target: $6.65 from $7.40
Retained at Overweight at Jarden; Price Target: $5.70 from $6.20
Retained at Outperform at Macquarie; Price Target: $7.20 from $8.40
GQG Partners Inc. (GQG)
Retained at Overweight at Morgan Stanley; Price Target: $3.04 from $3.07
Downgraded to Hold from Buy at Morgans; Price Target: $2.10 from $2.65
GWA Group (GWA)
Retained at Outperform at Macquarie; Price Target: $3.15 from $3.10
Guzman Y Gomez (GYG)
Retained at Overweight at Morgan Stanley; Price Target: $41.90
Harvey Norman Holdings (HVN)
Retained at Underweight at Morgan Stanley; Price Target: $4.80 from $4.00
IDP Education (IEL)
Retained at Equal-weight at Morgan Stanley; Price Target: $4.25
ikeGPS Group (IKE)
Retained at Buy at Bell Potter; Price Target: $1.14
Imdex (IMD)
Upgraded to Buy at Canaccord Genuity; Price Target: $3.18 from $3.04
JB Hi-Fi (JBH)
Retained at Underweight at Morgan Stanley; Price Target: $73.60
Liontown Resources (LTR)
Retained at Speculative Buy at Bell Potter; Price Target: $1.05 from $0.90
Retained at Hold at Canaccord Genuity; Price Target: $0.80 from $0.95
Retained at Sell at Goldman Sachs; Price Target: $0.47 from $0.48
Retained at Underweight at JPMorgan; Price Target: $0.30
Downgraded to Sell from Hold at Morgans; Price Target: $0.56 from $0.52
Magellan Financial Group (MFG)
Retained at Underweight at Morgan Stanley; Price Target: $7.40 from $6.30
Mineral Resources (MIN)
Retained at Neutral at Citi; Price Target: $20.00
Metals X (MLX)
Retained at Buy at Ord Minnett; Price Target: $0.80
Nuix (NXL)
Initiated at Neutral at Jarden; Price Target: $2.46
Ora Banda Mining (OBM)
Retained at Buy at Argonaut Securities; Price Target: $1.00
Retained at Buy at Canaccord Genuity; Price Target: $1.05 from $1.06
Retained at Speculative Buy at Canaccord Genuity; Price Target: $1.05
Retained at Buy at Euroz Hartleys; Price Target: $1.05
Pilbara Minerals (PLS)
Upgraded to Neutral from Sell at Citi; Price Target: $1.30 from $1.10
Polynovo (PNV)
Retained at Outperform at Macquarie; Price Target: $2.45 from $2.80
Perpetual (PPT)
Retained at Equal-weight at Morgan Stanley; Price Target: $20.40 from $19.00
PEXA Group (PXA)
Retained at Hold at Morgans; Price Target: $16.30 from $13.93
Qube Holdings (QUB)
Retained at Neutral at UBS; Price Target: $4.50 from $4.40
Ramelius Resources (RMS)
Retained at Buy at Argonaut Securities; Price Target: $3.60
Retained at Neutral at Goldman Sachs; Price Target: $2.60 from $2.70
Upgraded to Overweight from UNKNOWN at JPMorgan; Price Target: $3.00 from $2.90
Retained at Buy at Ord Minnett; Price Target: $3.15 from $3.10
Retained at Buy at Shaw and Partners; Price Target: $3.19 from $3.14
Resolute Mining (RSG)
Retained at Buy at Canaccord Genuity; Price Target: $1.80
Sandfire Resources (SFR)
Retained at Buy at Argonaut Securities; Price Target: $13.00 from $12.70
Retained at Buy at Canaccord Genuity; Price Target: $12.00
Retained at Neutral at Citi; Price Target: $12.20 from $11.50
Retained at Hold at Jefferies; Price Target: $12.00 from $10.75
Retained at Neutral at JPMorgan; Price Target: $11.30 from $10.80
Retained at Underweight at Morgan Stanley; Price Target: $8.35
Downgraded to Hold from Add at Morgans; Price Target: $11.40 from $11.60
Retained at Accumulate at Ord Minnett; Price Target: $11.95 from $11.75
Retained at Outperform at RBC Capital Markets; Price Target: $12.25 from $11.00
Sims (SGM)
Retained at Outperform at Macquarie; Price Target: $17.40 from $15.70
Sigma Healthcare (SIG)
Retained at Overweight at Morgan Stanley; Price Target: $3.30 from $3.45
Superloop (SLC)
Retained at Buy at Citi; Price Target: $3.55
Super Retail Group (SUL)
Retained at Underweight at Morgan Stanley; Price Target: $11.90 from $12.20
The Lottery Corporation (TLC)
Retained at Buy at UBS; Price Target: $6.20
Technology One (TNE)
Initiated at Overweight at Jarden; Price Target: $44.82
Tuas (TUA)
Retained at Buy at Citi; Price Target: $7.10
Treasury Wine Estates (TWE)
Retained at Neutral at Citi; Price Target: $8.50
Retained at Overweight at Morgan Stanley; Price Target: $10.75
Retained at Buy at UBS; Price Target: $10.00
Viva Energy Group (VEA)
Retained at Hold at Jefferies; Price Target: $2.00 from $1.50
Retained at Overweight at JPMorgan; Price Target: $2.30 from $2.40
Retained at Equal-weight at Morgan Stanley; Price Target: $2.16
Retained at Buy at Ord Minnett; Price Target: $3.40
Retained at Sector Perform at RBC Capital Markets; Price Target: $1.95 from $2.00
Retained at Buy at UBS; Price Target: $2.80 from $2.95
Woodside Energy Group (WDS)
Retained at Neutral at Citi; Price Target: $25.50
Wesfarmers (WES)
Retained at Underweight at Morgan Stanley; Price Target: $67.60 from $66.70
Whitehaven Coal (WHC)
Retained at Overweight at Morgan Stanley; Price Target: $7.80 from $7.00
Wisr (WZR)
Retained at Buy at Shaw and Partners; Price Target: $0.07 from $0.07
Scans
Top Gainers
Code | Company | Last | % Chg |
|---|---|---|---|
| CMB | Cambium Bio Ltd | $0.46 | +58.62% |
| BSA | BSA Ltd | $0.14 | +55.56% |
| IMI | Infinity Mining Ltd | $0.013 | +44.44% |
| MX1 | Micro-X Ltd | $0.086 | +38.71% |
| PIM | Pinnacle Minerals Ltd | $0.055 | +37.50% |
Top Fallers
Code | Company | Last | % Chg |
|---|---|---|---|
| SCP | Scalare Partners Holdings Ltd | $0.135 | -25.00% |
| RPG | Raptis Group Ltd | $0.165 | -19.51% |
| CDE | Codeifai Ltd | $0.021 | -19.23% |
| EQS | Equity Story Group Ltd | $0.023 | -17.86% |
| WWG | Wiseway Group Ltd | $0.15 | -16.67% |
52 Week Highs
Code | Company | Last | % Chg |
|---|---|---|---|
| ATS | Australis Oil & Gas Ltd | $0.011 | +22.22% |
| DVL | Dorsavi Ltd | $0.029 | +20.83% |
| KZR | Kalamazoo Resources Ltd | $0.105 | +16.67% |
| VMM | Viridis Mining and Minerals Ltd | $1.13 | +13.00% |
| CUF | Cufe Ltd | $0.011 | +10.00% |
52 Week Lows
Code | Company | Last | % Chg |
|---|---|---|---|
| STH | Stepchange Holdings Ltd | $0.155 | -13.89% |
| CGR | CGN Resources Ltd | $0.055 | -8.33% |
| STX | Strike Energy Ltd | $0.12 | -7.69% |
| TRU | Truscreen Group Ltd | $0.015 | -6.25% |
| L1M | Lightning Minerals Ltd | $0.039 | -2.50% |
Near Highs
Code | Company | Last | % Chg |
|---|---|---|---|
| WVOL | Ishares MSCI World Ex Aust Minimum Volatility ETF | $43.57 | +0.53% |
| IPX | Iperionx Ltd | $6.25 | 0.00% |
| GCI | Gryphon Capital Income Trust | $2.07 | 0.00% |
| IHD | Ishares S&P/ASX DIV Opportunities Esg Screened ETF | $15.33 | +0.66% |
| MGX | Mount Gibson Iron Ltd | $0.385 | +1.32% |
Relative Strength Index (RSI) Oversold
Code | Company | Last | % Chg |
|---|---|---|---|
| BOE | Boss Energy Ltd | $1.865 | +3.61% |
| SHV | Select Harvests Ltd | $3.41 | 0.00% |
| LSGE | Loomis Sayles Global Equity Fund - Active ETF | $2.38 | -0.83% |
| BAP | Bapcor Ltd | $3.83 | +0.79% |
| IMU | Imugene Ltd | $0.28 | 0.00% |
