News | Market Wraps
Evening Wrap: ASX 200 relief rally powered by big miners, banks, but Mid-East peace prospects sink WDS and STO
The S&P/ASX 200 closed 80.6 points higher, up 0.95%.

Mentioned
The S&P/ASX 200 closed 80.6 points higher, up 0.95%.
A strong rebound in Materials (XMJ) (+2.0%) companies helped the ASX 200 to a solid “relief rally” today. Resources stocks had been sold off viciously over the last couple of weeks as tensions in the Middle East escalated. However, with potentially positive developments in the last 24-hours (hmm…ceasefire or no ceasefire…it depends who you ask!?) they’ve finally managed to catch a bid.
Today’s strong gain on the benchmark was bolstered, as it has been for some time now, by also improving Financials (XFJ) (+1.9%) stocks. The combination of Materials and Resources stocks rising in unison? Well that’s just a prospect that’s too tantalising for us to consider! 🙏
To make sense of all the above, I have detailed technical analysis on the Nasdaq Composite, S&P/ASX 200, and Uranium in today's ChartWatch.
Be sure to click/scroll through for the usual reporting of the major sector and stock-specific moves, the broker responses to them, as well as all the key economic data in tonight's Evening Wrap.
Let's dive in!
Today in Review
Tue 24 Jun 25, 4:50pm (AEST)
Name | Value | % Chg |
|---|---|---|
Major Indices | ||
| ASX 200 | 8,555.5 | +0.95% |
| All Ords | 8,774.8 | +1.00% |
| Small Ords | 3,215.3 | +0.77% |
| All Tech | 4,024.3 | +1.18% |
| Emerging Companies | 2,229.2 | +0.84% |
Currency | ||
| AUD/USD | 0.6507 | +0.73% |
US Futures | ||
| S&P 500 | 6,077.5 | +0.99% |
| Dow Jones | 42,914.0 | +0.03% |
| Nasdaq | 22,072.25 | +1.04% |
Name | Value | % Chg |
|---|---|---|
Sector | ||
| Materials | 15,802.0 | +1.98% |
| Financials | 9,523.3 | +1.89% |
| Information Technology | 2,954.0 | +1.09% |
| Consumer Discretionary | 4,105.2 | +0.69% |
| Health Care | 41,608.9 | +0.30% |
| Consumer Staples | 12,291.5 | +0.15% |
| Industrials | 8,349.9 | +0.11% |
| Real Estate | 3,977.6 | +0.09% |
| Communication Services | 1,845.5 | -0.02% |
| Utilities | 9,250.9 | -1.99% |
| Energy | 8,741.2 | -3.89% |
Markets
%20intraday%20chart%2024%20Jun%202025.png)
ASX 200 Session Chart
The S&P/ASX 200 (XJO) finished 80.6 points higher at 8,555.5, 0.95% from its session low and just 0.22% from its low. In the broader-based S&P/ASX 300 (XKO) advancers beat decliners by a resounding 197 to 80.
BHP Group (BHP) (+2.4%), Rio Tinto (RIO) (+3.0%), Fortescue (FMG) (+4.7%). Solid 👍👍. The Materials (XMJ) (+2.0%) sector rebounded on hope and relief that tensions in the Middle East have reached a never to be exceeded zenith (yes, as tragically ridiculous as that sentence seems when you say it out loud!).
That's a headline / great development for the Aussie stock market in itself, particularly as we pointed out here just a few days ago that after the Energy (XEJ) (-3.9%) sector's bounce, the XMJ was growing increasingly isolated as the worst looking major ASX sector index on a technical basis.
%20chart%2024%20Jun%202025.png)
ASX 200 Materials Sector Index (XMJ)
But, when you add in the fact that Financials (XFJ) (+1.9%) also logged another strong gain today, led by the likes of invincible but hated by fund managers Commonwealth Bank of Australia (CBA) (+2.0%), it was always going to be a stonking good day for the Aussie stock market. I note the other big banks, also much maligned by the mainstream funds management industry, also had very good days today also (Westpac Banking Corp. (WBC) (+2.6%) and National Australia Bank (NAB) (+2.2%))
The prospect of mining and banking stocks, when you consider the 6 stocks I've mentioned above account for nearly half of the entire ASX market capitalisation – is a tantalising prospect indeed! My tip is that it will need to remain this way if we are to set a new high any time soon.
As can be seen by the XEJ's near-4% decline today, it wasn't all tears of joy for local investors. There were plenty of the other kind of tears in the likes of Woodside Energy (WDS) (-6.5%), Karoon Energy (KAR) (-6.5%) and Co. I note that takeover target Santos (STO) (-1.5%) was largely spared the rod. Gold (XGD) (-0.04%) and defence related stocks also generally struggled today.
The only other curious little slice of the market that made a coordinated and notable move today was lithium. Possibly buoyed by the general strength in mining stocks, possibly also due to the +2.7% gain in GFEX lithium carbonate futures, but very probably also on the back of Pilbara Minerals (PLS) (+6.6%) CEO Dale Henderson's purchase of another $1 million of the company's stock on market. If any segment of the ASX needs a break, it's lithium!
Blue chip winners today:
Company | Last Price | Change $ | Change % | 1mo % | 1yr % |
|---|---|---|---|---|---|
Pilbara Minerals (PLS) | $1.285 | +$0.08 | +6.6% | -6.9% | -59.8% |
Mineral Resources (MIN) | $21.46 | +$0.98 | +4.8% | -10.1% | -64.2% |
Fortescue (FMG) | $15.23 | +$0.69 | +4.7% | -1.8% | -30.5% |
Hub24 (HUB) | $85.58 | +$3.7 | +4.5% | +6.6% | +90.2% |
Downer EDI (DOW) | $6.31 | +$0.27 | +4.5% | +2.9% | +34.5% |
IGO (IGO) | $4.04 | +$0.17 | +4.4% | -4.0% | -31.1% |
Flight Centre Travel (FLT) | $12.52 | +$0.4 | +3.3% | -4.4% | -36.9% |
Metcash (MTS) | $3.92 | +$0.12 | +3.2% | +16.0% | +2.1% |
Rio Tinto (RIO) | $104.94 | +$3.11 | +3.1% | -10.3% | -12.3% |
Nextdc (NXT) | $14.49 | +$0.42 | +3.0% | +10.5% | -17.8% |
James Hardie (JHX) | $37.89 | +$1.04 | +2.8% | +3.8% | -20.1% |
Westpac Banking Corp (WBC) | $34.29 | +$0.87 | +2.6% | +9.4% | +25.8% |
Pro Medicus (PME) | $279.34 | +$7.03 | +2.6% | +1.8% | +104.7% |
IDP Education (IEL) | $3.61 | +$0.09 | +2.6% | -56.7% | -75.6% |
South32 (S32) | $2.92 | +$0.07 | +2.5% | -3.6% | -21.1% |
Wisetech Global (WTC) | $108.74 | +$2.6 | +2.5% | +8.7% | +17.8% |
Macquarie Group (MQG) | $214.50 | +$5.07 | +2.4% | +4.0% | +9.2% |
Qantas Airways (QAN) | $10.32 | +$0.24 | +2.4% | +0.9% | +70.6% |
BHP Group (BHP) | $36.48 | +$0.84 | +2.4% | -4.9% | -14.7% |
National Australia Bank (NAB) | $39.75 | +$0.87 | +2.2% | +5.4% | +9.8% |
Blue chip losers today:
Company | Last Price | Change $ | Change % | 1mo % | 1yr % |
|---|---|---|---|---|---|
Woodside Energy Group (WDS) | $24.16 | -$1.69 | -6.5% | +12.0% | -11.3% |
Viva Energy Group (VEA) | $2.09 | -$0.07 | -3.2% | +9.7% | -34.3% |
Atlas Arteria (ALX) | $5.21 | -$0.16 | -3.0% | -1.0% | +4.2% |
Origin Energy (ORG) | $10.72 | -$0.27 | -2.5% | -3.0% | +2.9% |
Worley (WOR) | $13.07 | -$0.32 | -2.4% | +1.3% | -7.7% |
Ampol (ALD) | $25.34 | -$0.53 | -2.0% | -0.6% | -23.4% |
APA Group (APA) | $8.52 | -$0.15 | -1.7% | +4.8% | +1.7% |
Santos (STO) | $7.66 | -$0.12 | -1.5% | +19.3% | +2.7% |
The A2 Milk Company (A2M) | $7.83 | -$0.12 | -1.5% | -4.7% | +18.8% |
Fisher & Paykel Healthcare Corporation (FPH) | $33.42 | -$0.5 | -1.5% | +0.1% | +17.3% |
The Lottery Corporation (TLC) | $5.19 | -$0.06 | -1.1% | -3.0% | -0.1% |
Transurban Group (TCL) | $14.25 | -$0.16 | -1.1% | +0.4% | +13.2% |
AGL Energy (AGL) | $9.87 | -$0.1 | -1.0% | -3.6% | -5.6% |
Treasury Wine Estates (TWE) | $8.00 | -$0.07 | -0.9% | -4.4% | -35.6% |
Vicinity Centres (VCX) | $2.48 | -$0.02 | -0.8% | +2.9% | +31.9% |
ChartWatch
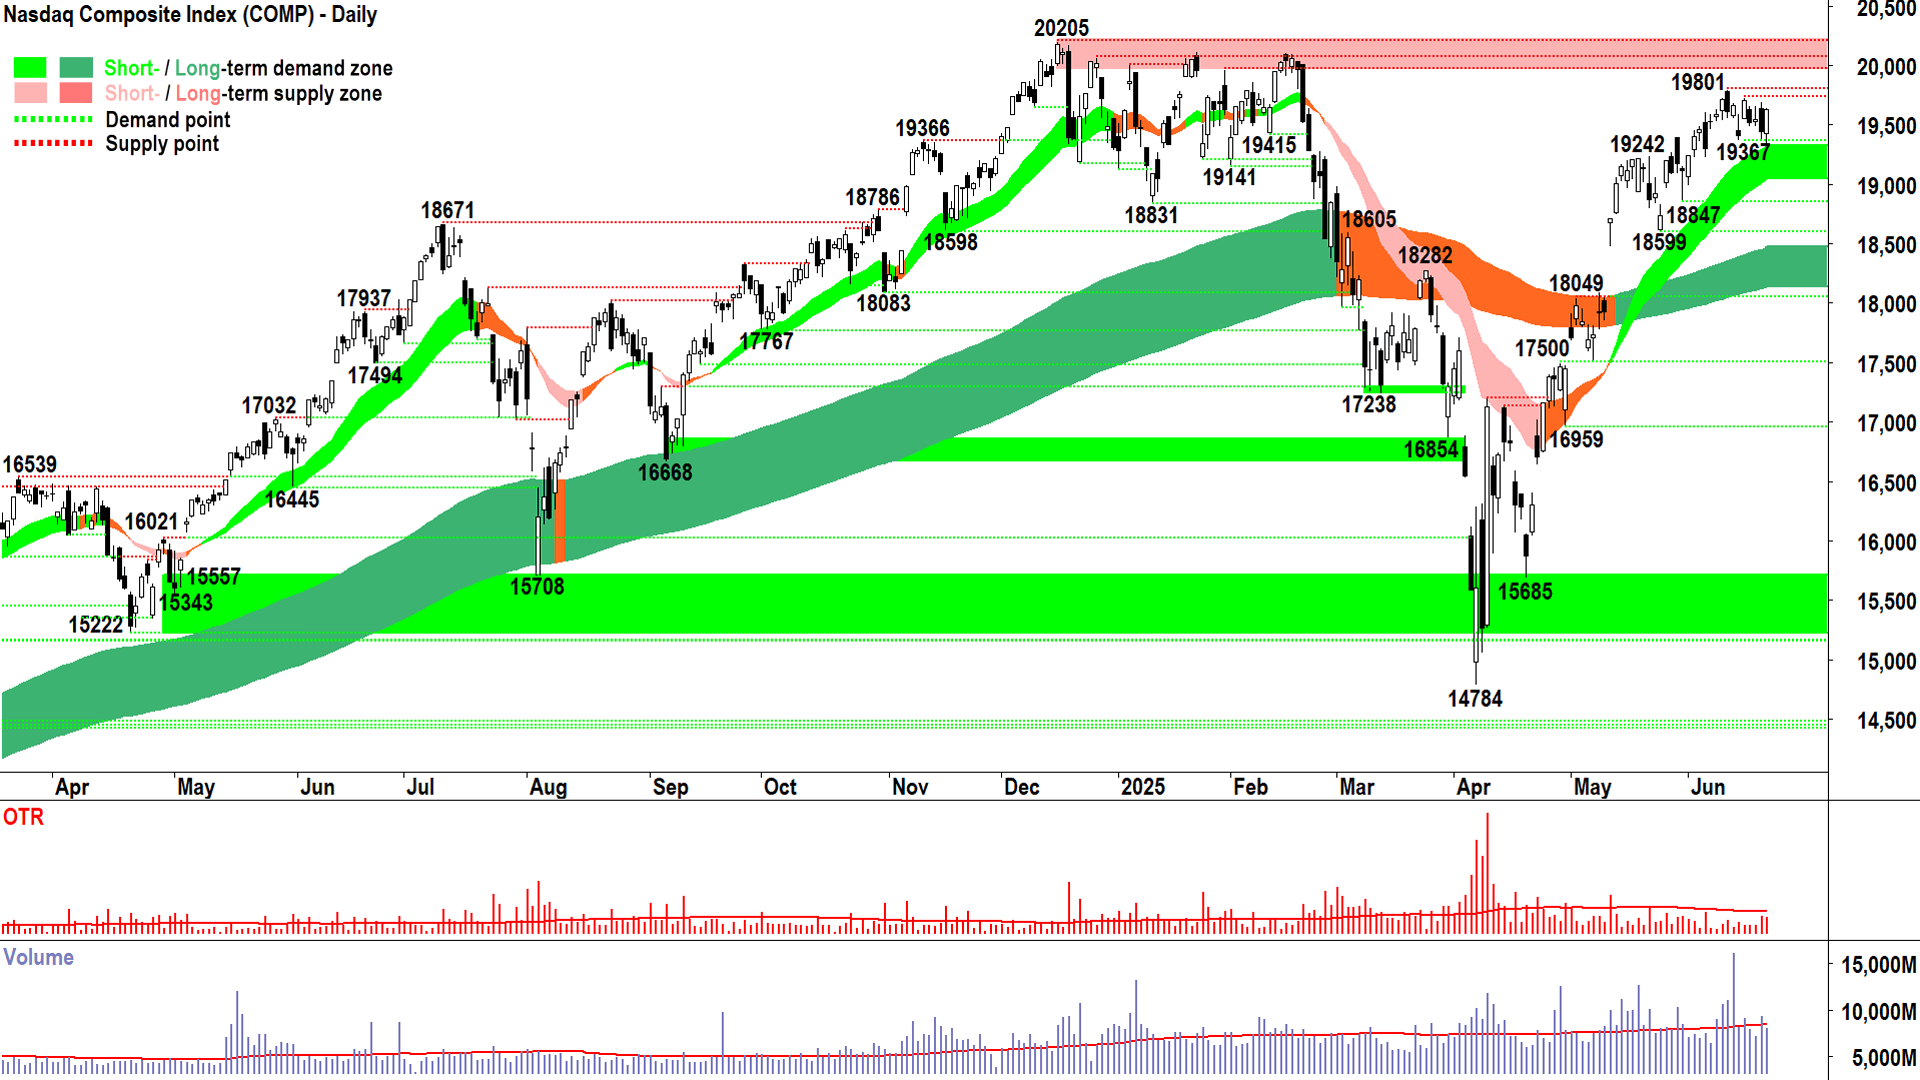
NASDAQ Composite Index

Zebra stripes 🦓! (click here for full size image)
Zebra stripes 🦓.
Supply or demand-side candle of magnitude X on one day. Then the opposite candle the next day. Repeat ⬜⬛⬜⬛!
= The toughest environment to call for my style of technical analysis which is trend following – i.e. the opposite of zebra stripes! But, as we noted in yesterday's update, sideways / equilibrium is a trend as well, and just as important one as up or down.
Nothing goes up or down in a straight line (i.e., D > S or S > D), you are always going to have periods where the market must digest a strong recent move (i.e., D > S but then S⬆️ enough so that D = S; or S > D but then D⬆️ so that S = D). Where my Comp calls have been spot on, is that I did propose a likely period of equilibrium several candles ago.
On a positive note, in my experience, the price tends to break in the direction of the trend it was travelling in prior to the equilibrium phase. How often? Let's go with more often than not “MOTN”.
For the Comp, this means MOTN corresponds to up. Monday’s candle certainly demonstrates there remains plenty of motivated demand around given the right circumstances. The issue is that Friday’s candle demonstrates there’s also plenty of supply around given the right circumstances, also.
And ladies and gentlemen, that is the nature of equilibrium ⚖️. To break the equilibrium, we must see:
Break up / in line with prevailing short and long term uptrends
Strong demand-side showing (i.e., long white-bodied candle and or long downward pointing shadow – indicating buy the dip activity), or a couple/few smaller ones in a cluster (i.e., back to a predominance of demand-side candles)
Preferably a higher trough (Monday’s candle’s low pipped 19367, so technically the next trough when it forms will be lower).
A close above 19801, but obviously, the big elephant in the room is 20205
Break down / into a new short term downtrend
Strong supply-side showing (i.e., long black-bodied candle and or long upward pointing shadow – indicating sell the rally activity), or a couple/few smaller one in a cluster (i.e., starting a predominance of supply-side candles)
A lower peak to 19801 (indicating building supply, we already have lower troughs = demand removal)
A close below the short term uptrend ribbon (currently around 19040)
That’s the lay of the land. My bet is always with MOTN because that's where the probability lies - and if you get the probability right then the profitability will take care of itself.
I see nothing in the Comp technicals that concerns be all that much, and therefore I remain happy to stay the course here (i.e., FRP as per the definition in the first 20 mins of this!)
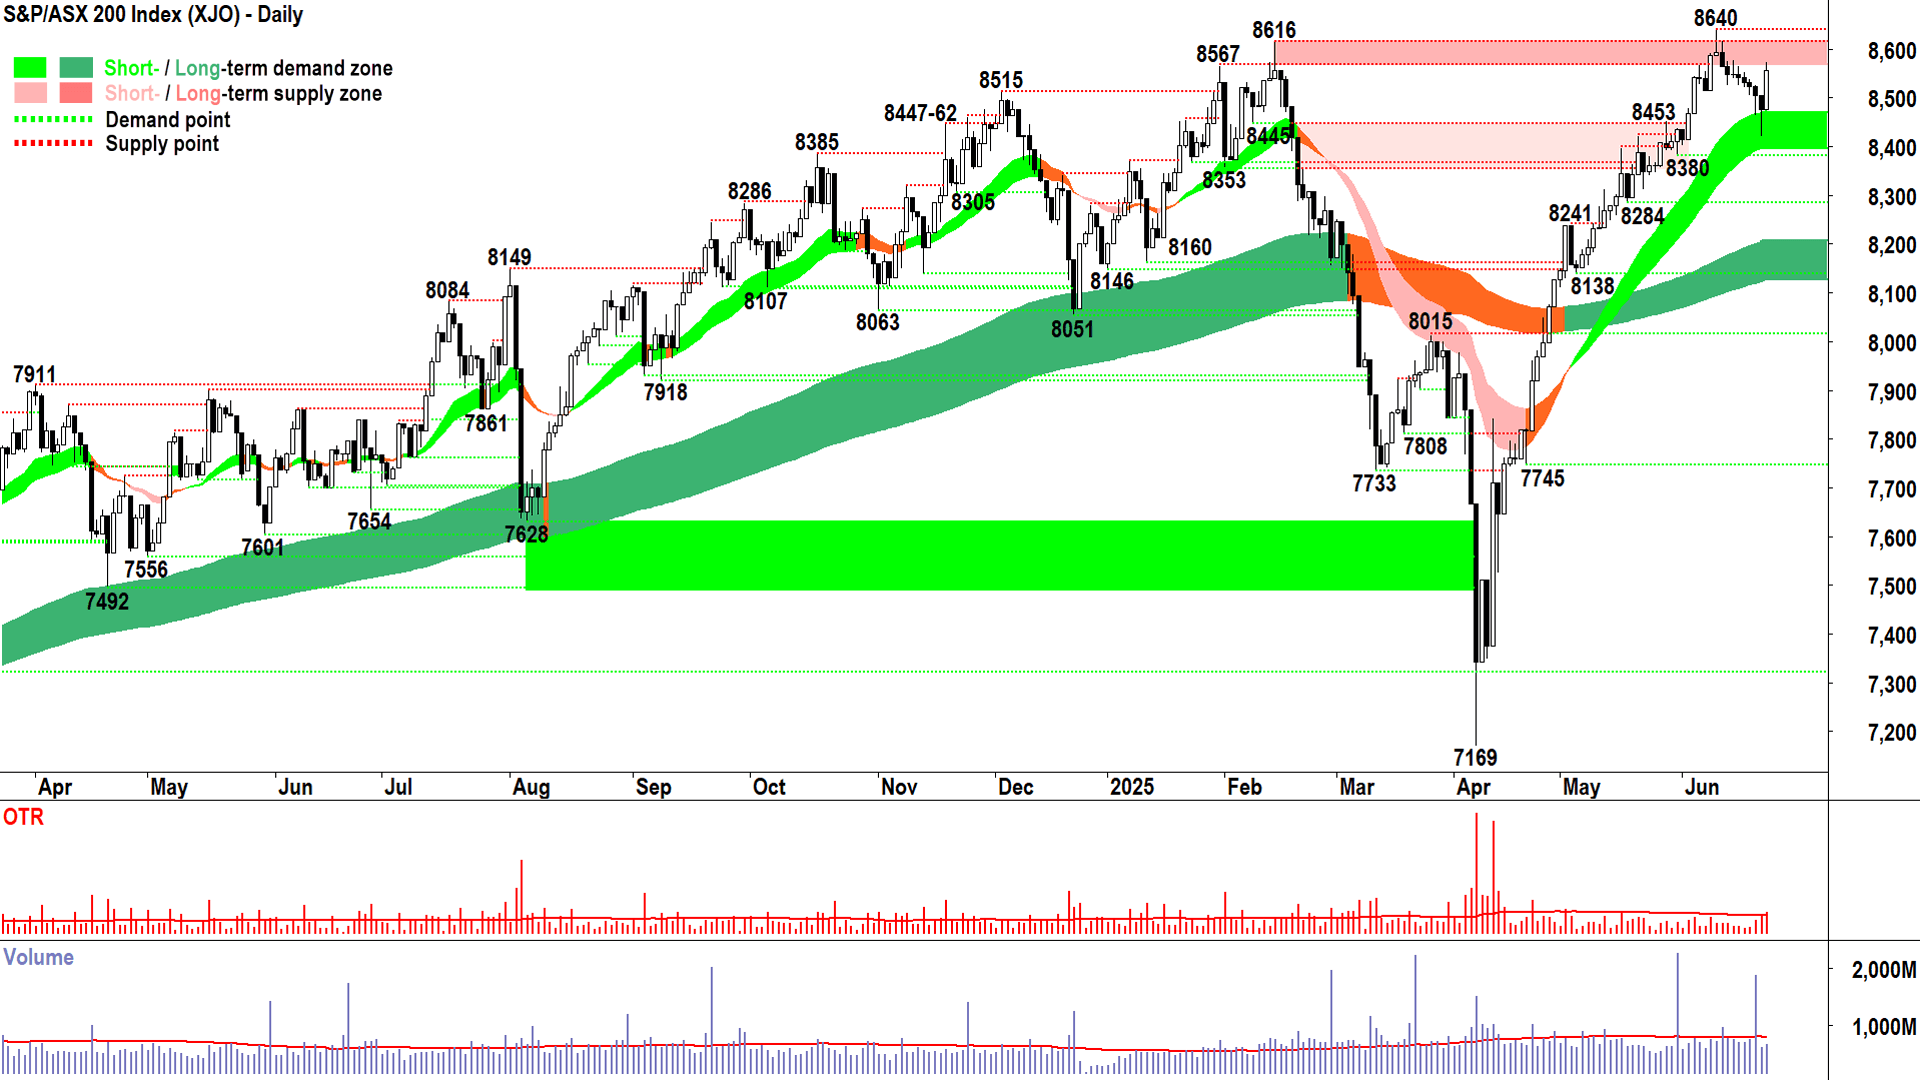
S&P/ASX 200 (XJO)
%20chart%2024%20Jun%202025.png)
A little bit like clockwork huh ⏰? (click here for full size image)
A little bit like clockwork huh ⏰? Hopefully some of the crazy ramblings you’ve suffered reading through here are starting to pay off.
Long downward pointing shadow equals buy the dip, equals evidence of excess demand in the system (if I had a dollar for every time in ChartWatch I’ve written downward pointing shadow!).
Today’s candle should therefore really be no surprise as a follow up to yesterday's long downward pointing shadow. I agree, it could have closed a little better, though 🤏.
Still, again, none of you are probably very surprised there’s still some sneaking supply lurking around to “knock out a few shares” after a market rally like today's. Such is the prevailing uncertainty driving present market conditions.
The other thing I’ll note here is just how spot-on the short term uptrend ribbon was in defining an area where latent excess demand would likely manifest itself.
But, whilst it worked this time, it's just as much a coincidence as any other time it’s ever worked. Never be so arrogant as a technical analyst that you start to believe you can predict what is going to happen next 🚫.
The outcome is always unknown. Anything can happen. If you get one right – coincidence! Same as if you get it wrong – coincidence!
Accept the outcome either way, do your analysis, manage your risk meticulously, and move onto the next call.
And my next call here is deeply grounded in MOTN – as in MOTN – with the current set of technicals:
Short and long term uptrends
Short and long term uptrend ribbons acting as zones of dynamic demand
Price action decent enough (hey, there’s a lower trough, but overall the going up segments remain larger than the pulling back segments)
A predominance of demand-side candles (I propose today’s candle tips us back in this direction)
...It's most likely that the demand-side is in control of the XJO price, and therefore we can skew our allocation of risk to the long-side.
The other fantastic aspect of todays candle is the major point of demand it formed at yesterday’s low of 8421. In the context of maintaining the current short term uptrend, and given it’s proximity to the bottom of the short term trend ribbon – we have the most terrific and clear-cut delineator between short term uptrend and short term downtrend.
Sure 8640 is the big game now, i.e., the critical overhead point of supply – but as long as the XJO continues to close above 8421 – there’s every chance the demand-side is in control and that the short term uptrend is intact. Stay the course, FRP.
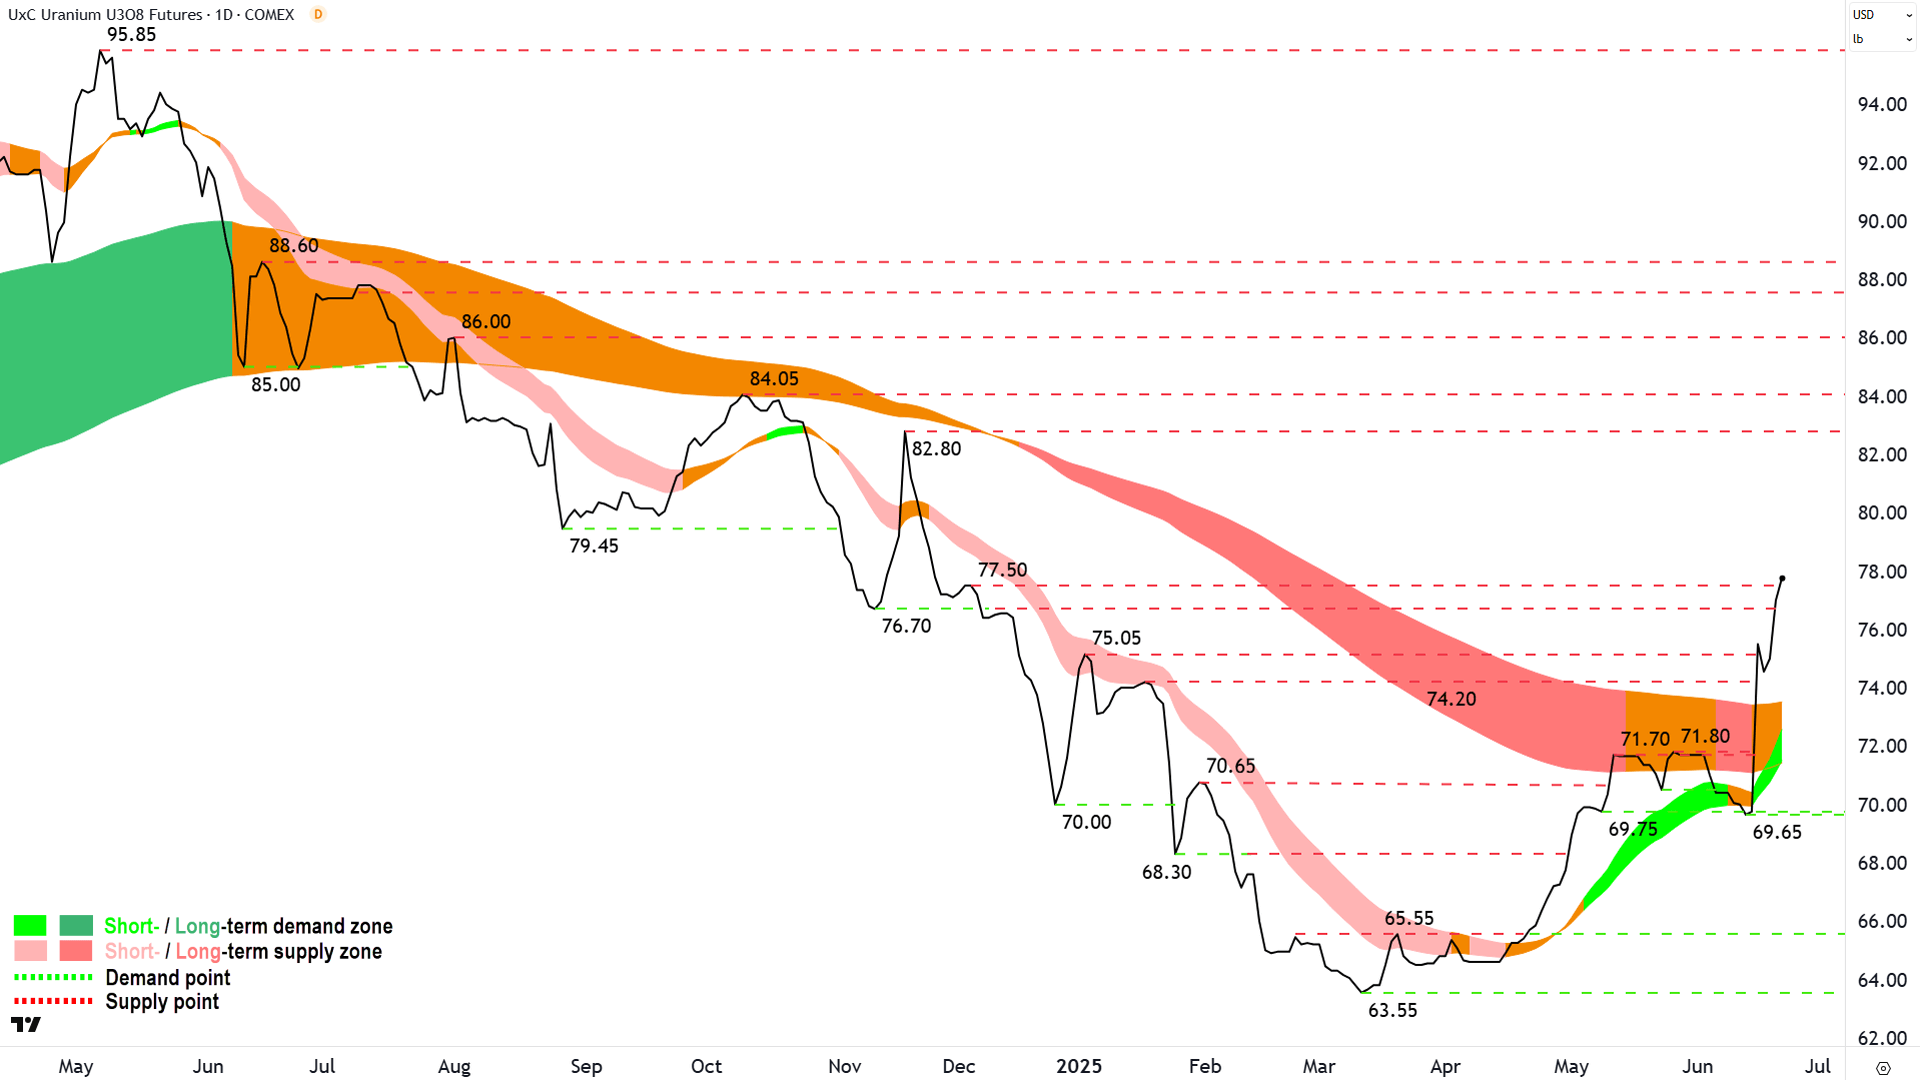
Uranium Futures (Front month, back-adjusted) COMEX
%20COMEX%20chart%2023%20Jun%202025.png)
Everything is pretty much going to analysis here…🧐 (click here for full size image)
The last time we covered uranium was in ChartWatch in the Evening Wrap on 19-Jun.
In that update, I bookended my bear market call on 1 August 2024 with a new bull market call. This is just a quick update to confirm that price action continues to track in line with short term (and growing long term) demand side control.
It’s additionally reassuring to see points of supply at 76.70 and 77.50 consumed as well as strong (steep) price action of rising peaks and rising troughs.
In short, everything is pretty much going to analysis here…
Demand is the confluence of the short and long term trend ribbons. As long as uranium closes above that zone, the fledgling bull market is intact.
The next point of supply is 82.80.
Economy
Today
There weren't any major data releases in our time zone today
Later this week
Wednesday
00:00 USA Federal Reserve Chairman Jerome Powell Semiannual Monetary Policy Report before the House Financial Services Committee
11:30 AUS CPI May (+2.4% p.a. forecast, unchanged from April)
Thursday
22:30 USA Final GDP March (-0.2% p.a. forecast vs +2.4% p.a. in December)
22:30 USA Core Durable Goods Orders May (+0.1% m/m forecast vs +0.2% m/m in April)
Friday
22:30 USA Core Personal Consumption Expenditures (PCE) May
Price Index: +0.1% m/m forecast vs +0.1% m/m in April
Personal Income: +0.2% m/m forecast vs +0.8% m/m in April
Personal Spending: +0.2% m/m forecast vs +0.2% m/m in April
Latest News
Interesting Movers
Trading higher
+17.4% Collins Foods (CKF) – FY25 Appendix 4E and Annual Report and FY25 Results Presentation.
+11.6% Humm Group (HUM) – No news 🤔.
+11.5% Findi (FND) – Findi selects DAM Capital and Ambit as Lead Managers for IPO.
+10.4% Weebit Nano (WBT) – No news, general strength across the broader Information Technology sector today (has some operations in Israel, possibility of ceasefire talks likely helping here).
+10.3% Appen (APX) – No news, general strength across the broader Information Technology sector today.
+10.0% Webjet (WJL) – No news (travel co's generally stronger today on ceasefire hopes).
+8.8% Silex Systems (SLX) – No news (uranium price higher overnight, see ChartWatch above for technical analysis).
+6.9% GQG Partners (GQG) – No news (fund managers generally higher today in line with stronger global equities).
+6.9% HMC Capital (HMC) – No news (fund managers generally higher today in line with stronger global equities).
+6.7% Andean Silver (ASL) – Coyita drilling doubles vertical extent of mineralisation.
+6.6% Pilbara Minerals (PLS) – Corporate Presentation - Fastmarkets Conference 2025 and Change of Director's Interest Notice (Dale Henderson +$1 million on market purchase), general strength across the broader Lithium sector today (benchmark lithium carbonate futures up 2.7% today on China’s GFEX, back above psychological CNY60k level, also CEO’s $1 million on market stock purchase likely helping!).
+6.4% Larvotto Resources (LRV) – No news since 23-Jun Preliminary Approval for Hillgrove Development Application.
+6.1% Clinuvel Pharmaceuticals (CUV) – German Non-deal Roadshow Presentation.
+6.0% Clarity Pharmaceuticals (CU6) – No news 🤔.
+5.8% Genusplus Group (GNP) – No news, rise is consistent with prevailing short and long term uptrends, a regular in ChartWatch ASX Scans Uptrends list 🔎📈
+5.4% Zip Co. (ZIP) – No news, rise is consistent with prevailing short and long term uptrends, a regular in ChartWatch ASX Scans Uptrends list 🔎📈
+5.3% Liontown Resources (LTR) – No news, general strength across the broader Lithium sector today (general sector confidence today, possibly also PLS CEO stock purchase washing through peers).
+5.3% Global X Ultra Long Nasdaq-100 Hedge Fund ETF (LNAS) – No news, (long Nasdaq ETF).
Trading lower
-12.7% BetaShares Crude Oil Index ETF-Currency Hedged ETF (OOO) – No news, general weakness across the broader Energy sector today (long Crude Oil ETF, heavy losses for major crude oil futures contracts overnight due to developments in Middle East situation).
-9.4% St Barbara (SBM) – No news, general weakness across the broader Gold sector today (generally weaker gold, energy, and defence stocks today, again, because of Middle East developments).
-9.1% AIC Mines (A1M) – Successful $55M Placement, fall is consistent with prevailing short and long term downtrends 🔎📉
-6.9% Electro Optic Systems (EOS) – No news, general weakness across the broader Defence sector today.
-6.8% Archtis (AR9) – Reinstatement to Official Quotation.
-6.5% Woodside Energy Group (WDS) – No news, general weakness across the broader Energy sector today.
-6.5% Karoon Energy (KAR) – No news, general weakness across the broader Energy sector today.
-6.5% Alligator Energy (AGE) – Successful $17M Institutional Placement, general weakness across the broader Energy sector today.
-5.3% Global X Ultra Short Nasdaq-100 Hedge Fund ETF (SNAS) – No news (short Nasdaq ETF).
-4.7% BetaShares US EQY Strong Bear - CH ETF (BBUS) – No news (short US stocks ETF).
-4.2% Catalyst Metals (CYL) – No news, general weakness across the broader Gold sector today.
-4.2% BetaShares Global Energy Companies Hedged ETF (FUEL) – No news, general weakness across the broader Energy sector today (long global energy companies ETF).
-3.7% Coronado Global Resources (CRN) – No news, general weakness across the broader Energy sector today, fall is consistent with prevailing short and long term downtrends, one of the most Featured (highest conviction) stocks in ChartWatch ASX Scans Downtrends list 🔎📉
-3.4% Antipa Minerals (AZY) – No news, general weakness across the broader Gold sector today.
0.0% Meeka Metals (MEK) – No news, general weakness across the broader Gold sector today.
-3.2% Viva Energy Group (VEA) – No news, general weakness across the broader Energy sector today.
Broker Moves
AIC Mines (A1M)
Retained at Buy at Bell Potter; Price Target: $0.56 from $0.67
Adairs (ADH)
Retained at Buy at Canaccord Genuity; Price Target: $2.95 from $3.25
Retained at Overweight at Jarden; Price Target: $2.07 from $2.59
Retained at Hold at Ord Minnett; Price Target: $2.35 from $2.70
Retained at Neutral at UBS; Price Target: $2.25 from $2.55
Canyon Resources (CAY)
Retained at Speculative buy at Canaccord Genuity; Price Target: $0.35
Cuscal (CCL)
Retained at Buy at Ord Minnett; Price Target: $3.75
Collins Foods (CKF)
Retained at Buy at Citi; Price Target: $9.60
Retained at Sector perform at RBC Capital Markets; Price Target: $8.50
Capricorn Metals (CMM)
Retained at Buy at Canaccord Genuity; Price Target: $10.60
Downer EDI (DOW)
Upgraded to Outperform from Sector perform at RBC Capital Markets; Price Target: $6.75 from $5.75
Kelsian Group (KLS)
Downgraded to Accumulate from Buy at Ord Minnett; Price Target: $3.95 from $3.80
LendLease Group (LLC)
Retained at Equal weight at Morgan Stanley; Price Target: $7.12
Lunnon Metals (LM8)
Retained at Buy at Shaw and Partners; Price Target: $0.60
Metcash (MTS)
Downgraded to Neutral from Buy at Citi; Price Target: $3.90 from $3.70
Retained at Outperform at CLSA; Price Target: $4.40 from $4.30
Retained at Overweight at Jarden; Price Target: $4.10 from $4.00
Retained at Buy at Jefferies; Price Target: $4.30 from $4.20
Retained at Outperform at Macquarie; Price Target: $4.00 from $3.70
Retained at Equal weight at Morgan Stanley; Price Target: $3.75 from $3.35
Retained at Buy at Ord Minnett; Price Target: $4.60 from $4.10
Retained at Buy at UBS; Price Target: $4.25 from $4.00
Resimac Group (RMC)
Retained at Buy at Bell Potter; Price Target: $1.00 from $1.10
SHAPE Australia Corporation (SHA)
Retained at Buy at Shaw and Partners; Price Target: $5.40 from $5.00
Sigma Healthcare (SIG)
Retained at Hold at Morgans; Price Target: $3.12 from $2.98
Smartpay Holdings (SMP)
Downgraded to Hold from Buy at Bell Potter; Price Target: $1.13 from $1.30
Santos (STO)
Initiated at Outperform at CLSA; Price Target: $9.00
Treasury Wine Estates (TWE)
Retained at Outperform at RBC Capital Markets; Price Target: $10.80
Virgin Australia (VGN)
Initiated at Outperform at CLSA; Price Target: $3.24
Ventia Services Group (VNT)
Retained at Outperform at RBC Capital Markets; Price Target: $4.75
Woodside Energy Group (WDS)
Initiated at Outperform at CLSA; Price Target: $31.00
Scans
Top Gainers
Code | Company | Last | % Chg |
|---|---|---|---|
| GBZ | GBM Resources Ltd | $0.014 | +133.33% |
| OLY | Olympio Metals Ltd | $0.08 | +86.05% |
| OLH | Oldfields Holdings Ltd | $0.025 | +56.25% |
| GGP | Greatland Resources Ltd | $7.30 | +43.70% |
| CDE | Codeifai Ltd | $0.048 | +41.18% |
Top Fallers
Code | Company | Last | % Chg |
|---|---|---|---|
| COY | Coppermoly Ltd | $0.011 | -21.43% |
| AQC | Australian Pacific Coal Ltd | $0.044 | -20.00% |
| BRU | Buru Energy Ltd | $0.024 | -20.00% |
| TGH | Terragen Holdings Ltd | $0.017 | -19.05% |
| BEZ | Besra Gold Inc | $0.047 | -18.97% |
52 Week Highs
Code | Company | Last | % Chg |
|---|---|---|---|
| GBZ | GBM Resources Ltd | $0.014 | +133.33% |
| OLY | Olympio Metals Ltd | $0.08 | +86.05% |
| GGP | Greatland Resources Ltd | $7.30 | +43.70% |
| CDE | Codeifai Ltd | $0.048 | +41.18% |
| SRL | Sunrise Energy Metals Ltd | $0.91 | +40.00% |
52 Week Lows
Code | Company | Last | % Chg |
|---|---|---|---|
| BRU | Buru Energy Ltd | $0.024 | -20.00% |
| A3D | Aurora Labs Ltd | $0.038 | -15.56% |
| SLB | Stelar Metals Ltd | $0.05 | -13.79% |
| BGT | Bio-Gene Technology Ltd | $0.016 | -11.11% |
| MML | Mclaren Minerals Ltd | $0.018 | -10.00% |
Near Highs
Code | Company | Last | % Chg |
|---|---|---|---|
| OZBD | Betashares Australian Composite Bond ETF | $45.22 | 0.00% |
| PCI | Perpetual Credit Income Trust | $1.17 | -0.85% |
| WVOL | Ishares MSCI World Ex Aust Minimum Volatility ETF | $44.15 | +0.91% |
| MTS | Metcash Ltd | $3.80 | +2.70% |
| AII | Almonty Industries Inc | $3.50 | -1.41% |
Relative Strength Index (RSI) Oversold
Code | Company | Last | % Chg |
|---|---|---|---|
| KMD | KMD Brands Ltd | $0.255 | +2.00% |
| IMM | Immutep Ltd | $0.225 | -4.26% |
| DGL | DGL Group Ltd | $0.365 | -1.35% |
| MGX | Mount Gibson Iron Ltd | $0.26 | -1.89% |
| INA | Ingenia Communities Group | $5.46 | -1.09% |
