News | Market Wraps
Evening Wrap: ASX 200 slides as US joins Middle East conflict, but stronger banking stocks limit damage from resources, Qantas
The S&P/ASX 200 closed 30.6 points lower, down 0.36%.

Mentioned
The S&P/ASX 200 closed 30.6 points lower, down 0.36%.
It could have been far worse today. That's the key takeaway as the ASX 200, for the most part, avoided the heavy falls we might ordinarily have expected due to the growing uncertainty emanating from the Middle East.
Stronger banking stocks (the ever-stalwarts of the Australian stock market) offset sharp falls in Resources and Industrial stocks. In Resources, the big miners were generally down around 1%, while Qantas Airways (QAN) (-1.9%) weighed on Industrials.
To make sense of all the above, I have detailed technical analysis on the Nasdaq Composite, S&P/ASX 200, and Brent Crude Oil in today's ChartWatch.
Be sure to click/scroll through for the usual reporting of the major sector and stock-specific moves, the broker responses to them, as well as all the key economic data in tonight's Evening Wrap.
Let's dive in!
Today in Review
Mon 23 Jun 25, 5:34pm (AEST)
Name | Value | % Chg |
|---|---|---|
Major Indices | ||
| ASX 200 | 8,474.9 | -0.36% |
| All Ords | 8,688.0 | -0.41% |
| Small Ords | 3,190.8 | -1.00% |
| All Tech | 3,977.2 | -0.51% |
| Emerging Companies | 2,210.5 | -1.90% |
Currency | ||
| AUD/USD | 0.6418 | -0.48% |
US Futures | ||
| S&P 500 | 6,013.0 | -0.08% |
| Dow Jones | 42,446.0 | -0.16% |
| Nasdaq | 21,826.5 | -0.08% |
Name | Value | % Chg |
|---|---|---|
Sector | ||
| Financials | 9,346.9 | +0.35% |
| Energy | 9,095.3 | +0.13% |
| Utilities | 9,438.6 | +0.03% |
| Communication Services | 1,845.8 | -0.04% |
| Health Care | 41,484.3 | -0.27% |
| Real Estate | 3,973.9 | -0.29% |
| Information Technology | 2,922.2 | -0.60% |
| Consumer Discretionary | 4,076.9 | -0.61% |
| Consumer Staples | 12,273.0 | -0.97% |
| Materials | 15,495.4 | -1.32% |
| Industrials | 8,340.4 | -1.40% |
Markets
%20intraday%20chart%2023%20Jun%202025.png)
ASX 200 Session Chart
The S&P/ASX 200 (XJO) finished 30.6 points lower at 8,474.9, 0.64% from its session low and 0.36% from its high.
The glass is either 0.64% full or 0.36% empty depending on whether you’re an optimist or a pessimist 🥛.
My technical analysis (see ChartWatch XJO below) puts me in the "optimist" camp 🤞. It could have been substantially worse today. There are plenty of reasons to sell, and as far as I can tell, few…or at least fewer, reasons to buy.
And yet, the big funds did just that for the most part today. From that precarious open where it could have very easily gone pear-shaped…to the relatively firm close. As can be seen in the intraday chart above, all the fear the media is trying to instil in us amounted to steady buying throughout the final two-thirds of the session.
It wasn’t a win. That still counts. But local investors spoke today, telling us how much they weighs the events over the weekend in terms of risk versus reward.
But that’s now.
Tomorrow there could be one hand on the scale weighing down the risk-off course of action…and the demand-supply dynamics will adjust accordingly. I propose that we all commit here to focussing more on the price action over the next few days/weeks of what will clearly be a dynamic situation, and less on the headlines, commentary from so-called experts with little new to add, and even the events themselves.
For it is how capital shifts from risk to cash that really matters.
On that point, typically, we can get an idea of the risk-to-cash dynamic by looking at the premier risk-off asset in the 10-year US T-Bond. When investors want to park cash that has been withdrawn from risk-on assets like stocks, crypto, and commodities, it usually goes here. You can always count on Uncle Sam’s IOU’s.

US 10-Year Treasury Bond Yield (click here for full size image)
But this time around, the dominance of US 10’s is obfuscated by President Trump’s trade policies which have reignited arguably already prevalent de-dollarisation trends. So, whether the muted response in the chart above is as a result of a lack of demand for US 10’s / the safety of US dollars in general – or as a result of the global investment community not feeling like they require the relative safety of either – is unclear.
(Remember, due to the inverse relationship between bond prices and bond yields, we’d ordinarily expect the chart above of the 10-year T-Bond yield to fall in times of uncertainty as investors bid up its price)
The US Dollar chart below shows a modest bounce over the last few sessions as events in the Middle East have escalated – consistent with a modest degree of risk aversion.

US Dollar Index Futures (Front month, back-adjusted) ICE (click here for full size image)
If I look further afield (charts not shown, and which I'll leave to your homework), other risk-off benchmark bonds from Europe, Japan, and even here in Australia, are similarly barely moved. So, for now, can I conclude that all is still quiet on the risk-aversion front? 🧐
ChartWatch
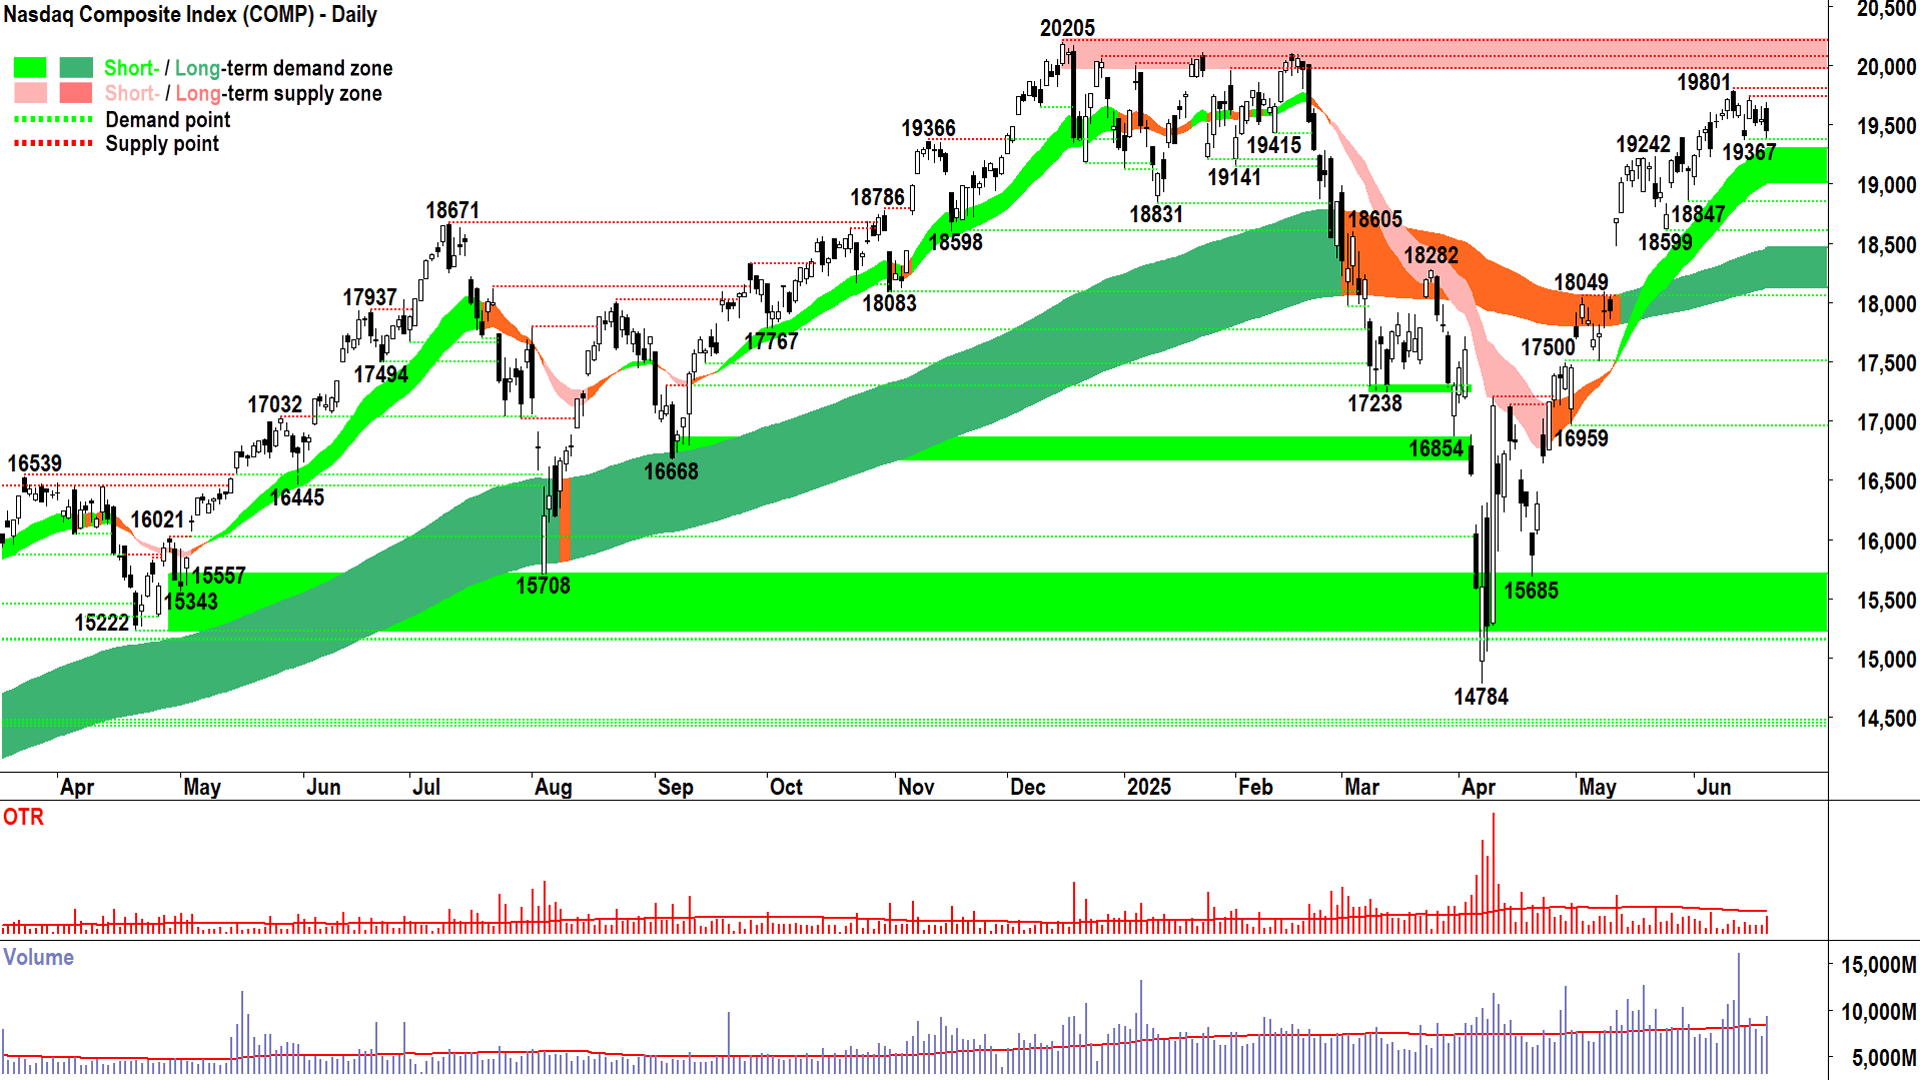
NASDAQ Composite Index

Sure…like that’s gonna happen! 🤦 (click here for full size image)
For the last several sessions, I’ve been mooting the Comp is shifting into more of an equilibrium between demand and supply rather than the prior demand-side controlled market.
Friday’s clear but modest supply-side candle further confirms this notion. Even just a visual examination of the Comp’s recent price action suggests sideways and not rising price movement.
Equilibrium is not a merely transition phase, it’s a phase in its own right! Up, down, and sideways. D > S, S > D, and D = S. Each is equally valid!
We often overlook the D = S phases because of the boredom that accompanies them – but they are an important market phase – and yes, be default they often act as transitory periods between up and down.
As for the Comp, more broadly, one cannot discount the fact that the short and long term trends remain up / up, and that the trend ribbons continue to act as dynamic zones of excess demand.
Therefore, we must still believe that the most likely scenario is therefore continuation…at some point.
In the meantime, we will monitor candles (demand-side = white-bodied and or downward pointing shadows = ✅ vs supply-side = black-bodied and or upward pointing shadows = ❌) and the maintenance of the price closing above the short term uptrend ribbon.
(I know I shouldn’t let these thoughts enter my mind…hey, chart only Carl…D vs S = P is all that matters! But, given everything that is going on in the world at the moment, one wonders what could possibly be the catalyst that pushes the Comp up enough to punch a hole in 20205? 🤔 Certain people need to start getting along with certain other people pretty soon…Sure…like that’s gonna happen! 🤦)
S&P/ASX 200 (XJO)
%20chart%2023%20Jun%202025.png)
I think we’re okay here 🤞 (click here for full size image)
Ok, you tell me. Is there anything in the chart above that surprises you one iota!? 🤔
All the headlines at the moment. All the hype and uncertainty the media en masse is trying to perpetuate on you to get clicks and views…and we get that candle today.
If I asked you before the start of trading today to predict its candle, would that last one on the chart above be it? For me, today’s candle just makes so much sense…
An initial but modest degree of excess supply on the open, causing the price to push into the dynamic demand of the short term uptrend ribbon and previous static points of demand at 8380-8453
Followed by the moving in of motivated demand (in line with strong prevailing short and long term uptrends, price action, and otherwise candle environment)
Overwhelming early supply, and pushing the XJO price up steadily through the session to close it well off the session lows and not too far from the session high (i.e., long downward pointing shadow!).
I think we’re okay here 🤞. Today could have been substantially worse – but it wasn’t. Not by accident, but because a bunch of investors much smarter and better capitalised than us saw fit not to sell that open, but to buy it.
My model requires me to back them until they stop supporting the price and start contributing to its demise.
Okay, so where’s that?
A close below the short term uptrend ribbon / 8380 would not be good at all. That would definitely shake my confidence in the sustainability of this uptrend.
As would a full black candle rather than today’s and Friday’s downward pointing shadows ones.
As would a lower peak set to 8640 would also be problematic, particularly if it is set with an emphatic supply-side showing.
Until these things happen, I have no reason not to back the prevailing trends. Staying the course here with unchanged risk levels (but watching ever so closely ⚠️!!!).
Brent Crude Oil Futures (Front month, back-adjusted) ICE
%20ICE%20chart%2023%20Jun%202025.png)
An interesting chart (click here for full size image)
The second last time we covered Brent Crude Oil was in ChartWatch in the Evening Wrap on 13 June.
In that update, immediately in the wake of the first Israeli strike against Iranian nuclear facilities, Brent was spiking through major supply at 73.96-74.82, but with a long upward shadow on the then-live candle and falling foul of the 79.16 point of supply. The analysis I had for you on that occasion was along the lines of “If the spike sticks, it’s credible, if not – it’s not!”.
The last time we covered it was on 19 June. In that update, I noted Brent’s credibility factor had risen substantially with it holding above 74.82 and hovering near 79.16… “the longer it hovers just below 79.16, the greater the probability it will breakthrough. In short, it's looking less likely this last Middle East move is a flash in the pan,” I said.
I concluded that last update by saying that “even if 79.16 falls, 80.76-82.77 will be a tough nut to crack....the upside is still likely capped in the short term.”
And that’s exactly where we pick up this possibly commodity story of 2025 – the USA is now involved in the conflict – so just how capped is its upside now?
The candle above is live – so we really should discount it. What we do know is Friday’s candle (and last week’s candles more generally) demonstrate demand is holding firm, but against a backdrop of similarly firm, but slipping, supply.
Let’s assume today’s candle closes much like it appears now – upward pointing shadow, black body, closing on the session low. Equals ❌❌❌ for Brent’s ability to push through the critical 80.76-82.77 supply zone. There’s just too much motivated supply there…
Each time we’ve covered Brent there’s been an “escalation” to allow it to grind and hold higher. What does the “next escalation” have to be to get it through 80.76-82.77? 🤔 I don’t really want to contemplate that!
If today’s candle sticks, it fits with our “capped” narrative. If, however, Brent can somehow turn it around, and finish with a long white-bodied high close…then I propose we’re moving into a new trading range and a new psychological acceptance by the market that crude prices can go materially higher.
We must go to the weekly chart to check what the next range might be…
%20ICE%20weekly%20chart%2023%20Jun%202025.png)
Brent Crude Oil Futures (Front month, back-adjusted) ICE weekly chart (click here for full size image)
The short-medium term range of 80.76-82.90 now comes into perspective. Above it sits 84.79…and then not a great deal else until 97.96-104.80.
White candles closing very near or above the supply zone is the best signal we can get at investors that supply at that zone has been consumed.
We’re not there yet, but by just being in the near proximity of 82.77-84.79, it’s a sound start of the process of dismantling that overhead excess supply. More work needs to be done, and we await confirmation via the candles one way or the other (i.e., demand-side success or failure!).
My tip? Whilst events on the ground are going to ensure substantial volatility here, I suggest Brent is a better than warm prospect. The close of today’s candle is critical. Should we see the current supply-side showing stick, then the fallback is the holding of 74.82 as a new zone of demand.
If we get a close above 80.76, it should in theory begin to pave the way for a potential break of 84.79. These are certainly interesting times we live in!
Economy
Today
AUS Flash Manufacturing & Services Purchasing Managers Index (PMI) June
Manufacturing: 51.0 unchanged from May (May's result was revised lower from 51.7)
Services: 51.3 vs 50.6 in May (May's result was revised higher from 50.5)
Readings over 50 indicate expansion in a sector, so both Manufacturing and Services sectors expanded in the last month, albeit modestly. May's downward revision is disappointing, however, versus a solid improvement in Services.
Although modest growth in Australian business activity, June's readings are the second strongest in ten months, just behind that seen in March.
Later this week
Monday
EUR French Flash Manufacturing & Services PMI June (Manufacturing: 49.6 forecast vs 49.4 in May; Services: 50.0 forecast vs 49.7 in May)
Tuesday
00:00 USA Existing Home Sales May (3.96 million forecast vs 4.00 million previous)
Wednesday
00:00 USA Federal Reserve Chairman Jerome Powell Semiannual Monetary Policy Report before the House Financial Services Committee
11:30 AUS CPI May (+2.4% p.a. forecast, unchanged from April)
Thursday
22:30 USA Final GDP March (-0.2% p.a. forecast vs +2.4% p.a. in December)
22:30 USA Core Durable Goods Orders May (+0.1% m/m forecast vs +0.2% m/m in April)
Friday
22:30 USA Core Personal Consumption Expenditures (PCE) May
Price Index: +0.1% m/m forecast vs +0.1% m/m in April
Personal Income: +0.2% m/m forecast vs +0.8% m/m in April
Personal Spending: +0.2% m/m forecast vs +0.2% m/m in April
Latest News
Interesting Movers
Trading higher
+9.6% Smartpay (SMP) – Smartpay enters into Scheme Implementation Agreement.
+5.0% MTM Critical Metals (MTM) – No news, rise is consistent with prevailing short and long term uptrends, a regular in ChartWatch ASX Scans Uptrends list 🔎📈
+4.3% Viva Energy Group (VEA) – No news, general strength across the broader Energy sector today, upgraded to positive from neutral at E&P and price target increased to $2.90 from $2.30, rise is consistent with prevailing short term uptrend and rising peaks and rising troughs 🔎📈
+4.2% Resolute Mining (RSG) – No news, upgraded to buy from accumulate at Ord Minnett and price target increased to $1.000 from $0.650.
+3.0% EML Payments (EML) – Change in substantial holding from WAM/WMI, (Wilson Asset Management increase from 6.6% to 8.8%), rise is consistent with prevailing long term uptrend 🔎📈
Trading lower
-22.5% Alligator Energy (AGE) – Successful $17M Institutional Placement.
-20.5% Adairs (ADH) – ADH Trading Update and FY25 Guidance.
-12.2% Amplia Therapeutics (ATX) – No news, pulled back after recent sharp rally due to 19-Jun Second Complete Response in ACCENT Pancreatic Cancer Trial.
-10.7% Syrah Resources (SYR) – No news, general weakness across the broader Resources sector today.
-10.7% The Star Entertainment Group (SGR) – No news, fall is consistent with prevailing long term downtrend 🔎📉
Broker Moves
29METALS (29M)
Retained at sell at Citi; Price Target: $0.150 from $0.120
Retained at hold at Ord Minnett; Price Target: $0.300
Australian Clinical Labs (ACL)
Upgraded to buy from neutral at Bank of America; Price Target: $3.60 from $3.40
Ampol (ALD)
Retained at positive at E&P; Price Target: $34.00
Aurelia Metals (AMI)
Retained at outperform at Macquarie; Price Target: $0.250 from $0.320
ANZ Group (ANZ)
Retained at neutral at Citi; Price Target: $27.50
Downgraded to sell from neutral at UBS; Price Target: $26.50 from $30.00
Ausgold (AUC)
Retained at speculative buy at Canaccord Genuity; Price Target: $1.600
Bellevue Gold (BGL)
Retained at hold at Ord Minnett; Price Target: $1.100
BHP Group (BHP)
Retained at buy at Citi; Price Target: $43.00 from $45.00
Downgraded to accumulate from buy at Morgans; Price Target: $43.70 from $48.70
Retained at accumulate at Ord Minnett; Price Target: $41.00 from $42.00
Commonwealth Bank of Australia (CBA)
Retained at sell at Citi; Price Target: $100.00
Charter Hall Group (CHC)
Retained at sell at UBS; Price Target: $18.41 from $15.49
Champion Iron (CIA)
Retained at buy at Citi; Price Target: $6.50 from $7.30
Capricorn Metals (CMM)
Retained at hold at Ord Minnett; Price Target: $10.90
Centuria Capital Group (CNI)
Retained at hold at Bell Potter; Price Target: $1.800
Upgraded to neutral from sell at UBS; Price Target: $1.810 from $1.740
Centuria Office Reit (COF)
Retained at sell at Bell Potter; Price Target: $1.100
Upgraded to neutral from sell at UBS; Price Target: $1.200 from $1.140
Charter Hall Retail Reit (CQR)
Downgraded to neutral from buy at UBS; Price Target: $3.95 from $3.69
Capstone Copper Corp. (CSC)
Retained at buy at Citi; Price Target: $10.70 from $10.50
Retained at buy at Ord Minnett; Price Target: $12.00
CSL (CSL)
Retained at buy at Bell Potter; Price Target: $305.00 from $335.00
Cedar Woods Properties (CWP)
Retained at buy at Bell Potter; Price Target: $7.30
Core Lithium (CXO)
Retained at hold at Canaccord Genuity; Price Target: $0.100
Retained at hold at Ord Minnett; Price Target: $0.110
Delta Lithium (DLI)
Retained at hold at Ord Minnett; Price Target: $0.170
Domino's Pizza Enterprises (DMP)
Retained at neutral at UBS; Price Target: $25.00
Deterra Royalties (DRR)
Retained at buy at Citi; Price Target: $4.40 from $4.50
Retained at buy at Ord Minnett; Price Target: $4.30
Emerald Resources (EMR)
Retained at lighten at Ord Minnett; Price Target: $4.10 from $3.60
Evolution Mining (EVN)
Retained at neutral at Citi; Price Target: $8.00 from $8.50
Firefly Metals (FFM)
Retained at buy at Ord Minnett; Price Target: $1.600
Fortescue (FMG)
Downgraded to neutral from buy at Citi; Price Target: $16.00 from $17.50
Downgraded to hold from buy at Morgans; Price Target: $16.50 from $18.80
Retained at buy at Ord Minnett; Price Target: $20.00
Global Lithium Resources (GL1)
Downgraded to hold from accumulate at Ord Minnett; Price Target: $0.200
GQG Partners (GQG)
Initiated at outperform at RBC Capital Markets; Price Target: $2.90
Guzman y Gomez (GYG)
Retained at neutral at UBS; Price Target: $34.00
Hastings Technology Metals (HAS)
Retained at hold at Ord Minnett; Price Target: $0.280
Homeco Daily Needs Reit (HDN)
Retained at hold at Bell Potter; Price Target: $1.350
Downgraded to neutral from buy at UBS; Price Target: $1.400 from $1.350
HMC Capital (HMC)
Retained at buy at UBS; Price Target: $8.00 from $12.40
IGO (IGO)
Downgraded to neutral from buy at Citi; Price Target: $4.10 from $4.40
Retained at buy at Ord Minnett; Price Target: $5.20 from $6.00
Retained at sell at UBS; Price Target: $3.60
Lifestyle Communities (LIC)
Retained at buy at Citi; Price Target: $9.00
Lendlease Group (LLC)
Retained at buy at Citi; Price Target: $6.80 from $7.50
Upgraded to neutral from sell at UBS; Price Target: $6.05 from $6.38
Lovisa (LOV)
Upgraded to neutral from sell at UBS; Price Target: $30.00 from $26.00
Liontown Resources (LTR)
Downgraded to sell from neutral at Citi; Price Target: $0.500
Downgraded to sell from lighten at Ord Minnett; Price Target: $0.450 from $0.500
Retained at sell at UBS; Price Target: $0.500
Lynas Rare Earths (LYC)
Downgraded to underperform from neutral at Macquarie; Price Target: $8.00
Magnetic Resources (MAU)
Retained at buy at Shaw and Partners; Price Target: $2.53
Mineral Resources (MIN)
Retained at neutral at Citi; Price Target: $20.00
Retained at buy at Ord Minnett; Price Target: $31.00
Retained at neutral at UBS; Price Target: $25.70
National Australia Bank (NAB)
Retained at sell at Citi; Price Target: $30.50
Newmont Corporation (NEM)
Retained at buy at Ord Minnett; Price Target: $115.00 from $97.00
New Hope Corporation (NHC)
Retained at neutral at Citi; Price Target: $3.85
Nickel Industries (NIC)
Retained at buy at Citi; Price Target: $0.900
Retained at buy at Ord Minnett; Price Target: $1.650 from $1.700
Predictive Discovery (PDI)
Retained at hold at Ord Minnett; Price Target: $0.600 from $0.390
Pilbara Minerals (PLS)
Downgraded to neutral from buy at Citi; Price Target: $1.300 from $1.600
Downgraded to sell from hold at Ord Minnett; Price Target: $1.100 from $1.750
Retained at sell at UBS; Price Target: $1.100
Patriot Battery Metals (PMT)
Retained at buy at UBS; Price Target: $0.330
Pinnacle Investment Management Group (PNI)
Initiated at outperform at RBC Capital Markets; Price Target: $23.00
Perseus Mining (PRU)
Retained at accumulate at Ord Minnett; Price Target: $3.90 from $3.50
REA Group (REA)
Downgraded to hold from buy at Bell Potter; Price Target: $262.00 from $267.00
Region Group (RGN)
Retained at buy at Bell Potter; Price Target: $2.65
Rio Tinto (RIO)
Retained at neutral at Citi; Price Target: $113.00 from $130.00
Downgraded to hold from accumulate at Morgans; Price Target: $108.00 from $119.00
Retained at buy at Ord Minnett; Price Target: $120.00 from $126.00
Retained at neutral at UBS; Price Target: $120.00
Retained at neutral at Citi; Price Target: $46.00 from $54.00 (duplicate or error ticker)
Regis Resources (RRL)
Retained at sell at Ord Minnett; Price Target: $3.10 from $2.70
Resolute Mining (RSG)
Upgraded to buy from accumulate at Ord Minnett; Price Target: $1.000 from $0.650
South32 (S32)
Retained at neutral at Citi; Price Target: $3.40
Retained at buy at Ord Minnett; Price Target: $4.10 from $4.20
Seek (SEK)
Retained at buy at Bell Potter; Price Target: $28.40 from $25.80
Sandfire Resources (SFR)
Retained at neutral at Citi; Price Target: $11.50 from $11.00
Stanmore Resources (SMR)
Retained at buy at Citi; Price Target: $3.10
Symal Group (SYL)
Retained at buy at Ord Minnett; Price Target: $2.40 from $2.50
Telstra Group (TLS)
Retained at neutral at UBS; Price Target: $4.60
Temple & Webster Group (TPW)
Initiated at underperform at Jefferies; Price Target: $17.00
Treasury Wine Estates (TWE)
Retained at neutral at Citi; Price Target: $8.68
Universal Store (UNI)
Retained at buy at UBS; Price Target: $10.30
Vicinity Centres (VCX)
Downgraded to sell from neutral at UBS; Price Target: $2.38 from $2.27
Viva Energy Group (VEA)
Upgraded to positive from neutral at E&P; Price Target: $2.90 from $2.30
West African Resources (WAF)
Retained at buy at Ord Minnett; Price Target: $3.40 from $2.80
Westpac Banking Corporation (WBC)
Retained at sell at Citi; Price Target: $27.75
Wildcat Resources (WC8)
Retained at buy at Ord Minnett; Price Target: $0.300
Westgold Resources (WGX)
Retained at buy at Canaccord Genuity; Price Target: $4.40
Retained at outperform at RBC Capital Markets; Price Target: $4.60
Whitehaven Coal (WHC)
Retained at buy at Citi; Price Target: $7.00 from $7.40
Scans
Top Gainers
Code | Company | Last | % Chg |
|---|---|---|---|
| X2M | X2M Connect Ltd | $0.03 | +57.90% |
| BEL | Bentley Capital Ltd | $0.011 | +37.50% |
| BDT | Birddog Technology Ltd | $0.067 | +36.74% |
| SMS | Star Minerals Ltd | $0.025 | +31.58% |
| PV1 | Provaris Energy Ltd | $0.019 | +26.67% |
Top Fallers
Code | Company | Last | % Chg |
|---|---|---|---|
| BCB | Bowen Coking Coal Ltd | $0.096 | -46.67% |
| AGE | Alligator Energy Ltd | $0.031 | -22.50% |
| ZAG | Zuleika Gold Ltd | $0.014 | -22.22% |
| MAP | Microba Life Sciences Ltd | $0.09 | -21.74% |
| ADH | Adairs Ltd | $2.05 | -20.54% |
52 Week Highs
Code | Company | Last | % Chg |
|---|---|---|---|
| AIQ | Alternative Investment Trust | $1.83 | +21.19% |
| WRK | WRKR Ltd | $0.084 | +20.00% |
| NSB | Neuroscientific Biopharmaceuticals Ltd | $0.094 | +18.99% |
| A1G | African Gold Ltd | $0.175 | +9.38% |
| CHW | Chilwa Minerals Ltd | $1.03 | +8.42% |
52 Week Lows
Code | Company | Last | % Chg |
|---|---|---|---|
| BCB | Bowen Coking Coal Ltd | $0.096 | -46.67% |
| MAP | Microba Life Sciences Ltd | $0.09 | -21.74% |
| INF | Infinity Lithium Corporation Ltd | $0.014 | -17.65% |
| NOX | Noxopharm Ltd | $0.051 | -15.00% |
| GIB | Gibb River Diamonds Ltd | $0.03 | -14.29% |
Near Highs
Code | Company | Last | % Chg |
|---|---|---|---|
| OZBD | Betashares Australian Composite Bond ETF | $45.26 | 0.00% |
| PCI | Perpetual Credit Income Trust | $1.19 | -0.85% |
| WVOL | Ishares MSCI World Ex Aust Minimum Volatility ETF | $43.97 | +0.91% |
| MTS | Metcash Ltd | $3.805 | +2.70% |
| AII | Almonty Industries Inc | $3.53 | -1.41% |
Relative Strength Index (RSI) Oversold
Code | Company | Last | % Chg |
|---|---|---|---|
| KMD | KMD Brands Ltd | $0.253 | +2.00% |
| IMM | Immutep Ltd | $0.228 | -4.26% |
| DGL | DGL Group Ltd | $0.365 | -1.35% |
| MGX | Mount Gibson Iron Ltd | $0.255 | -1.89% |
| INA | Ingenia Communities Group | $5.425 | -1.09% |
