

The ASX 200 fell as the bond market sell-off drove market yields even higher. The result? A comprehensive sell-off across technology, gold, materials, and consumer discretionary stocks. Energy was the sole meaningful winner as Brent crude surged nearly 5% overnight on fresh US strikes against Iranian oil infrastructure.
Be sure to click/scroll through for the usual reporting of the major sector and stock-specific moves, the broker responses to them, as well as all the key economic data in tonight's Evening Wrap. Also, I have detailed technical analysis on the Nasdaq Composite and the S&P/ASX 200 in today's ChartWatch.
Let’s dive in!
Today in Review
Name | Value | % Chg |
|---|---|---|
Major Indices | ||
| ASX 200 | 8,978.4 | -0.97% |
| All Ords | 9,160.3 | -1.09% |
| Small Ords | 3,425.8 | -1.78% |
| All Tech | 2,955.9 | -2.39% |
| Emerging Companies | 3,062.1 | -3.15% |
Currency | ||
| AUD/USD | 0.714 | -0.07% |
US Futures | ||
| S&P 500 | 7,637.75 | -0.07% |
| Dow Jones | 52,844.0 | +0.03% |
| Nasdaq | 29,061.5 | -0.22% |
Name | Value | % Chg |
|---|---|---|
Sector | ||
| Consumer Staples | 13,318.7 | +0.81% |
| Communication Services | 1,573.7 | +0.38% |
| Financials | 9,277.5 | +0.25% |
| Energy | 11,148.0 | +0.02% |
| Health Care | 31,723.5 | -0.09% |
| Utilities | 10,265.8 | -0.23% |
| Consumer Discretionary | 3,620.0 | -0.43% |
| Industrials | 8,043.4 | -0.94% |
| Real Estate | 3,337.0 | -1.23% |
| Materials | 25,391.1 | -3.08% |
| Information Technology | 1,804.6 | -3.35% |
ASX 200 Intraday Chart
%20intraday%20chart_2%20Sep.png)
Markets
The S&P/ASX 200 (XJO) finished 88.3 points lower at 8,978.4, 1.0% from its session highw and 0.5% from its low. In the broader-based S&P/ASX 300 (XKO) advancers lagged decliners by a disappointing 94 to 193. 😭
Bond market-ageddon! 🦖🌠
Information Technology (XIJ) (-3.4%) was the biggest casualty. When benchmark risk-free yields rise, the rate used to discount future earnings rises with them. For a conventional business earning profits today, the impact is modest. For a high-P/E, high-growth technology business whose earnings are weighted heavily toward future years, the discounting impact is severe — each additional basis point of yield compresses the present value of those distant earnings disproportionately. NextDC (NXT) (-3.9%), Weebit Nano (WBT) (-4.2%), WiseTech Global (WTC) (-5.2%), Siteminder (SDR) (-3.4%), and Life360 (360) (-4.8%) were all savaged.
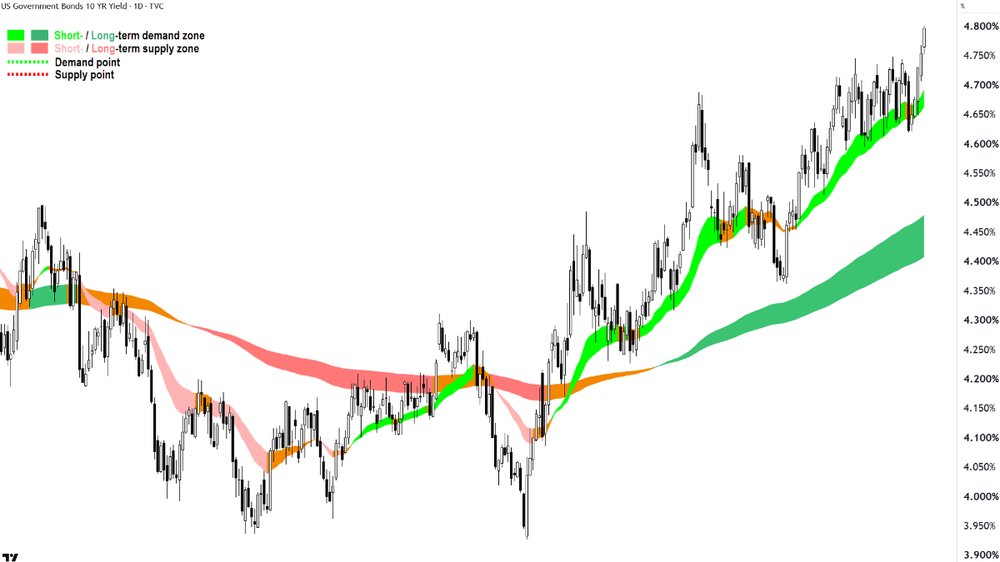
US 10-Year T-Bond Yield chart
The Gold Sub-Index (XGD) (-3.4%) received the same higher-yield treatment — gold produces no income, requires storage and insurance costs, and therefore competes directly with risk-free government bonds for capital. When benchmark bond yields surge, that competition intensifies and gold loses. COMEX gold futures fell 1.9% overnight before easing a further 0.5% to US$4,376/oz in Asian trade. Kingsgate Consolidated (KCN) (-6.2%), St Barbara (SBM) (-5.8%), Ora Banda Mining (OBM) (-6.1%), Westgold Resources (WGX) (-5.6%), and Newmont (NEM) (-3.3%) were all sharply lower.
Materials (XMJ) (-3.1%) bore the commodity-price and growth-concern combination — higher US yields strengthen the US dollar, which makes dollar-priced commodities more expensive for non-US buyers, compressing demand. COMEX copper futures fell 1.3% overnight before easing a further 0.7% to US$6.554/lb in Asian trade. Nickel Industries (NIC) (-4.7%), Pilbara Minerals (PLS) (-5.3%), Champion Iron (CIA) (-3.4%), Sandfire Resources (SFR) (-3.0%), and BHP (BHP) (-3.3%) were all lower.
Real Estate (XPJ) (-1.2%) is another sector that detests higher risk-free bond yields. Its earnings are considered to be bond-like, so if you can get a better yield in the risk-free versions — then the returns in this sector look far less attractive... Goodman Group (GMG) (-3.0%), HMC Capital (HMC) (-1.9%), and Lendlease (LLC) (-1.7%) were among the worst casualties.
Consumer Discretionary (XDJ) (-0.4%) was another casualty — high market rates flow directly into higher mortgage and personal borrowing costs, reducing household disposable income and compressing consumer spending capacity. Lovisa (LOV) (-4.3%), Universal Store (UNI) (-3.5%), Breville (BRG) (-2.9%) and Temple and Webster (TPW) (-2.1%) were all sharply lower.
But it wasn't a complete wipeout. There were some VERY STRONG MOVES TODAY. And apart from energy, they were in the most defensive, non-discretionary segments of the market you can get...
Health Care (XHJ) (-0.1%) was largely spared the rod — a sector that generates revenues irrespective of the rate cycle and is therefore largely insulated from the bond yield shock that hammered cyclical and tech plays. Telix Pharmaceuticals (TLX) (+2.8%), Cochlear (COH) (+1.6%), and CSL (CSL) (+0.9%) all advanced.
Energy (XEJ) (+0.0%) was flat even as ICE Brent crude futures surged 4.6% overnight before adding a further 0.4% to US$95/bbl in Asian trade — approaching the psychologically significant US$100 mark as US strikes on Iranian oil infrastructure raised fresh fears about regional supply disruption. Woodside Energy (WDS) (+1.2%) and Santos (STO) (+0.4%), advanced but coal stocks pulled back from recent highs.
Utilities (XUJ) (-0.2%) appeared to barely hold positive ground, but add back constituent dividends today and it was actually 1.1% higher. The sector's defensive nature provided a shield against selling elsewhere. AGL Energy (AGL) (+0.8%) and APA Group (APA) (+1.5%) both firmed, Origin Energy (ORG) (-1.7%) was down 20 cents, but went ex-dividend 30 cents fully franked.
Financials (XFJ) (+0.3%) was fractionally positive but outperformed the benchmark substantially — and the driver was sector-specific and elegant. Higher benchmark bond yields are toxic for most asset classes, but for insurers they are directly beneficial — insurance companies park premium inflows in short-duration fixed income securities, and when yields rise, those portfolios earn more. Insurance Australia Group (IAG) (+5.4%), Suncorp (SUN) (+2.4%), QBE Insurance (QBE) (+1.3%) and NIB Holdings (NHF) (+1.0%) all gained — and along with the Big 4 banks which were flat-to-slightly-higher — provided enough index weight to stem some of the day's losses.
Consumer Staples (XSJ) (+0.8%) was the best defensive sector. Primary producers and agricultural companies had a strong session — as the prices of agricultural commodities surged overnight. GrainCorp (GNC) (+11.0%), Select Harvests (SHV) (+6.2%), Inghams (ING) (+2.4%), The A2 Milk Company (A2M) (+2.4%), and Elders (ELD) (+2.5%) all advanced. Woolworths (WOW) (+0.7%) and Coles (COL) (+0.9%) also rose — flexing their defensive credentials.
Today's best ASX Top 300 gainers
Company | Last Price | Change $ | Change % | 1mo % | 1yr % |
|---|---|---|---|---|---|
| Graincorp (GNC) | $6.95 | +$0.69 | +11.0% | +24.3% | -14.7% |
| PYC Therapeutics (PYC) | $2.43 | +$0.14 | +6.1% | +42.9% | +95.2% |
| Insurance Australia Group (IAG) | $8.30 | +$0.43 | +5.5% | -2.2% | -5.5% |
| Challenger (CGF) | $9.99 | +$0.49 | +5.2% | +1.8% | +21.4% |
| Computershare (CPU) | $40.86 | +$1.14 | +2.9% | -0.2% | +9.7% |
| Telix Pharmaceuticals (TLX) | $15.69 | +$0.42 | +2.8% | +10.4% | +9.6% |
| Dalrymple Bay Infrastructure (DBI) | $5.27 | +$0.14 | +2.7% | -5.9% | +20.3% |
| Elders (ELD) | $6.11 | +$0.15 | +2.5% | +8.5% | -18.5% |
| The a2 Milk Company (A2M) | $6.79 | +$0.16 | +2.4% | -1.5% | -26.8% |
| Suncorp Group (SUN) | $19.30 | +$0.45 | +2.4% | +0.6% | -9.3% |
| Supply Network (SNL) | $36.34 | +$0.82 | +2.3% | +7.5% | +0.9% |
| Digico Infrastructure REIT (DGT) | $2.75 | +$0.06 | +2.2% | +8.3% | -10.4% |
| Predictive Discovery (PDIDB) | $4.29 | +$0.09 | +2.1% | -6.9% | -6.9% |
| Telstra Group (TLS) | $4.72 | +$0.09 | +1.9% | -6.0% | -3.9% |
| Tuas (TUA) | $2.11 | +$0.04 | +1.9% | -2.3% | -72.3% |
| Genesis Energy (GNE) | $2.24 | +$0.04 | +1.8% | +9.3% | +7.4% |
| Centuria Industrial REIT (CIP) | $2.96 | +$0.05 | +1.7% | -1.7% | -11.4% |
| Smartgroup Corporation (SIQ) | $11.30 | +$0.19 | +1.7% | -11.8% | +24.3% |
| Air New Zealand (AIZ) | $0.32 | +$0.005 | +1.6% | -8.6% | -41.3% |
| Alcoa Corporation (AAI) | $70.82 | +$1.10 | +1.6% | +10.2% | +45.9% |
Today's worst ASX Top 300 losers
Company | Last Price | Change $ | Change % | 1mo % | 1yr % |
|---|---|---|---|---|---|
| EQ Resources (EQR) | $0.385 | -$0.04 | -9.4% | +51.0% | +839.0% |
| Core Lithium (CXO) | $0.345 | -$0.035 | -9.2% | +43.8% | +200.0% |
| Capstone Copper Corp. (CSC) | $14.96 | -$1.46 | -8.9% | +9.3% | +39.3% |
| Elsight (ELS) | $4.71 | -$0.45 | -8.7% | -15.7% | +168.4% |
| Silex Systems (SLX) | $4.80 | -$0.45 | -8.6% | +4.1% | +18.5% |
| Liberty Financial Group (LFG) | $3.39 | -$0.31 | -8.4% | +4.3% | -20.8% |
| FireFly Metals (FFM) | $1.74 | -$0.145 | -7.7% | -0.6% | +48.5% |
| Zimplats Holdings (ZIM) | $16.53 | -$1.37 | -7.7% | +18.1% | -4.5% |
| Arafura Rare Earths (ARU) | $0.19 | -$0.015 | -7.3% | +5.6% | -2.6% |
| Zip Co (ZIP) | $2.43 | -$0.19 | -7.2% | -4.7% | -42.8% |
| IperionX (IPX) | $2.89 | -$0.21 | -6.8% | -5.2% | -59.2% |
| MA Financial Group (MAF) | $5.35 | -$0.37 | -6.5% | -6.3% | -43.9% |
| Kingsgate Consolidated (KCN) | $5.17 | -$0.34 | -6.2% | +28.0% | +64.1% |
| Ora Banda Mining (OBM) | $1.455 | -$0.095 | -6.1% | +28.2% | +59.9% |
| Brazilian Rare Earths (BRE) | $3.64 | -$0.23 | -5.9% | -2.9% | +48.6% |
| Macmahon Holdings (MAH) | $0.96 | -$0.06 | -5.9% | +3.8% | +123.3% |
| Greatland Resources (GGP) | $11.10 | -$0.69 | -5.9% | +11.6% | +84.4% |
| St Barbara (SBM) | $0.725 | -$0.045 | -5.8% | +59.3% | +88.3% |
| Deep Yellow (DYL) | $1.54 | -$0.095 | -5.8% | +16.7% | -17.0% |
| Pinnacle Investment Management Group (PNI) | $14.28 | -$0.88 | -5.8% | -10.6% | -29.1% |
Chartwatch
Nasdaq Composite Index
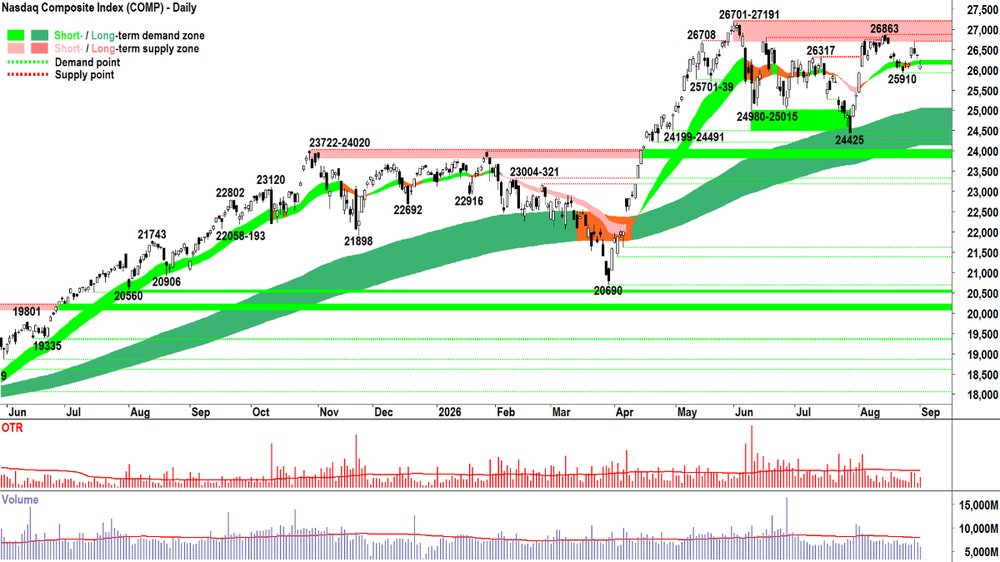
Nasdaq Composite Index chart
Analysis
Yesterday I wrote:
I expect you've already glanced at the chart above and ascertained in about one second:
ST Trend: D = S = P➡️ ⚖️
LT Trend: D > S = P⬆️ ✅
That was in relation to Monday's candle. If we repeat the process today, I doubt that any of us would still go with: "ST Trend: D = S = P➡️ ⚖️"
We have our fifth peak / point of supply below 27191, creating an expanding zone of supply that now sits at 26701-27191 — a seemingly impervious barrier.
The candles are increasingly supply-side in nature, black-bodied and or with upward pointing shadows. Tuesday delivered another close below the short term uptrend ribbon.
There's red flags right across the short term signals. 🚩
Volume suggests little demand side engagement or desire to repel the growing supply (i.e., no FOMO or BTD here!). So we must now conclude:
ST Trend: D = S = P⬇️ ⚠️
LT Trend: D > S = P⬆️ ✅
But the long term trend remains up, and as trend followers, we must not forget this. Indeed, given the charts of crude oil and 10-year bond yields shown in the Wrap section above, I 'd say the Comp is actually holding up pretty well all things considered! (Compare it to the Russell 2000 — as discussed in today's webinar, link to the recording on YouTube below 👇).
Good trading is all about balance. Reading the balance between demand and supply, but then responding to it with the correct balance between risk and reward.
Our tool for the last item is how much we choose to risk, and as you know, I'm already 50% cash on the Comp. I think it's the right balance given the present demand and supply signals.
If I see a nasty candle (long black, upward pointing shadow) closing below 25910, I'll likely cut my portfolio risk even further.
View
1/2RP. (RP = Risk Position — it reflects my personal allowable capital allocation limit for my investments in US stocks. So 1/2RP is 50%, 2/3RP is 67% and FRP is 100%).
Key Levels
26863 is the key point of supply vs 25910 and then the long term trend ribbon (presently 24131-25042) is the key point / zone of demand.
S&P/ASX 200 (XJO)
%20chart_2%20Sep.png)
S&P/ASX 200 (XJO) chart
Analysis
Full analysis in today's ChartWatch recording... but can I say, since that intra-candle update... a decent whack of downward pointing shadow has appeared! 🤞
Where did the BTD kick in? 🧐
Smack-bang at the 8940 point of demand. So, we can see how 9019 occurred smack-bang in the short term uptrend ribbon — i.e., excess demand exactly where we'd expect excess demand — and once that slipped, demand appeared at the next key point down...
It's nice when things just work!
But it's not nice when a level we pegged just yesterday (9019) as doing a great job of holding back supply — breaks! ⛓️💥
Good bounce from the lows today — but alas, the short term trend is unequivocally down now — and therefore it's not enough to avoid me cutting my portfolio RP. If only as a precautionary measure. ⚠️
Measured transition. No need to panic and to rush it...
View
I am cutting to 1/2RP on Australian shares (50% of my capital allocated to ASX shares can be invested, while 50% should be retained as cash).
Key Levels
9221-9297 is the key zone of supply to contend with, while 8940 is the next key point of demand).
(Glossary of acronyms! Old Tin Pot (OTP): S&P/ASX 200 | MOTN: More Often Than Not | FOMO: Fear Of Missing Out | HOFU: Holding On For Upside | BTD: Buy The Dip | NUTE: No Urgency To Enter | FOHO: Fear Of Holding On | STR: Sell The Rally | RP: Risk Position | FFS: Fund Flow Shenanigans!)
***CHARTWATCH LIVE WEBINARS — NEW VIDEO DROPPED!!! 📺🍿***
Is this the end for the stock market? This expert analyst is loading up on cash 💰
ChartWatch LIVE Webinar
ChartWatch LIVE Webinars – WEEKLY Wednesday's @ 12pm AEDT
Learn more about technical analysis and trend following through real case studies on ASX stocks. Australia's premier technical analyst, Carl Capolingua, shares his unique insights on stocks as requested by viewers. Ask about a company in your portfolio or anything related to trading and investing and get Carl's expert opinion.
Places are limited so >REGISTER NOW!<
Economy
TODAY
AUS June Quarter Gross Domestic Product (GDP)
Result: +0.4% vs +0.3% q/q vs +0.3% q/q in March (slightly better than expected)
LATER THIS WEEK
THURSDAY
No major economic data releases scheduled for this day...
FRIDAY
00:00 USA August ISM Services PMI (54.1 forecast vs 54.1 in July)
22:30 USA August Non-Farm Payroll
Non-Farm Employment Change: +58,000 forecast vs -23,000 in July
Unemployment Rate: 4.1% forecast vs 4.1% in July
Average Hourly Earnings: +0.3% m/m forecast vs +0.1% m/m in July
Interesting Movers
Trading higher
- COG Financial Services (COG) $1.62+7.0%
ASX filing today showed that Firetrail Investments has become a substantial shareholder in the company with a 5% stake.
- PYC Therapeutics (PYC) $2.43+6.1%
No news, today's move (on a terrible day for the broader market) is consistent with the prevailing short and long term uptrends. PYC is a regular in the ChartWatch ASX Scans Uptrends list. 📈
- Telix Pharmaceuticals (TLX) $15.69+2.8%
Announced the completion of patient enrollment in the Phase 3 study of its commercial imaging agents Illuccix and Gozellix for prostate cancer imaging in the pre-biopsy setting.
- Telstra Group (TLS) $4.72+1.9%
Released the findings of the external expert’s investigation of its 8 July mobile outage. Management assured investors that actions required to implement the findings are not expected to have any impact on FY27 guidance.
- Cochlear (COH) $136.45+1.6%
No news. Super strong healthcare sector today.
- Woodside Energy Group (WDS) $33.08+1.2%
No news. Super strong energy sector today.
Trading Lower
- Titomic (TTT) $0.13-23.5%
Announced a $16.5 million institutional placement at a 23.5% discount to last traded price on 28 August of $0.17.
- Andean Silver (ASL) $2.35-17.3%
Announced a $40 million institutional placement at a 13.7% discount to last traded price on 28 August of $2.45.
- Meteoric Resources (MEI) $0.19-9.5%
Reported H1 FY26 results.
- EQ Resources (EQR) $0.39-9.4%
Announced a production, sales and revenue update for August 2026.
- Zip Co (ZIP) $2.43-7.3%
ASX filing today showed that State Street increased its substantial shareholding in the company to 8.6% from 7.4%. The substantial holding appears largely attributable to securities-lending activity – potentially including the facilitation of short selling – rather than a conventional investment stake.
Broker Moves
Company | Broker | Action | Rating | Price Target |
|---|---|---|---|---|
AEMAdvanced Engineered Materials | Ord Minnett | Retained | Speculative Buy | $0.90 |
ALDAmpol | Jefferies | Downgraded | Hold(from Buy) | $45.00 |
ALLAristocrat Leisure | Macquarie | Retained | Outperform | $65.00 |
ANZANZ Group Holdings | Morgan Stanley | Retained | Overweight | $35.50 |
ARFArena REIT | UBS | Retained | Neutral | $2.60 |
CHCCharter Hall Group | UBS | Retained | Buy | $26.00 |
CKFCollins Foods | Citi | Retained | Neutral | $9.12(from $8.80) |
| Morgan Stanley | Retained | Equal Weight | $9.10 | |
| Morgans | Retained | Buy | $10.60 | |
| UBS | Retained | Neutral | $8.90 | |
CSLCSL | Morgan Stanley | Retained | Overweight | $172.00 |
| Ord Minnett | Retained | Hold | $168.00 | |
| UBS | Retained | Buy | $181.00 | |
CYLCatalyst Metals | Bell Potter | Retained | Buy | $12.80(from $13.25) |
DBIDalrymple Bay Infrastructure | Morgans | Upgraded | Accumulate(from Hold) | $5.47(from $5.43) |
DDRDicker Data | UBS | Retained | Neutral | $15.40(from $12.00) |
EIQEcho IQ | Morgans | Retained | Speculative Buy | $1.85 |
FDVFrontier Digital Ventures | Morgans | Retained | Buy | $0.61(from $0.56) |
GLFGemlife Communities Group | UBS | Retained | Buy | $5.70 |
GMGGoodman Group | Morgans | Retained | Accumulate | $33.20(from $36.00) |
| UBS | Retained | Buy | $33.66 | |
GNCGraincorp | Bell Potter | Retained | Buy | $7.15(from $5.90) |
| Macquarie | Retained | Outperform | $7.10(from $6.10) | |
| Ord Minnett | Retained | Buy | $7.95(from $7.25) | |
HMCHMC Capital | UBS | Retained | Buy | $3.60 |
ITSInfotrust | Bell Potter | Retained | Buy | $0.48(from $0.58) |
JBHJB Hi-Fi | Morgan Stanley | Retained | Underweight | $65.60 |
LICLifestyle Communities | UBS | Retained | Neutral | $5.70 |
LNWLight & Wonder Inc. | Macquarie | Retained | Outperform | $180.00 |
LTRLiontown | Ord Minnett | Retained | Hold | $1.50(from $1.40) |
NICNickel Industries | UBS | Retained | Buy | $1.20 |
NWHNRW Holdings | UBS | Retained | Buy | $8.50 |
NXGNexGen Energy (Canada) | UBS | Retained | Buy | $18.50 |
OCCOrthocell | Bell Potter | Retained | Speculative Buy | $1.13(from $1.19) |
PPEPeoplein | Morgans | Retained | Speculative Buy | $1.00(from $0.95) |
QALQualitas | Morgans | Retained | Buy | $3.90(from $3.50) |
REAREA Group | Citi | Downgraded | Neutral(from Buy) | $191.30(from $183.30) |
RFFRural Funds Group | UBS | Retained | Buy | $2.30 |
RMYRMA Global | Bell Potter | Retained | Speculative Buy | $0.05(from $0.07) |
SCGScentre Group | UBS | Retained | Neutral | $3.85 |
SIQSmartgroup Corporation | Morgans | Upgraded | Accumulate(from Hold) | $12.15(from $9.25) |
TLSTelstra Group | Ord Minnett | Upgraded | Buy(from Accumulate) | $5.50 |
TPWTemple & Webster Group | Morgan Stanley | Retained | Equal Weight | $4.80 |
TTXTetratherix | Ord Minnett | Downgraded | Sell(from Hold) | $5.30 |
VCXVicinity Centres | UBS | Retained | Neutral | $2.70 |
WESWesfarmers | Morgan Stanley | Retained | Underweight | $78.00 |
Scans
Top Gainers
Code | Company | Last | % Chg |
|---|---|---|---|
| KAO | Kaoko Metals Ltd | $1.85 | +151.70% |
| CP8 | Canadian Phosphate Ltd | $0.155 | +24.00% |
| AMS | Atomos Ltd | $0.018 | +20.00% |
| PR2 | Piche Resources Ltd | $0.062 | +19.23% |
| GRV | Greenvale Energy Ltd | $0.032 | +18.52% |
Top Fallers
Code | Company | Last | % Chg |
|---|---|---|---|
| STG | Straker Ltd | $0.115 | -50.00% |
| TTT | Titomic Ltd | $0.13 | -23.53% |
| IRI | Integrated Research Ltd | $0.29 | -19.44% |
| GLH | Global Health Ltd | $0.05 | -19.36% |
| NME | NEX Metals Exploration Ltd | $0.014 | -17.65% |
52 Week Highs
Code | Company | Last | % Chg |
|---|---|---|---|
| KAO | Kaoko Metals Ltd | $1.85 | +151.70% |
| SOP | Synertec Corporation Ltd | $0.069 | +7.81% |
| AXR | Axiant Resources Ltd | $0.215 | +7.50% |
| KOA | The Koala Company Ltd | $4.56 | +7.29% |
| PYC | PYC Therapeutics Ltd | $2.43 | +6.11% |
52 Week Lows
Code | Company | Last | % Chg |
|---|---|---|---|
| STG | Straker Ltd | $0.115 | -50.00% |
| TTT | Titomic Ltd | $0.13 | -23.53% |
| GLH | Global Health Ltd | $0.05 | -19.36% |
| RMY | Rma Global Ltd | $0.019 | -17.39% |
| DTZ | DOTZ Nano Ltd | $0.016 | -15.79% |
Near Highs
Code | Company | Last | % Chg |
|---|---|---|---|
| RHC | Ramsay Health Care Ltd | $52.38 | +0.29% |
| AN3PI | Australia and New Zealand Banking Group Ltd | $103.60 | +0.17% |
| PCI | Perpetual Credit Income Trust | $1.10 | 0.00% |
| WVOL | iShares MSCI World Ex Aust Minimum Volatility ETF | $45.96 | -0.11% |
| PYC | PYC Therapeutics Ltd | $2.43 | +6.11% |
Relative Strength Index (RSI) Oversold
Code | Company | Last | % Chg |
|---|---|---|---|
| KGN | Kogan.com Ltd | $3.45 | -4.17% |
| PWR | Peter Warren Automotive Holdings Ltd | $0.80 | -1.54% |
| VAP | Vanguard Australian Property Securities INDEX ETF | $85.89 | -0.80% |
| HDN | Homeco Daily Needs REIT | $1.105 | +0.46% |
| ABB | Aussie Broadband Ltd | $4.19 | -2.10% |
