News | Market Wraps
Evening Wrap: ASX 200 resets Santa Rally hopes with solid gain as banks, tech, and property stocks shine, energy and resources dip
The S&P/ASX 200 closed 64.5 points higher, up 0.78%.

Mentioned
The S&P/ASX 200 closed 64.5 points higher, up 0.78%.
Today’s long white-bodied candle with high session close is a fantastic example of how bull markets can and do reassert themselves – even after a run of seemingly despairing trading sessions.
Volumes (or lack thereof) suggest things are really beginning to wind down for the holidays. Despite this, I note it’s not uncommon to see big moves on low volumes in the last few trading sessions of the year. Let’s hope today’s ⬜🕯️ is a sign of things to come!
Click/scroll through for the usual reporting of the major sector and stock-specific moves, the broker responses to them, as well as all of the key upcoming economic data in tonight's Evening Wrap.
Also, I have detailed technical analysis on and in today's ChartWatch.
But – before we get into it – What do you think will influence the ASX in 2025, and who will win big? Get first access to top picks, prediction, and exclusive expert insights for 2025, by having your say in Livewire’s Outlook Series Survey. How valuable are the results? Well, our readers’ stock picks delivered, big: +20% on ASX stocks, +25% on ETFs!
Let's dive in!
Today in Review
Tue 17 Dec 24, 4:57pm (AEST)
Name | Value | % Chg |
|---|---|---|
Major Indices | ||
| ASX 200 | 8,314.0 | +0.78% |
| All Ords | 8,558.6 | +0.76% |
| Small Ords | 3,110.1 | +0.69% |
| All Tech | 3,863.6 | +1.23% |
| Emerging Companies | 2,239.3 | +0.02% |
Currency | ||
| AUD/USD | 0.6353 | -0.28% |
US Futures | ||
| S&P 500 | 6,073.0 | -0.12% |
| Dow Jones | 43,705.0 | -0.14% |
| Nasdaq | 22,103.5 | -0.03% |
Name | Value | % Chg |
|---|---|---|
Sector | ||
| Industrials | 7,617.5 | +1.34% |
| Real Estate | 3,851.4 | +1.32% |
| Information Technology | 2,764.0 | +1.31% |
| Financials | 8,874.0 | +1.16% |
| Health Care | 45,238.3 | +1.13% |
| Consumer Discretionary | 4,016.8 | +1.01% |
| Communication Services | 1,660.6 | +0.72% |
| Consumer Staples | 11,843.8 | +0.38% |
| Materials | 16,555.3 | -0.10% |
| Utilities | 8,819.4 | -0.20% |
| Energy | 8,334.8 | -1.09% |
Markets

ASX 200 Session Chart
The S&P/ASX 200 (XJO) finished 64.5 points higher at 8,314.0, 0.94% from its session low and just 0.16% from its high. In the broader-based S&P/ASX 300 (XKO), advancers beat decliners by to 195 to 88 – finally landing on the right side of the 2-to-1 equation (it’s been roughly 2-to-1 losers-to-gainers for a couple of weeks now!).
Back to typical bull market price action today, as in white candle stuff…and back to the 2024 playbook of strong Information Technology (XIJ) (+1.3%) and strong Financials (XFJ) (+1.2%).
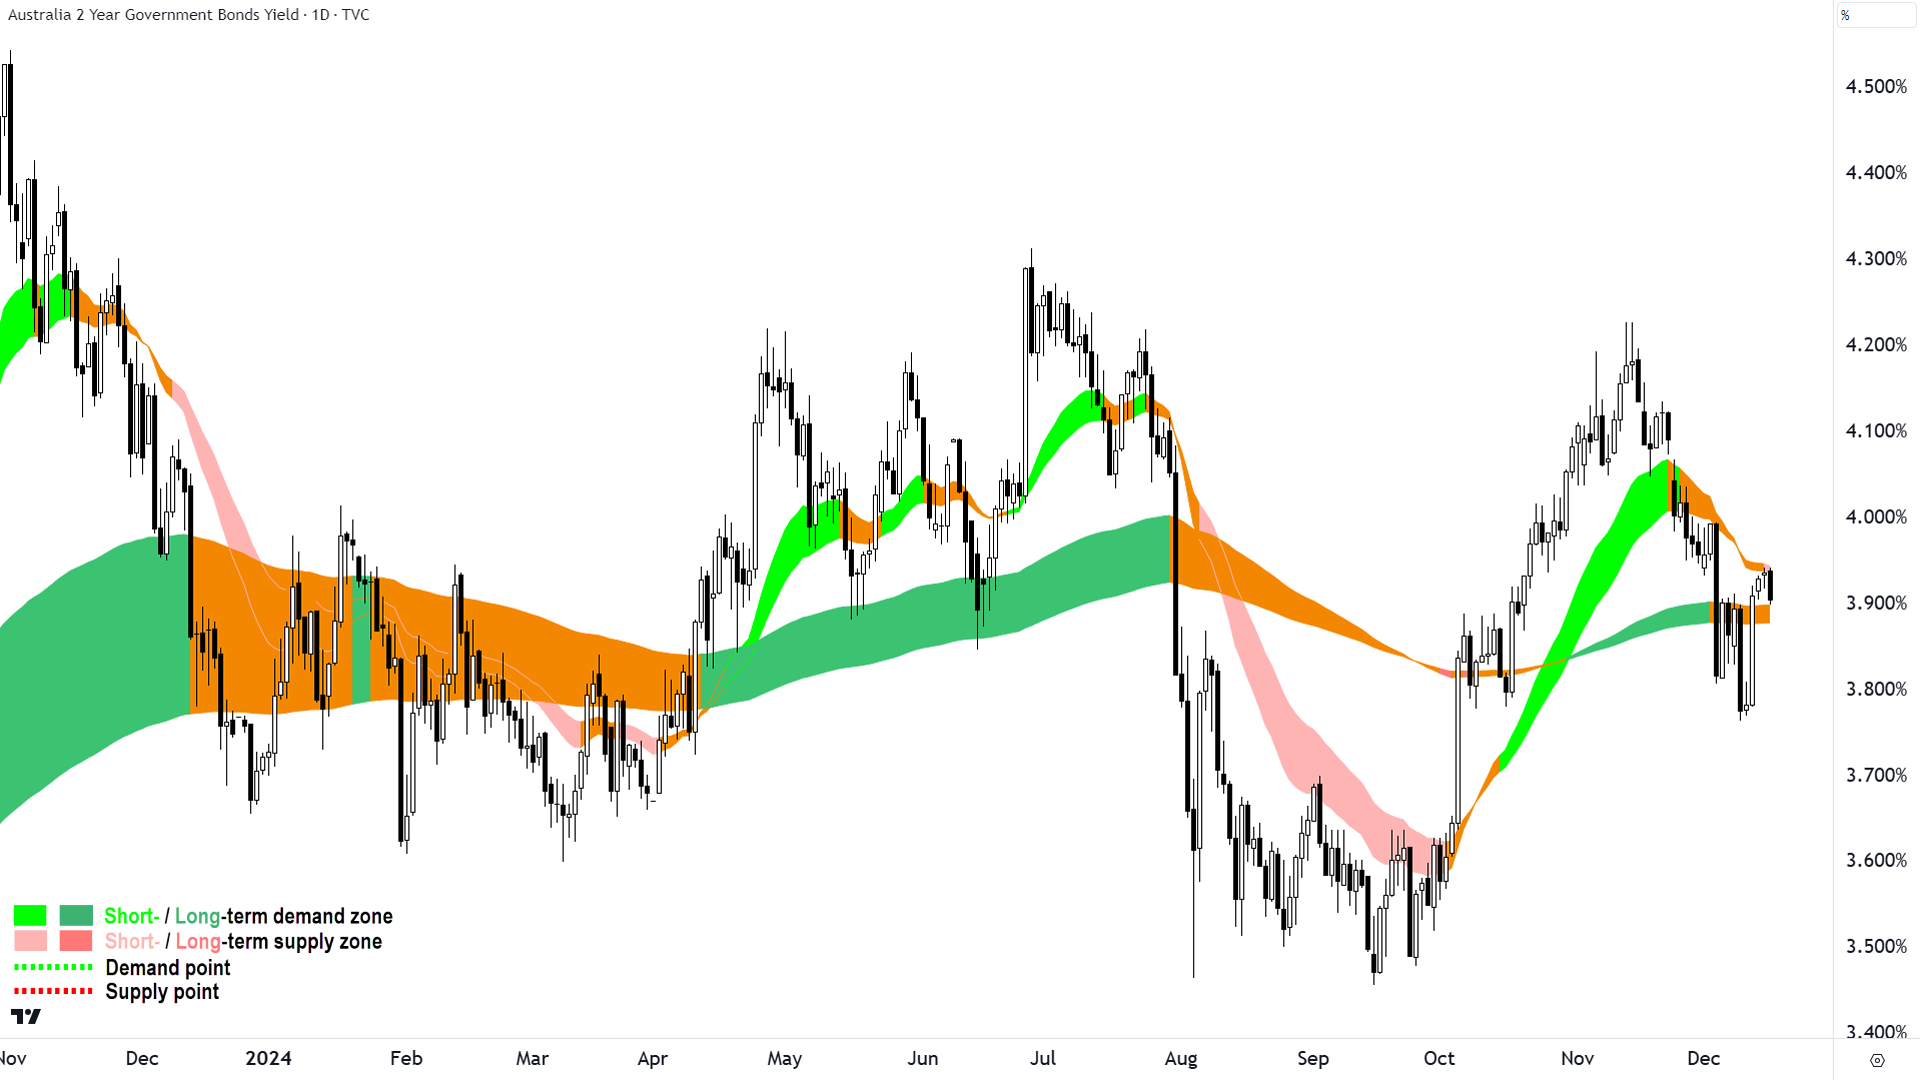
Also chipping in after a welcome dip in risk-free market yields (which had climbed uncomfortably higher over the last few sessions – largely contributing to recent stocks’ weakness – see chart below 👇) were the interest rate sensitives of Real Estate (XRE) (+1.3%) (high debt levels), Health Care (XHJ) (+1.1%) (high PE), and Consumer Discretionary (XDJ) (+1.0%) (consumption focussed).

Australian 2-Year Government Bond Yield Chart 16 December 2024. Source: TradingView (click here for full size image)
Broad-based Industrials (XNJ) (+1.3%) was actually the best performing major ASX sector today.
Company | Last Price | Change $ | Change % | 1mo % | 1yr % |
|---|---|---|---|---|---|
Pexa Group (PXA) | $13.33 | +$1.01 | +8.2% | -1.8% | +7.6% |
Mesoblast (MSB) | $1.940 | +$0.11 | +6.0% | +23.2% | +557.6% |
Siteminder (SDR) | $6.29 | +$0.21 | +3.5% | -5.1% | +21.4% |
AUB Group (AUB) | $31.25 | +$1.01 | +3.3% | -1.1% | +13.8% |
Universal Store (UNI) | $8.02 | +$0.24 | +3.1% | +1.4% | +106.7% |
Ventia Services Group (VNT) | $3.45 | +$0.1 | +3.0% | -25.8% | +14.2% |
HMC Capital (HMC) | $10.02 | +$0.29 | +3.0% | -12.9% | +84.9% |
Infratil (IFT) | $11.30 | +$0.32 | +2.9% | +0.4% | +19.6% |
IPH (IPH) | $5.08 | +$0.14 | +2.8% | -1.6% | -23.4% |
Megaport (MP1) | $7.87 | +$0.21 | +2.7% | -5.5% | -21.5% |
Austal (ASB) | $3.00 | +$0.08 | +2.7% | -5.7% | +69.5% |
ARB Corporation (ARB) | $39.98 | +$1.04 | +2.7% | -3.5% | +12.7% |
Pro Medicus (PME) | $257.24 | +$6.56 | +2.6% | +23.4% | +175.8% |
ALS (ALQ) | $15.54 | +$0.39 | +2.6% | +6.0% | +21.7% |
Eagers Automotive (APE) | $11.99 | +$0.29 | +2.5% | +2.6% | -11.8% |
Super Retail Group (SUL) | $14.99 | +$0.36 | +2.5% | -1.2% | +2.3% |
Lovisa (LOV) | $30.21 | +$0.69 | +2.3% | +7.9% | +34.1% |
Resmed Inc (RMD) | $38.27 | +$0.82 | +2.2% | +4.6% | +48.1% |
JB HI-FI (JBH) | $96.02 | +$2.01 | +2.1% | +7.6% | +92.8% |
Breville Group (BRG) | $36.36 | +$0.76 | +2.1% | +13.1% | +39.5% |
Healius (HLS) | $1.435 | +$0.03 | +2.1% | +7.9% | -5.6% |
Nextdc (NXT) | $15.54 | +$0.32 | +2.1% | -5.9% | +20.5% |
Catapult Group International (CAT) | $3.54 | +$0.07 | +2.0% | +15.3% | +154.7% |
Reliance Worldwide Corporation (RWC) | $5.21 | +$0.1 | +2.0% | -5.4% | +24.0% |
Ansell (ANN) | $33.57 | +$0.64 | +1.9% | +3.4% | +35.7% |
Today’s best performing stocks from today’s best performing ASX sectors
The other half of the 2024 playbook has been sell / short sell Energy (XEJ) (-1.1%) and Resources (XJR) (-0.32%). They were again the two worst performing major ASX sectors today.
Karoon Energy (ASX: KAR) (-9.7%) was the lowlight of the XEJ. It announced that it had halted production at its flagship Baúna Project in Brazil due to an “incident” involving a mooring system. The bottom line means total production guidance for CY24 has been amended to 10.1-10.3 MMboe from the previously guided 10.5-10.8 MMboe.
%20chart%2017%20December%202024.png)
Karoon Energy (KAR) price chart (click here for full size image)
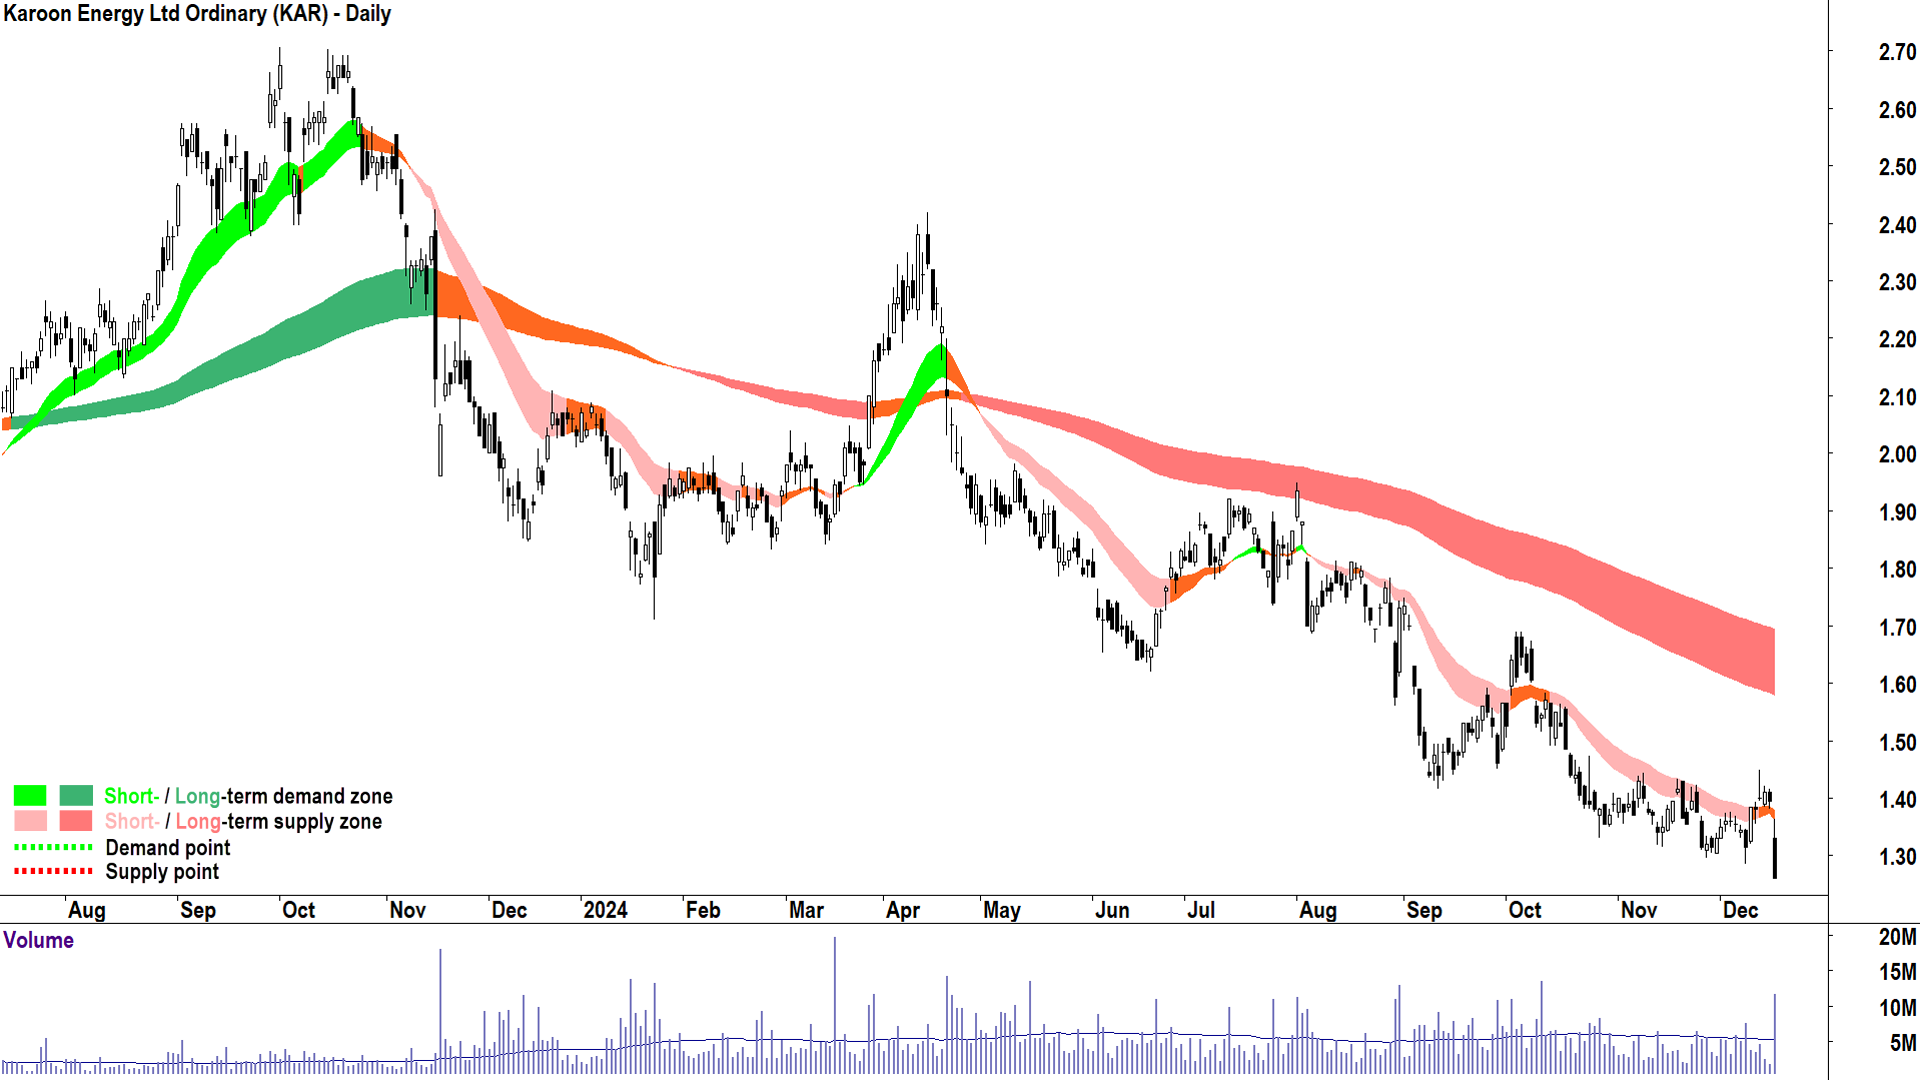
It’s funny (or not – depending on how you pick your stocks) how often the news tends to break in the direction of the trend. For those who don’t follow my ChartWatch ASX Scans, KAR has earned the dubious honour of Feature Downtrend (i.e., highest conviction) 24 times since I started publishing Scans in late-May. Tomorrow will be 25...
Company | Last Price | Change $ | Change % | 1mo % | 1yr % |
|---|---|---|---|---|---|
Karoon Energy (KAR) | $1.260 | -$0.135 | -9.7% | -9.7% | -34.0% |
WA1 Resources (WA1) | $13.98 | -$1.13 | -7.5% | -3.8% | +87.1% |
Deep Yellow (DYL) | $1.180 | -$0.05 | -4.1% | -3.3% | +22.9% |
Whitehaven Coal (WHC) | $6.31 | -$0.21 | -3.2% | -7.7% | -11.5% |
Nickel Industries (NIC) | $0.855 | -$0.025 | -2.8% | -8.1% | +27.6% |
Southern Cross Gold (SXG) | $3.93 | -$0.11 | -2.7% | +57.2% | +299.2% |
Firefly Metals (FFM) | $0.935 | -$0.025 | -2.6% | -11.0% | +78.1% |
Vulcan Energy Resources (VUL) | $5.77 | -$0.15 | -2.5% | -5.4% | +173.5% |
Resolute Mining (RSG) | $0.390 | -$0.01 | -2.5% | +2.6% | -7.1% |
Paladin Energy (PDN) | $7.47 | -$0.15 | -2.0% | -2.9% | -21.8% |
Boss Energy (BOE) | $2.36 | -$0.04 | -1.7% | -23.1% | -39.9% |
De Grey Mining (DEG) | $1.845 | -$0.03 | -1.6% | +31.3% | +51.6% |
Spartan Resources (SPR) | $1.400 | -$0.02 | -1.4% | +27.9% | +196.6% |
New Hope Corporation (NHC) | $4.96 | -$0.07 | -1.4% | +3.1% | -1.6% |
Lynas Rare Earths (LYC) | $6.64 | -$0.09 | -1.3% | -7.1% | +4.2% |
Coronado Global Resources (CRN) | $0.815 | -$0.01 | -1.2% | -16.8% | -52.3% |
Mineral Resources (MIN) | $34.69 | -$0.41 | -1.2% | -2.2% | -47.0% |
Woodside Energy Group (WDS) | $23.52 | -$0.24 | -1.0% | -2.4% | -22.0% |
Pilbara Minerals (PLS) | $2.17 | -$0.02 | -0.9% | -29.8% | -42.7% |
Ampol (ALD) | $27.12 | -$0.23 | -0.8% | -4.8% | -21.9% |
Today’s worst performing stocks from today’s worst performing ASX sectors
Overall volumes were 15% below their 3-month average, which itself has been steadily trending lower since October (see ChartWatch section below for full technical analysis of the S&P/ASX 200).
Things are really beginning to wind down for the holidays. Despite this, I note it’s not uncommon to see big moves on low volumes in the last few trading sessions of the year. Let’s hope today’s ⬜🕯️ is a sign of things to come!
ChartWatch
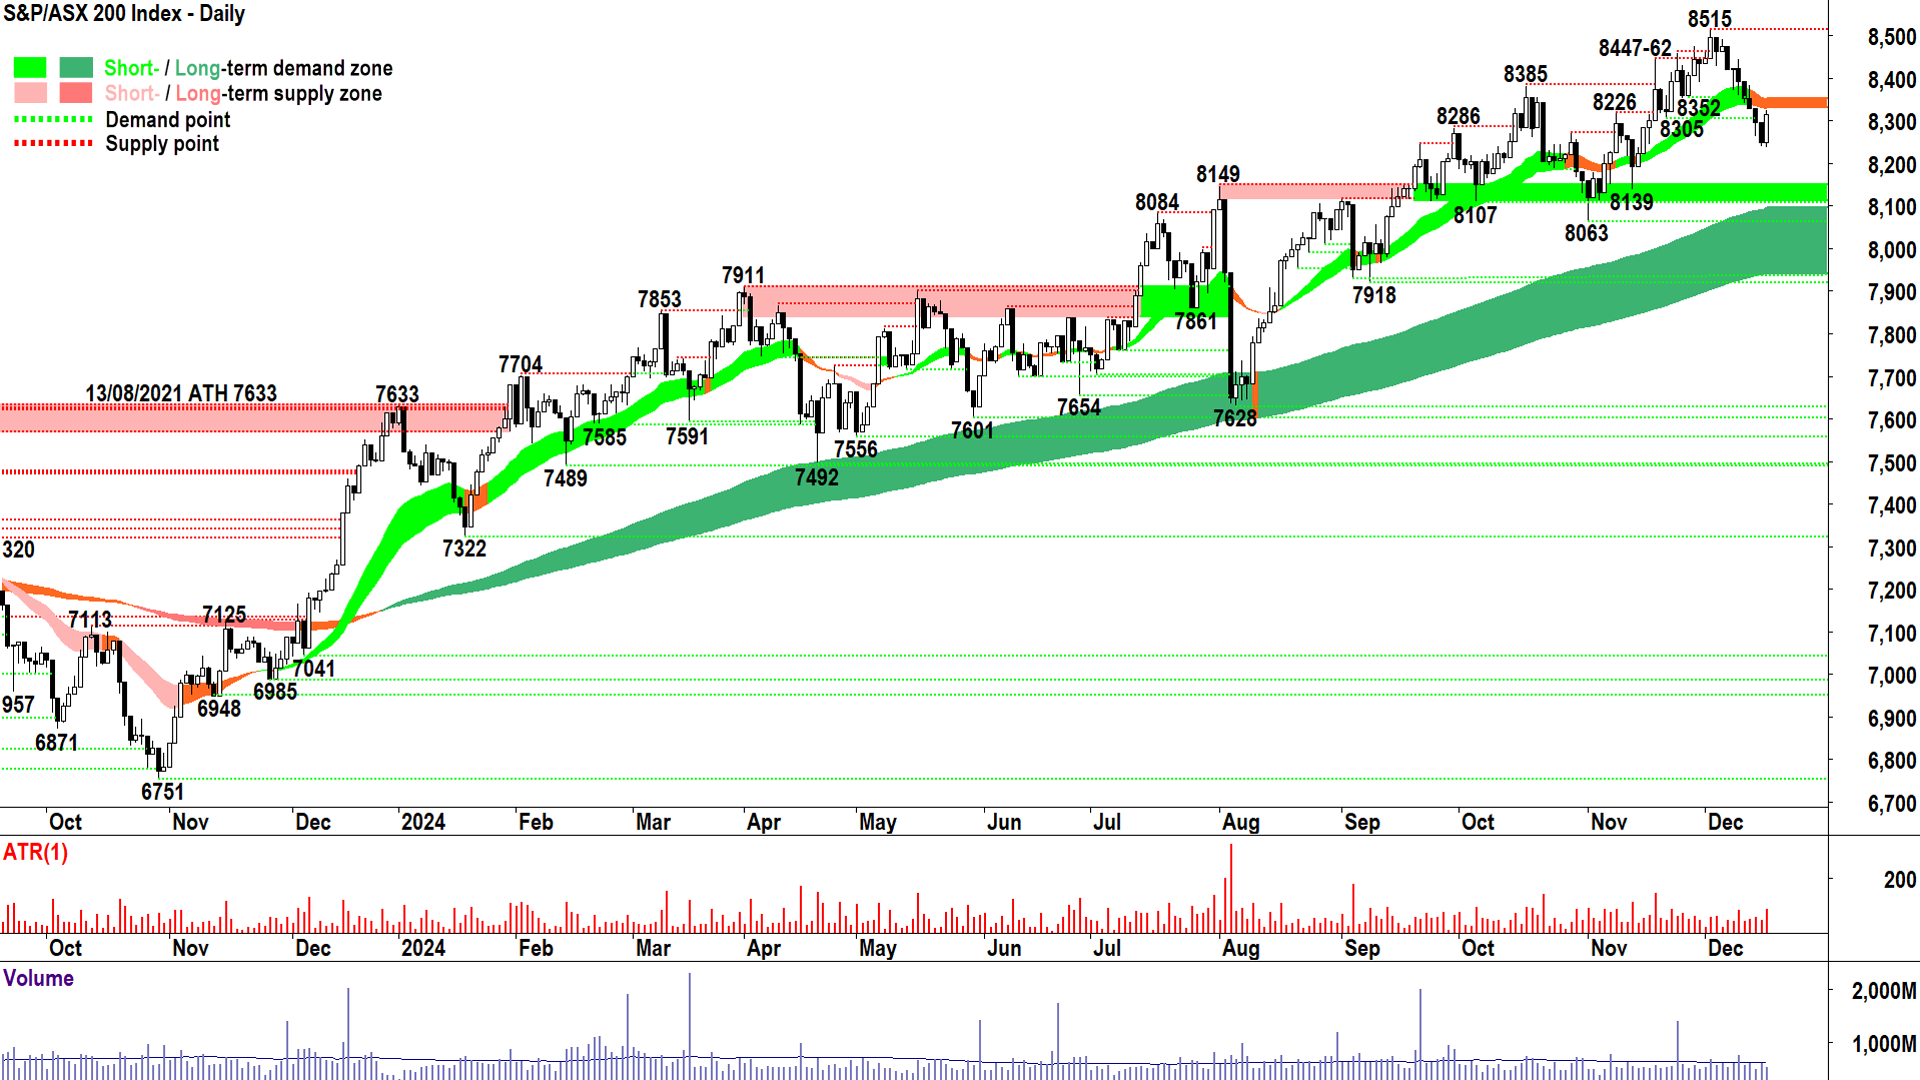
S&P/ASX 200 (XJO)
%20chart%2017%20December%202024.png)
That's more like it! ⬜🕯️=✅ (click here for full size image)
The last time we covered was in ChartWatch in the Evening Wrap on 13 December.
In that update, I offered: “The fingerprints of demand (i.e., white-bodied candles and or downward pointing shadows) could reappear at any time – as is typically the case in a bull market. Yes, it’s still a bull market – refer to the that bloody big dark green caterpillar crawling from the bottom left to the top right of your screen!”
Today’s long white-bodied candle with high session close is a fantastic example of how bull markets can and do reassert themselves – even after a run of seemingly despairing trading sessions.
It’s a good start. We’re not completely out of the black candle woods just yet. Ideally we can quickly knock the 50% balance point of the recent 8515–8236 dip, kicking in at 8375 (vs today's close = 8314).
Even better, we see continued strong demand-side candles and a return to rising peaks and rising troughs.
Assuming this is Plan A, the points of demand to contend with are the short term trend ribbon at 8330-8352, and then the all time high at 8515.
If it’s to be Plan B, that is, this rally fails and we confirm lower peaks and lower troughs = the supply side remains very much in control of the short term price, then today’s low of 8236 will be a critical point of demand.
A close below it sets us up for an inevitable test of 8063-8149 static demand / dynamic demand of the long term uptrend ribbon, presently kicking in around 8095.
My tip: Trust the bull until the candles and price action give you a clear reason not to.
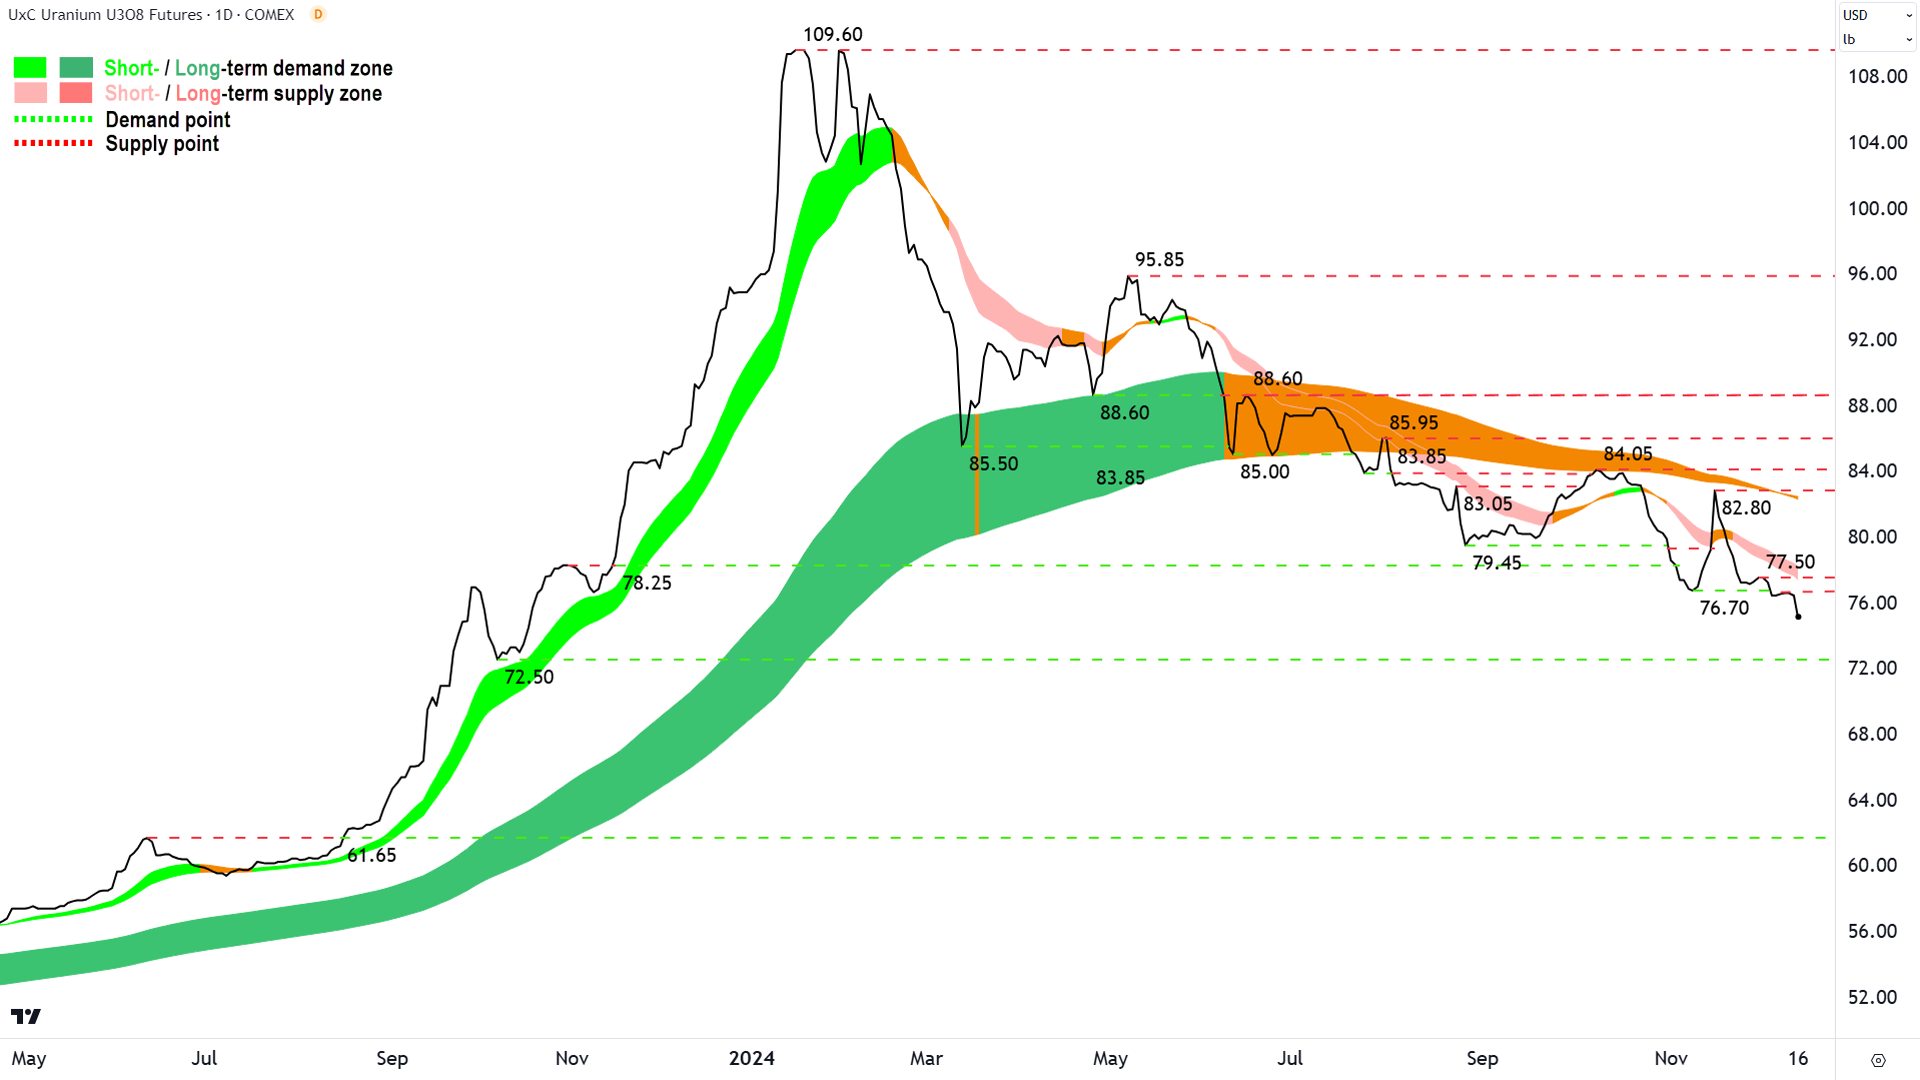
Uranium Futures (Front month, back-adjusted) COMEX
%20COMEX%20Chart%2016%20December%202024.png)
A trend extends...📉 (click here for full size image)
The last time we covered was in ChartWatch in the Evening Wrap on 9 December.
In that update, I noted (much like in prior updates) “The trends are clear. The price action is clear. Together, they indicate convincing supply-side control of the price in the short and long term.”
That’s the thing about trends – they tend to extend.
Until eventually they bend.
Then they end.
And then they start all over again...♻️
The uranium chart shows well established short and long term downtrends. The trend ribbons continue to act as reliable zones of dynamic supply (i.e., they tend to define where sell the rally activity reasserts). The price action is falling peaks and falling troughs (i.e., demonstrating supply reinforcement and demand removal respectively).
76.70 has gone. 72.50 is the next logical point of demand to be tested by the prevailing state of excess supply.
76.70 transitions to a point of supply. Above it lies points of demand at 77.50, a likely more impenetrable 82.80, and then a band of points between 84.05 and 88.60.
I could not change my bearish view on the uranium price until:
⏹️ The price action returns to rising peaks and rising troughs (i.e., supply removal and demand reinforcement)
⏹️ The price closes above the short term uptrend ribbon and the short term uptrend ribbon begins to act as an area of dynamic demand
⏹️ The price closes above the long term uptrend ribbon and the long term uptrend ribbon begins to act as an area of dynamic demand
⏹️ The price closes above at least 82.80 (with above mentioned check boxes ticked), but preferably, above 84.05 with a higher trough formed at or above the long term uptrend ribbon
Economy
Today
AUS Westpac Consumer Sentiment December
-2% to 92.8 vs +5.3% in November
Readings below 100 indicate general pessimism among consumers, so consumers grew increasingly pessimistic again, albeit still far less so than earlier in the year when the index bottomed around 77 in March.
Westpac's Head of Australian Macro-Forecasting, Matthew Hassan, blamed "renewed concerns about the economic outlook" for the latest deterioration in consumer sentiment
"The biggest pull-back was around expectations for the economy. The ‘economic outlook, next 12 months’ sub-index dropped 9.6% to 91.2, while the ‘economic outlook, next 5 years’ sub-index fell 7.9% to 95.9. Both sub-indexes unwound about half of the rally seen over the previous two months." –Hassan

Westpac–Melbourne Institute Consumer Sentiment Index dipped 2% to 92.8 in December from 94.6 in November. Sources: Westpac Economics, Melbourne Institute
Later this week
Wednesday
00:30 USA Core Retail Sales November (+0.4% forecast vs +0.1% in October)
01:15 Industrial Production November (+0.2% forecast vs -0.3% in October)
02:00 USA NAHB Housing Market Index (47 forecast vs 46 in October)
Thursday
06:00 US Federal Reserve FOMC meeting (-0.25% to 4.50% forecast)
Plus FOMC Economic Projections
Plus FOMC / Chairman Jerome Powell press conference (06:30)
TBA JPN Bank of Japan (BOJ) Policy Rate (no change at <0.25% forecast)
Plus BOJ Governor Kazuo Ueda press conference
UK Bank of England MPC Official Bank Rate (no change at 4.75% forecast)
Friday
00:30 USA Final GDP September Qtr (+2.8% forecast vs +2.8% June Qtr)
02:00 USA Existing Home Sales November (4.11 million forecast vs 3.96 million in October)
12:15 CHN 1-yr & 5-yr Prime Rate (no change at 3.1% and 3.6% respectively)
Saturday
00:30 Core PCE Price Index November (+0.2% m/m and 2.9% p.a. forecast vs +0.3% m/m and 2.8% p.a. in October)
00:30 Personal Income & Personal Spending November (+0.2% m/m and +0.4% m/m in October & +0.5% m/m and +0.4% m/m in October respectively)
Latest News
Interesting Movers
Trading higher
+8.2% Pexa Group (PXA) - PEXA appoints Russell Cohen as PEXA Group MD & CEO
+6.0% Mesoblast (MSB) - No news, rise is consistent with prevailing short and long term uptrends, a regular in ChartWatch ASX Scans Uptrends list 🔎📈
+5.2% Cettire (CTT) - Becoming a substantial holder (JP Morgan)
+4.3% Westgold Resources (WGX) - Fortnum Expansion Study, rise is consistent with prevailing short and long term uptrends, a regular in ChartWatch ASX Scans Uptrends list 🔎📈
+4.2% Alpha HPA (A4N) - Contractual Close Reached for Senior Debt Funding
+3.5% Siteminder (SDR) - No news, rise is consistent with prevailing long term uptrend, has bounced perfectly off long term uptrend ribbon 🔎📈
+3.4% Novonix (NVX) - Conditional Commitment for US$754M Loan from US DOE LPO, bounce is small compared to recent declines…
Trading lower
-9.8% Data#3 (DTL) - DTL adapting to Microsoft partner incentive program changes, fall is consistent with prevailing short and long term downtrends, a regular in ChartWatch ASX Scans Downtrends list 🔎📉
-9.7% Karoon Energy (KAR) - Bauna Shutdown and Updated Guidance, fall is consistent with prevailing short and long term downtrends, a regular in ChartWatch ASX Scans Downtrends list 🔎📉
-7.5% WA1 Resources (WA1) - No news, at risk of closing below long term uptrend ribbon
-5.8% Tyro Payments (TYR) - No news, fall is consistent with prevailing short and long term downtrends, a regular in ChartWatch ASX Scans Downtrends list 🔎📉
-4.1% Deep Yellow (DYL) - No news, fall is consistent with prevailing short and long term downtrends, a regular in ChartWatch ASX Scans Downtrends list 🔎📉
-4.0% Appen (APX) - No news, second day of sharp falls…
-3.8% Weebit Nano (WBT) - No news, second day of sharp falls…
-3.6% Sayona Mining (SYA) - No news, fall is consistent with prevailing short and long term downtrends, a regular in ChartWatch ASX Scans Downtrends list 🔎📉
-3.2% Whitehaven Coal (WHC) - No news, fall is consistent with prevailing short and long term downtrends, a regular in ChartWatch ASX Scans Downtrends list 🔎📉
-2.6% Lotus Resources (LOT) - Change in substantial holding (decrease), fall is consistent with prevailing short and long term downtrends, a regular in ChartWatch ASX Scans Downtrends list 🔎📉
-2.5% Resolute Mining (RSG) - No news, fall is consistent with prevailing short and long term downtrends, a regular in ChartWatch ASX Scans Downtrends list 🔎📉
-2.4% The Star Entertainment Group (SGR) - Group CFO appointment & Company Secretary update, fall is consistent with prevailing short and long term downtrends, a regular in ChartWatch ASX Scans Downtrends list 🔎📉
-2.4% Platinum Asset Management (PTM) - No news, fall is consistent with prevailing short and long term downtrends, a regular in ChartWatch ASX Scans Downtrends list 🔎📉
-2.1% Elders (ELD) - No news, fall is consistent with prevailing short and long term downtrends, a regular in ChartWatch ASX Scans Downtrends list 🔎📉
Broker Notes
Austin Engineering (ANG)
Retained at buy at Shaw and Partners; Price Target: $0.70
American West Metals (AW1)
Retained at buy at Shaw and Partners; Price Target: $0.32
Antipa Minerals (AZY)
Retained at buy at Shaw and Partners; Price Target: $0.04
Boab Metals (BML)
Retained at buy at Shaw and Partners; Price Target: $0.40
Boss Energy (BOE)
Retained at overweight at Macquarie; Price Target: $4.50 from $4.60
Catapult Group International (CAT)
Initiated at overweight at Morgan Stanley; Price Target: $4.45
Cobram Estate Olives (CBO)
Retained at buy at Ord Minnett; Price Target: $2.22 from $1.98
Retained at buy at Shaw and Partners; Price Target: $2.25 from $2.10
Data#3 (DTL)
Retained at overweight at Morgan Stanley; Price Target: $10.00
Retained at neutral at UBS; Price Target: $7.30 from $8.00
EVT (EVT)
Initiated at overweight at Morgan Stanley; Price Target: $13.30
Retained at buy at Ord Minnett; Price Target: $13.70 from $14.05
Integral Diagnostics (IDX)
Retained at overweight at Macquarie; Price Target: $3.50 from $2.90
Insignia Financial (IFL)
Retained at hold at Ord Minnett; Price Target: $3.70 from $3.25
Infratil (IFT)
Initiated at overweight at Morgan Stanley; Price Target: NZ$15.00
Imdex (IMD)
Retained at sell at Citi; Price Target: $1.95
Iperionx (IPX)
Retained at buy at Canaccord Genuity; Price Target $6.65 from $4.45
Arcadium Lithium (LTM)
Retained at hold at Bell Potter; Price Target: $8.70
Opthea (OPT)
Initiated at buy at Canaccord Genuity; Price Target: $1.25
Pro Medicus (PME)
Initiated at overweight at Morgan Stanley; Price Target: $300.00
Peter Warren Automotive (PWR)
Retained at equal-weight at Morgan Stanley; Price Target: $1.80 from $1.50
Rio Tinto (RIO)
Retained at buy at Ord Minnett; Price Target: $131.00
Ramelius Resources (RMS)
Retained at overweight at Macquarie; Price Target: $2.60 from $2.70
South32 (S32)
Retained at buy at Ord Minnett; Price Target: $4.25
Sigma Healthcare (SIG)
Upgraded to add from hold at Morgans; Price Target: $2.98 from $2.21
Spark New Zealand (SPK)
Retained to equal-weight from overweight at Morgan Stanley; Price Target: NZ$3.20 from $5.00
Southern Cross Electrical Engineering (SXE)
Retained at buy at Bell Potter; Price Target: $2.25
Retained at buy at Shaw and Partners; Price Target: $2.10
Tyro Payments (TYR)
Retained to underweight from equal-weight at Morgan Stanley; Price Target: $0.80 from $1.25
Vitrafy Life Sciences (VFY)
Initiated at buy at Bell Potter; Price Target: $2.36
Worley (WOR)
Downgraded to sector perform from outperform at RBC Capital Markets; Price Target: $15.50 from $19.00
Wisetech Global (WTC)
Retained at buy at Citi; Price Target: $124.50
Scans
Top Gainers
Code | Company | Last | % Chg |
|---|---|---|---|
| PAT | Patriot Lithium Ltd | $0.049 | +44.12% |
| EWC | Energy World Corporation Ltd | $0.023 | +35.29% |
| PNT | Panther Metals Ltd | $0.011 | +22.22% |
| CLE | Cyclone Metals Ltd | $0.045 | +21.62% |
| ERG | Eneco Refresh Ltd | $0.013 | +18.18% |
Top Fallers
Code | Company | Last | % Chg |
|---|---|---|---|
| VMT | Vmoto Ltd | $0.07 | -33.33% |
| OCT | Octava Minerals Ltd | $0.125 | -28.57% |
| ICE | Icetana Ltd | $0.02 | -20.00% |
| BUS | Bubalus Resources Ltd | $0.11 | -18.52% |
| RLF | RLF Agtech Ltd | $0.04 | -18.37% |
52 Week Highs
Code | Company | Last | % Chg |
|---|---|---|---|
| CLE | Cyclone Metals Ltd | $0.045 | +21.62% |
| SHG | Singular Health Group Ltd | $0.20 | +14.29% |
| BTM | Breakthrough Minerals Ltd | $0.075 | +13.64% |
| RZI | RAIZ Invest Ltd | $0.59 | +12.38% |
| NVQ | Noviqtech Ltd | $0.16 | +10.35% |
52 Week Lows
Code | Company | Last | % Chg |
|---|---|---|---|
| VMT | Vmoto Ltd | $0.07 | -33.33% |
| RVT | Richmond Vanadium Technology Ltd | $0.21 | -17.65% |
| PR2 | Piche Resources Ltd | $0.084 | -16.00% |
| SLM | Solis Minerals Ltd | $0.069 | -13.75% |
| KAL | Kalgoorlie Gold Mining Ltd | $0.018 | -10.00% |
Near Highs
Code | Company | Last | % Chg |
|---|---|---|---|
| PCI | Perpetual Credit Income Trust | $1.165 | -0.43% |
| WVOL | Ishares MSCI World Ex Aust Minimum Volatility ETF | $42.21 | -0.28% |
| GCI | Gryphon Capital Income Trust | $2.05 | -0.49% |
| VVLU | Vanguard Global Value Equity Active ETF | $74.85 | -0.57% |
| IHD | Ishares S&P/ASX DIV Opportunities Esg Screened ETF | $14.54 | +0.76% |
Relative Strength Index (RSI) Oversold
Code | Company | Last | % Chg |
|---|---|---|---|
| FUEL | Betashares Global Energy Companies ETF - Currency Hedged | $6.23 | -2.20% |
| BOE | Boss Energy Ltd | $2.36 | -1.67% |
| MGR | Mirvac Group | $1.96 | +1.03% |
| RTH | Ras Technology Holdings Ltd | $0.86 | -4.44% |
| CU6 | Clarity Pharmaceuticals Ltd | $4.61 | +0.66% |
