News | Market Wraps
Evening Wrap: ASX 200 slides to worst close in nearly a month as investors fret rates, global growth. Can we bounce back next week?

Mentioned
The S&P/ASX 200 closed 34.3 points lower, down 0.41%.
A tough day at the office for Aussie investors. Ahem, a tough week. Today's close on the benchmark S&P/ASX200 was the lowest since November 18, and marks 6 out of 8 losing sessions since last Tuesday's 8514.5 record high (remember that?) 🤔
Before we get into it – how would you like to receive first access to your fellow readers’ top picks, predictions, and exclusive expert insights for 2025? You can do that by having your say in Livewire’s Outlook Series Survey. And you may even win one of three Livewire Live 2025 tickets, valued at $300! Complete the quick survey.
Click/scroll through for the usual reporting of the major sector and stock-specific moves, the broker responses to them, as well as all of the key upcoming economic data in tonight's Evening Wrap.
Also, I have detailed technical analysis on the S&P/ASX 200 in today's ChartWatch.
Let's dive in!
Today in Review
Fri 13 Dec 24, 5:38pm (AEST)
Name | Value | % Chg |
|---|---|---|
Major Indices | ||
| ASX 200 | 8,296.0 | -0.41% |
| All Ords | 8,550.3 | -0.43% |
| Small Ords | 3,133.9 | -0.12% |
| All Tech | 3,854.6 | -0.04% |
| Emerging Companies | 2,280.6 | -0.53% |
Currency | ||
| AUD/USD | 0.6358 | -0.16% |
US Futures | ||
| S&P 500 | 6,067.25 | +0.11% |
| Dow Jones | 43,971.0 | -0.01% |
| Nasdaq | 21,736.5 | +0.39% |
Name | Value | % Chg |
|---|---|---|
Sector | ||
| Energy | 8,483.6 | +0.44% |
| Financials | 8,757.0 | +0.16% |
| Industrials | 7,538.9 | -0.02% |
| Consumer Discretionary | 3,982.0 | -0.10% |
| Health Care | 44,818.2 | -0.19% |
| Consumer Staples | 11,786.9 | -0.20% |
| Communication Services | 1,661.3 | -0.32% |
| Information Technology | 2,755.5 | -0.44% |
| Utilities | 8,838.4 | -0.47% |
| Real Estate | 3,853.4 | -0.77% |
| Materials | 16,917.6 | -1.84% |
Markets

ASX 200 Session Chart
The S&P/ASX 200 (XJO) finished 34.3 points lower at 8,296.0, roughly smack–bang smack–bang at the mid-point of the session's 0.89% range. In the broader-based S&P/ASX 300 (XKO), advancers lagged decliners by 117 to 158.
For the week, the XJO finished down 124.9 points or 1.5% lower, 1.8% from its intraweek high and just 0.39% from its intraweek low.
A tough day at the office for Aussie investors. Ahem, a tough week. Tuesday to Friday inclusive were down, and Monday's gain was just 2 points. The only positive is that we didn't close right on the low today – which actually means something given things really could have gone pear-shaped on a risk-off Friday afternoon.
Interest rates are again the main bug-bear for investors. More specifically, whether we'll get more of them / sooner or fewer of them / later. FYI, the first scenario is the good one.
Yesterday's substantially stronger than expected Aussie employment data torpedoed the good vibes felt only just Tuesday after the substantially more dovish then expected RBA meeting. It was that kind of week!
See below the chart of the benchmark short term risk-free Australian bond yield, the 2-year Government bond.

Australian 2 Year Government Bond Yield Chart 13 December 2024. Source: TradingView
Note the big black candle Tues (good for stocks) vs the big white candle Thurs (bad for stocks). It appears markets just unfactored an earlier first rate cut in 2025.
US risk-free yields are also creeping back up, together with the local bond market move, spelled trouble for the so-called "interest rate sensitive" sectors of Real Estate Investment Trusts (XPJ) (-0.77%), Utilities (XUJ) (-0.47%), and (high-PE) Information Technology (XIJ) (-0.44%).
The pop in risk-free yields also triggered a sharp sell off in precious metals overnight, thus hobbling the local Gold (XGD) (-2.2%) sub-index. More broadly, flows also cut into base metals and iron ore pricing, thus dragging Resources (XJR) (-1.5%) lower today. Check the table below for a schedule of the damage...
Company | Last Price | Change $ | Change % | 1mo % | 1yr % |
|---|---|---|---|---|---|
Vulcan Energy Resources (VUL) | $5.82 | -$0.82 | -12.3% | -0.5% | +159.8% |
HMC Capital (HMC) | $11.27 | -$0.88 | -7.2% | +1.3% | +106.0% |
Southern Cross Gold (SXG) | $3.88 | -$0.28 | -6.7% | +29.8% | +306.5% |
Ora Banda Mining (OBM) | $0.675 | -$0.04 | -5.6% | -11.2% | +181.3% |
Bellevue Gold (BGL) | $1.305 | -$0.065 | -4.7% | +4.8% | -22.1% |
Firefly Metals (FFM) | $1.045 | -$0.05 | -4.6% | +0.5% | +90.0% |
Pilbara Minerals (PLS) | $2.26 | -$0.1 | -4.2% | -29.2% | -35.4% |
Sandfire Resources (SFR) | $9.96 | -$0.44 | -4.2% | +0.1% | +55.6% |
Regis Resources (RRL) | $2.75 | -$0.12 | -4.2% | +14.6% | +45.1% |
Ramelius Resources (RMS) | $2.30 | -$0.1 | -4.2% | +17.9% | +44.7% |
Fortescue (FMG) | $19.48 | -$0.74 | -3.7% | +8.6% | -26.1% |
Evolution Mining (EVN) | $5.05 | -$0.19 | -3.6% | +12.5% | +39.9% |
Stanmore Resources (SMR) | $3.07 | -$0.11 | -3.5% | +0.3% | -19.6% |
Mineral Resources (MIN) | $35.80 | -$1.11 | -3.0% | +1.4% | -41.3% |
Develop Global (DVP) | $2.31 | -$0.07 | -2.9% | +17.0% | -20.3% |
Emerald Resources (EMR) | $3.71 | -$0.11 | -2.9% | +6.3% | +43.2% |
Coronado Global Resources (CRN) | $0.875 | -$0.025 | -2.8% | -7.9% | -48.7% |
Rio Tinto (RIO) | $120.72 | -$3.43 | -2.8% | +6.0% | -6.1% |
Westgold Resources (WGX) | $2.98 | -$0.08 | -2.6% | +11.6% | +39.9% |
Gold Road Resources (GOR) | $2.11 | -$0.05 | -2.3% | +23.8% | +12.2% |
De Grey Mining (DEG) | $1.900 | -$0.045 | -2.3% | +41.8% | +44.4% |
Perseus Mining (PRU) | $2.74 | -$0.06 | -2.1% | +10.9% | +48.5% |
West African Resources (WAF) | $1.605 | -$0.035 | -2.1% | +16.3% | +73.5% |
Spartan Resources (SPR) | $1.415 | -$0.03 | -2.1% | +20.4% | +190.6% |
Lynas Rare Earths (LYC) | $6.86 | -$0.14 | -2.0% | -6.5% | +13.8% |
Today's worst performing stocks from the worst performing ASX sectors
It wasn't all bad news. Just mostly! Somehow the Energy (XEJ) (+0.44%) sector found some friends today with majors Woodside Energy Group (ASX: WDS) (+0.46%) and Santos (ASX: STO) (+0.46%) rebounding from perilous chart levels. The stalwart Financials (XFJ) (+0.16%) sector also scraped a gain.
Company | Last Price | Change $ | Change % | 1mo % | 1yr % |
|---|---|---|---|---|---|
Insignia Financial (IFL) | $3.61 | +$0.21 | +6.2% | +15.0% | +65.6% |
Paladin Energy (PDN) | $7.95 | +$0.36 | +4.7% | +8.3% | -16.8% |
Bannerman Energy (BMN) | $3.01 | +$0.13 | +4.5% | +9.1% | +16.2% |
Boss Energy (BOE) | $2.61 | +$0.1 | +4.0% | -12.1% | -31.7% |
Deep Yellow (DYL) | $1.280 | +$0.035 | +2.8% | +9.9% | +26.7% |
Pinnacle Investment Management Group (PNI) | $23.51 | +$0.47 | +2.0% | +11.6% | +144.6% |
Beach Energy (BPT) | $1.360 | +$0.025 | +1.9% | +9.7% | -9.6% |
Regal Partners (RPL) | $3.81 | +$0.06 | +1.6% | +1.3% | +58.8% |
AMP (AMP) | $1.585 | +$0.02 | +1.3% | +5.3% | +71.4% |
Netwealth Group (NWL) | $29.07 | +$0.32 | +1.1% | -4.2% | +96.6% |
Hub24 (HUB) | $70.82 | +$0.63 | +0.9% | -1.0% | +109.5% |
Magellan Financial Group (MFG) | $11.25 | +$0.1 | +0.9% | +9.4% | +28.1% |
Yancoal Australia (YAL) | $6.45 | +$0.05 | +0.8% | +5.0% | +31.6% |
Karoon Energy (KAR) | $1.410 | +$0.01 | +0.7% | +4.4% | -25.2% |
Westpac Banking Corporation (WBC) | $32.17 | +$0.21 | +0.7% | -0.8% | +47.4% |
New Hope Corporation (NHC) | $5.01 | +$0.03 | +0.6% | +7.7% | -1.4% |
Challenger (CGF) | $6.09 | +$0.03 | +0.5% | -1.9% | +3.0% |
Santos (STO) | $6.49 | +$0.03 | +0.5% | -3.0% | -11.2% |
Woodside Energy Group (WDS) | $23.89 | +$0.11 | +0.5% | +1.0% | -21.3% |
Commonwealth Bank of Australia (CBA) | $158.21 | +$0.69 | +0.4% | +3.5% | +47.3% |
Today's best performing stocks from the best performing ASX sectors
ChartWatch
S&P/ASX 200 (XJO)
%20chart%2013%20December%202024.png)
Fingerprints of supply all over that short term trend! (click here for full size image)
The last time we covered the XJO was in ChartWatch in the Evening Wrap on 3 December.
In that update, coincidentally the logging of the all time high on the index, I noted “There remains absolutely nothing in these technicals (trends, dynamic demand reinforcement, price action, candles) to suggest anything but demand-side control.”
Remember, I am a trend follower, not a trend prognosticator. I can only tell you what I see. I can’t see the future.
Fast forward to today’s candle, a black one and one of 6 out of 8 black candles since – and you could say the fingerprints of supply are all over this one now.
I also note that today’s close has neutralised the short term trend ribbon. We also closed below that trend ribbon and below points of demand 8352 and 8305. Supply fingerprints x 4!
Today’s downward pointing shadow is really the only positive I can take away from the short term price action. It does smack of some buy the dip activity – which is commendable on any Friday afternoon – particularly one that is facing as many uncertainties as this one.
Demand is now at 8063-8139. It should be a sold zone of demand given how much price action congestion there is around there (i.e., plenty evidence of historical demand). Of course, we won’t know just how good it actually is until we get there and see the candles.
Perhaps we don’t, though. The fingerprints of demand (i.e., white-bodied candles and or downward pointing shadows) could reappear at any time – as is typically the case in a bull market. Yes, it’s still a bull market – refer to the that bloody big dark green caterpillar crawling from the bottom left to the top right of your screen!
%20weekly%20chart%2013%20December%202024.png)
S&P-ASX 200 (XJO) weekly chart (click here for full size image)
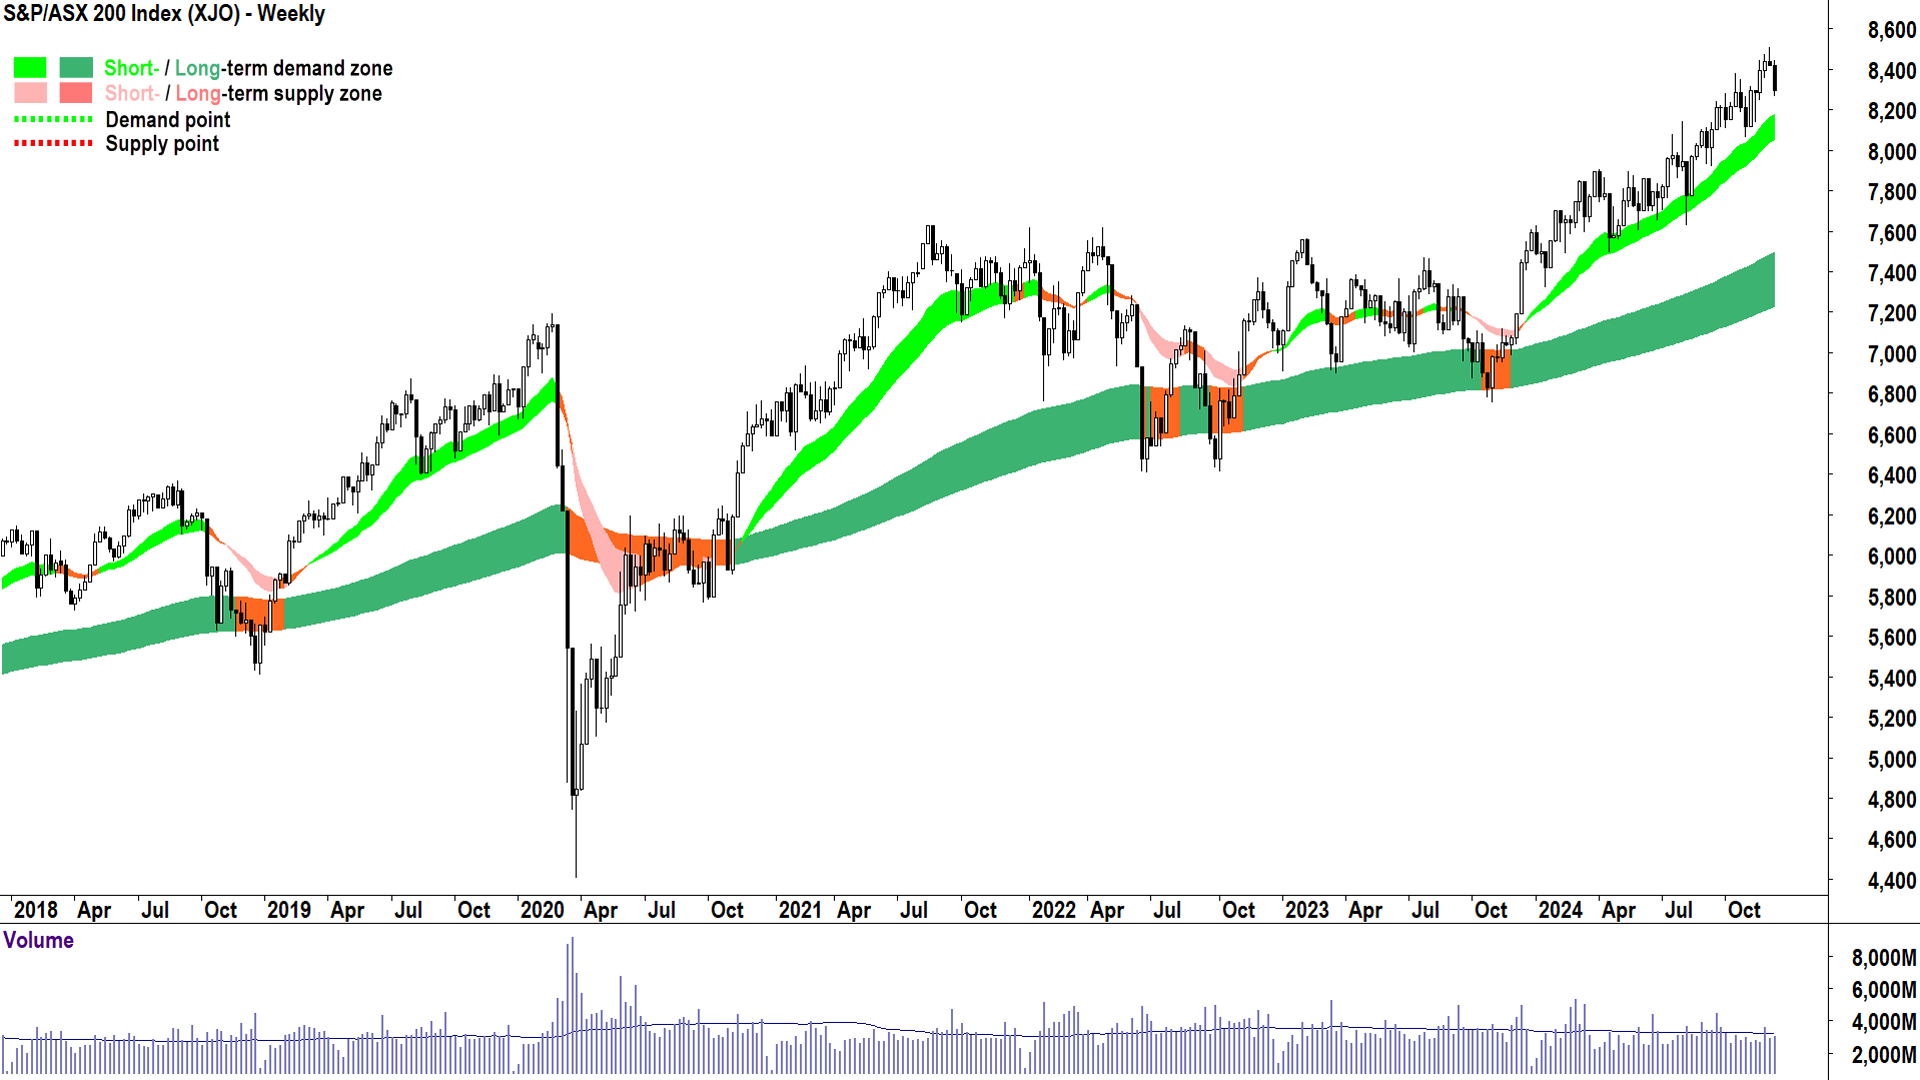
On the topic of the longer term trend, let’s zoom out to the weekly chart. Two things are evident here. Good news and bad news.
First the bad news. The last two candles are credible showings of supply-side control (last week with its upward pointing shadow and this week’s black body) form part of a typically reliable bearish reversal pattern.
There is a high probability that the price continues to move lower in line with this pattern.
The good news is that both short and long term uptrend here are impeccable. If there is going to be a continued rotation, it is likely to find demand-side support in that short term uptrend ribbon, kicking in around 8175. Note that’s just above the expected demand zone from the daily chart.
We just have to watch the candles from here. You know which ones are the good ones and which aren’t.
Economy
Today
There weren't any major data releases in our time zone today
Later this week
Saturday
TBA CHN New Loans November (950 billion forecast vs 500 billion in October)
TBA CHN M2 Money Supply November y/y (7.6% p.a. forecast vs +7.5% p.a. in October)
Latest News
Interesting Movers
Trading higher
+13.9% Mesoblast (MSB) - No news, mentioned in an article on major US news site as a potential beneficiary of potential changes in the regulatory environment for stem-cell researchers, rise is consistent with prevailing short and long term uptrends, a regular in ChartWatch ASX Scans Uptrends list 🔎📈.
+11.3% Appen (APX) - No news, rise is consistent with prevailing short and long term uptrends, watch out for it rejoining ChartWatch ASX Scans Uptrends list on Monday 🔎📈.
+10.8% Ventia Services Group (VNT) - Rebound from massive drop following yesterday's ACCC proceedings against Ventia, several broker updates today, some good - some not so good, see Broker Moves section below for more information.
+8.2% Iress (IRE) - Iress reaffirms FY24 guidance.
+7.4% Weebit Nano (WBT) - No news, rise is consistent with prevailing short term uptrend, long term trend transitioning from down to up, watch out for it rejoining ChartWatch ASX Scans Uptrends list on Monday 🔎📈.
+6.2% Insignia Financial (IFL) - IFL Receives Indicative Non-binding Proposal.
+4.7% Paladin Energy (PDN) - No news, reaffirmed at BUY by two brokers today (note though both cut their price targets on the stock), see Broker Moves section below for more information.
+4.5% Bannerman Energy (BMN) - No news, generally higher ASX uranium sector today on PDN and BOE coverage.
+4.4% Ricegrowers (SGLLV) - SunRice Group joins S&P/ASX Agribusiness Index, rise is consistent with prevailing short and long term uptrends, a regular in ChartWatch ASX Scans Uptrends list 🔎📈.
+4.4% Tabcorp (TAH) - No news, rise is consistent with prevailing short term uptrend, traded inside the long term trend ribbon which has neutralised.
+4.1% 29METALS (29M) - No news, rebounding from massive falls this week.
+4.0% Boss Energy (BOE) - No news, reaffirmed at BUY by UBS today (note though UBS cut its price targets on the stock), see Broker Moves section below for more information.
+2.8% Deep Yellow (DYL) - No news, ditto generally higher ASX uranium sector today on PDN and BOE coverage.
Trading lower
-12.3% Vulcan Energy Resources (VUL) - EIB Board approves participation in Phase One financing and Vulcan successfully completes $164m placement, closed below short term trend ribbon.
-9.5% Paradigm Biopharmaceuticals. (PAR) - No news, but similar theme - price pops, management launches discounted placement.
-7.2% HMC Capital (HMC) - No news, but also suffering after a placement.
-6.3% Sayona Mining (SYA) - No news, fall is consistent with prevailing short and long term downtrends, a regular in ChartWatch ASX Scans Downtrends list 🔎📉.
-6.1% Latin Resources (LRS) - No news, linked to PLS due to all-scrip takeover…PLS down today.
-5.6% Ora Banda Mining (OBM) - No news, generally weaker ASX gold sector today on sharp falls in gold price Thursday (vs rising risk-free market yields!).
-5.4% Southern Cross Electrical Engineering (SXE) - No news, fall is consistent with prevailing short term downtrend, long term trend transitioning from down to down, watch out for it in ChartWatch ASX Scans Downtrends list on Monday 🔎📉.
-5.3% Syrah Resources (SYR) - Continued negative response to yesterday's Balama force majeure, fall is consistent with prevailing short and long term downtrends, a regular in ChartWatch ASX Scans Downtrends list 🔎📉.
-4.7% Bellevue Gold (BGL) - No news, ditto tough day for ASX gold stocks….
-4.6% Firefly Metals (FFM) - No news, ditto tough day for ASX gold stocks…plus weaker copper and base metals prices Thursday.
-4.4% Alpha HPA (A4N) - No news, continued negative response to 11-Dec Alpha Sapphire Update.
-4.2% Pilbara Minerals (PLS) - No news, CEO $1.1 million on market purchase euphoria lasted a total of 1 day…fall is consistent with prevailing short and long term downtrends, a regular in ChartWatch ASX Scans Downtrends list 🔎📉.
-4.2% Sandfire Resources (SFR) - No news, ditto lower copper and base metals prices Thursday.
-4.2% Regis Resources (RRL) - No news, ditto tough day for ASX gold stocks….
-4.2% Ramelius Resources (RMS) - Change in substantial holder notice for SPR, plus ditto tough day for ASX gold stocks….
Broker Notes
Astral Resources (AAR)
Retained at buy at Canaccord Genuity; Price Target: $0.39
Adriatic Metals (ADT)
Retained at buy at Canaccord Genuity; Price Target: $4.80
Australian Finance Group (AFG)
Retained at neutral at Macquarie; Price Target: $1.61
Aurizon (AZJ)
Retained at neutral at UBS; Price Target: $3.35 from $3.40
Boss Energy (BOE)
Retained at buy at Bell Potter; Price Target: $4.70 from $5.70
Retained at buy at UBS; Price Target: $3.40 from $3.50
Domain Australia (DHG)
Retained at neutral at Citi; Price Target: $3.20
Fortescue (FMG)
Downgraded to hold from add at Morgans; Price Target: $20.50 from $21.50
Genesis Minerals (GMD)
Initiated at buy at Citi; Price Target: $3.20
GPT Group (GPT)
Retained at buy at Citi; Price Target: $4.90
Hotel Property Investments (HPI)
Downgraded to hold from add at Morgans; Price Target: $3.75 from $3.69
IPH (IPH)
Retained at buy at Ord Minnett; Price Target: $6.40
Liberty Financial Group (LFG)
Retained at outperform at Macquarie; Price Target: $4.05 from $4.00
Lendlease Group (LLC)
Retained at neutral at Macquarie; Price Target: $7.00 from $8.03
Nextdc (NXT)
Retained at buy at Citi; Price Target: $20.00
Paladin Energy (PDN)
Retained at buy at UBS; Price Target: $9.90 from $10.40
Pepper Money (PPM)
Retained at outperform at Macquarie; Price Target: $1.60 from $1.55
Platinum Asset Management (PTM)
Retained at sell at UBS; Price Target: $0.64 from $0.91
Peter Warren Automotive (PWR)
Retained at neutral at Citi; Price Target: $1.60 from $1.70
Retained at neutral at E&P; Price Target: $1.59 from $2.29
Downgraded to overweight from buy at Jarden; Price Target: $1.90 from $2.10
Retained at buy at Jefferies; Price Target: $1.95
Retained at equal-weight at Morgan Stanley; Price Target: $1.80
Readytech (RDY)
Initiated at add at Morgans; Price Target: $3.74
REA Group (REA)
Retained at buy at Citi; Price Target: $230.00
Rio Tinto (RIO)
CORRECTION: Retained at buy at Citi; Price Target: $134.00 from $123.00 (in yesterday's update was incorrectly stated as $123.00 from $134.00)
Resimac Group (RMC)
Retained at neutral at Macquarie; Price Target: $1.05 from $1.00
Resmed Inc (RMD)
Retained at neutral at Citi; Price Target: $38.00
Ramelius Resources (RMS)
Retained at buy at Shaw and Partners; Price Target: $2.73
Stockland (SGP)
Retained at neutral at Macquarie; Price Target: $5.26 from $3.98
Sigma Healthcare (SIG)
Downgraded to underperform from hold at Jefferies; Price Target: $1.85 from $1.60
Syrah Resources (SYR)
Downgraded to neutral from overweight at Jarden; Price Target: $0.30 from $0.57
Telix Pharmaceuticals (TLX)
Retained at buy at UBS; Price Target: $32.00
Ventia Services Group (VNT)
Retained at outperform at Macquarie; Price Target: $4.26 from $4.66
Downgraded to hold from add at Morgans; Price Target: $3.30 from $4.80
Retained at hold at Ord Minnett; Price Target: $4.35
Scans
Top Gainers
Code | Company | Last | % Chg |
|---|---|---|---|
| KEY | KEY Petroleum Ltd | $0.067 | +34.00% |
| HRE | Heavy Rare EARTHS Ltd | $0.034 | +30.77% |
| XGL | Xamble Group Ltd | $0.026 | +30.00% |
| ION | Iondrive Ltd | $0.026 | +23.81% |
| AXE | Archer Materials Ltd | $0.345 | +21.05% |
Top Fallers
Code | Company | Last | % Chg |
|---|---|---|---|
| NC6 | Nanollose Ltd | $0.019 | -36.67% |
| IBX | Imagion Biosystems Ltd | $0.024 | -33.33% |
| MKR | Manuka Resources Ltd | $0.028 | -30.00% |
| LSA | Lachlan Star Ltd | $0.063 | -21.25% |
| EQN | Equinox Resources Ltd | $0.105 | -19.23% |
52 Week Highs
Code | Company | Last | % Chg |
|---|---|---|---|
| ION | Iondrive Ltd | $0.026 | +23.81% |
| OCC | Orthocell Ltd | $1.145 | +10.10% |
| OCT | Octava Minerals Ltd | $0.18 | +9.09% |
| ART | Airtasker Ltd | $0.39 | +8.33% |
| RZI | RAIZ Invest Ltd | $0.50 | +6.38% |
52 Week Lows
Code | Company | Last | % Chg |
|---|---|---|---|
| IBX | Imagion Biosystems Ltd | $0.024 | -33.33% |
| EQN | Equinox Resources Ltd | $0.105 | -19.23% |
| NWM | Norwest Minerals Ltd | $0.017 | -19.05% |
| BSN | Basin Energy Ltd | $0.016 | -13.89% |
| LOM | Lucapa Diamond Company Ltd | $0.02 | -13.04% |
Near Highs
Code | Company | Last | % Chg |
|---|---|---|---|
| PCI | Perpetual Credit Income Trust | $1.165 | 0.00% |
| WVOL | Ishares MSCI World Ex Aust Minimum Volatility ETF | $42.53 | 0.00% |
| GCI | Gryphon Capital Income Trust | $2.05 | 0.00% |
| VVLU | Vanguard Global Value Equity Active ETF | $75.56 | 0.00% |
| IHD | Ishares S&P/ASX DIV Opportunities Esg Screened ETF | $14.51 | 0.00% |
Relative Strength Index (RSI) Oversold
Code | Company | Last | % Chg |
|---|---|---|---|
| WPR | Waypoint REIT | $2.36 | -0.42% |
| CUV | Clinuvel Pharmaceuticals Ltd | $12.13 | -2.57% |
| MGR | Mirvac Group | $1.995 | -1.24% |
| CU6 | Clarity Pharmaceuticals Ltd | $4.54 | -0.22% |
| ARF | Arena REIT | $3.79 | +0.53% |
