

The ASX 200 fell as separate reports on consumer confidence and business confidence both plunged — petrol prices topping $2 per litre, an imminent RBA rate hike, and an increasingly acute housing downturn delivering a triple blow to domestic sentiment. Defensives and commodity producers with offshore pricing held their ground; everything exposed to the Australian consumer or rate cycle was sold off...
Be sure to click/scroll through for the usual reporting of the major sector and stock-specific moves, the broker responses to them, as well as all the key economic data in tonight's Evening Wrap. Also, I have detailed technical analysis on the Nasdaq Composite and the S&P/ASX 200 in today's ChartWatch.
Let’s dive in!
Today in Review
Name | Value | % Chg |
|---|---|---|
Major Indices | ||
| ASX 200 | 8,920.8 | -1.00% |
| All Ords | 9,114.3 | -0.94% |
| Small Ords | 3,459.7 | -0.33% |
| All Tech | 2,865.1 | -1.65% |
| Emerging Companies | 3,107.1 | +0.02% |
Currency | ||
| AUD/USD | 0.721 | -0.12% |
US Futures | ||
| S&P 500 | 7,722.0 | -0.42% |
| Dow Jones | 53,440.0 | -0.57% |
| Nasdaq | 29,565.25 | +0.14% |
Name | Value | % Chg |
|---|---|---|
Sector | ||
| Utilities | 10,125.8 | +0.59% |
| Health Care | 31,837.3 | +0.45% |
| Energy | 11,093.0 | +0.22% |
| Materials | 25,246.9 | -0.57% |
| Communication Services | 1,570.2 | -0.73% |
| Industrials | 8,016.1 | -0.74% |
| Consumer Staples | 13,137.6 | -1.32% |
| Real Estate | 3,323.9 | -1.47% |
| Financials | 9,225.7 | -1.64% |
| Information Technology | 1,730.4 | -1.76% |
| Consumer Discretionary | 3,564.3 | -1.88% |
ASX 200 Intraday Chart
%20intraday%20chart_8%20Sep.png)
Markets
The S&P/ASX 200 (XJO) finished 90.1 points lower at 8,920.8, 1.0% from its session high and just 0.07% from its high/low. The wipeout was similarly reflected in the broader-based S&P/ASX 300 (XKO) where advancers lagged decliners by a disturbing 86 to 196.
Utilities (XUJ) (+0.6%) was the session's best sector — when investors are nervous about the domestic economy, they reach for businesses supplying the essentials of daily life regardless of what happens to consumer spending. Origin Energy (ORG) (+0.9%) and AGL Energy (AGL) (+0.6%) both advanced.
Health Care (XHJ) (+0.4%) caught the same defensive flows — hey, share market up or down, we're still going to get sick! Telix Pharmaceuticals (TLX) (+1.5%), Healius (HLS) (+1.1%), Ansell (ANN) (+1.0%), and CSL (CSL) (+0.9%) all firmed. Probably also here, the sector caught some flows from blue chip consumer and financial stocks. Fund managers want to say invested, but they just don't want the consumer-facing risk...
Energy (XEJ) (+0.2%) held modestly positive as ICE Brent crude futures gained 1.6% to US$98.54/bbl — approaching the psychologically important US$100 mark that briefly held in July. The same oil price that is inflicting pain on the domestic consumer through petrol prices is simultaneously lifting energy producer revenues.
Coal stocks continued their strong September run — Coronado Global Resources (CRN) (+2.0%), New Hope Corp. (NHC) (+0.9%), and Yancoal Australia (YAL) (+0.8%) were all firmer.
Refining and distribution names were the standouts — Viva Energy (VEA) (+2.1%) and Ampol (ALD) (+0.7%) both advanced as elevated crude improved regional refining margins. Oil and gas producers also gained — Karoon Energy (KAR) (+1.7%) and Santos (STO) (+0.7%) were both higher.
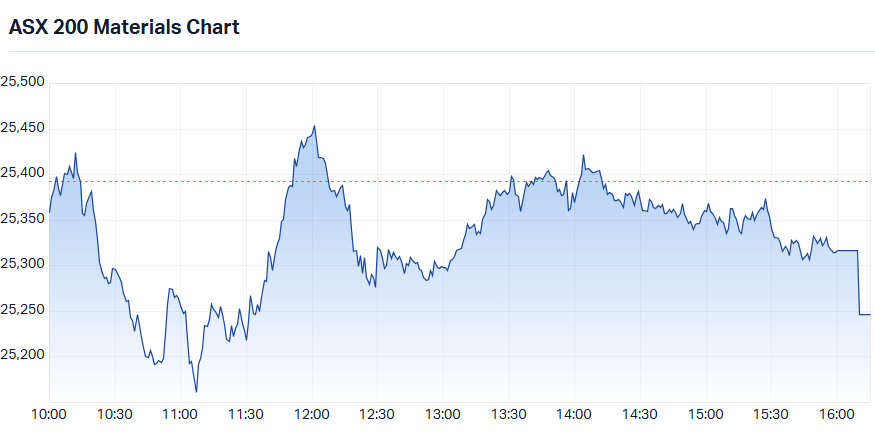
S&P-ASX 200 Materials Sector Index intraday chart
Materials (XMJ) (-0.6%) split sharply along sub-sector lines. Copper was the session's bright spot within the sector — COMEX copper futures gained 1.4% to US$6.775/lb, extending a run that has taken the metal back to near all-time highs. Aeris Resources (AIS) (+2.0%), Firefly Metals (FFM) (+2.0%), South32 (S32) (+1.6%), and Capstone Copper (CSC) (+1.1%) all gained.
Newmont (NEM) (+1.0%) provided some help in a mixed gold sub-sector, despite COMEX gold futures easing 0.5% to US$4,452.70/oz.
Majors BHP (BHP) (-0.6%) and Rio Tinto (RIO) (-0.8%) both fell — but were probably insulated from the broader sell-off due to their copper and iron ore exposure (iron ore +0.5% in Singapore today).
Consumer Discretionary (XDJ) (-1.9%) was Tuesday's worst sector and the most direct expression of the day's economic data. The Westpac-Melbourne Institute consumer confidence index and NAB business confidence reading released today both showed sharp deterioration — petrol prices topping $2 per litre for the first time in months, the expectation of a fourth RBA rate hike within weeks, and a housing market in accelerating decline are proving a combination that households and businesses alike find suffocating.
Lovisa (LOV) (-3.7%), Universal Store (UNI) (-2.7%), Wesfarmers (WES) (-2.7%), and JB Hi-Fi (JBH) (-2.2%) were all sharply lower — consumer-facing retailers with high domestic spending exposure bearing the sharpest losses.
Consumer Staples (XSJ) (-1.3%) shared the same confidence-collapse driver — even non-discretionary spending names are not immune when the data suggests consumers are pulling back across the board. Treasury Wine Estates (TWE) (-4.1%) was the sector's sharpest faller without a confirmed specific catalyst. Woolworths (WOW) (-1.7%) and Coles (COL) (-0.9%) also retreated.
Financials (XFJ) (-1.6%) was always going to struggle today. Higher benchmark bond yields, double-whammy bad consumer-business readers. ANZ (ANZ) (-2.6%), Commonwealth Bank (CBA) (-1.8%), National Australia Bank (NAB) (-1.4%), and Westpac (WBC) (-1.3%) all fell. Business lending exposed Judo Capital (JDO) (-4.7%) was the sharpest financial faller without a confirmed specific catalyst.
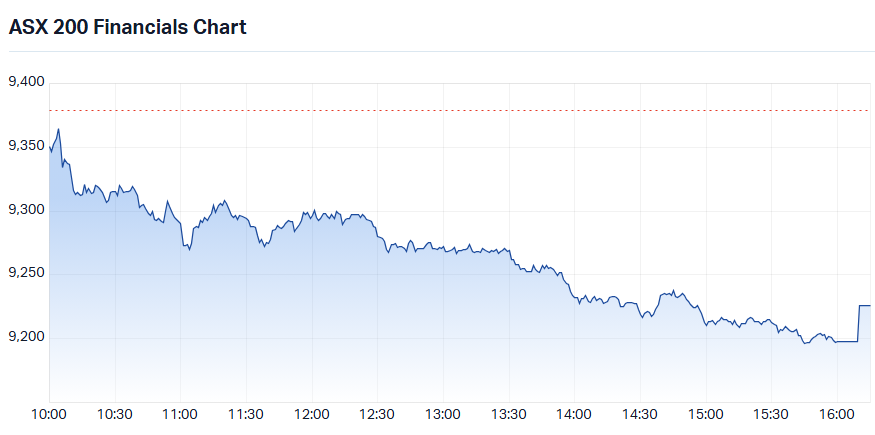
S&P-ASX 200 Financials Sector Index intraday chart — not even a closing juicing auction pop could save it today! 🧃
Information Technology (XIJ) (-1.8%) continued to ebb under the weight of those rising bond yields. Long-duration growth stocks with premium multiples are the most sensitive securities in the market to higher risk-free discount rates. WiseTech Global (WTC) (-2.8%), Xero (XRO) (-2.6%), NextDC (NXT) (-1.8%), and Technology One (TNE) (-1.8%) were all lower as the sector extended a losing run that has seen it shed nearly 13% from its August mid-month peak.
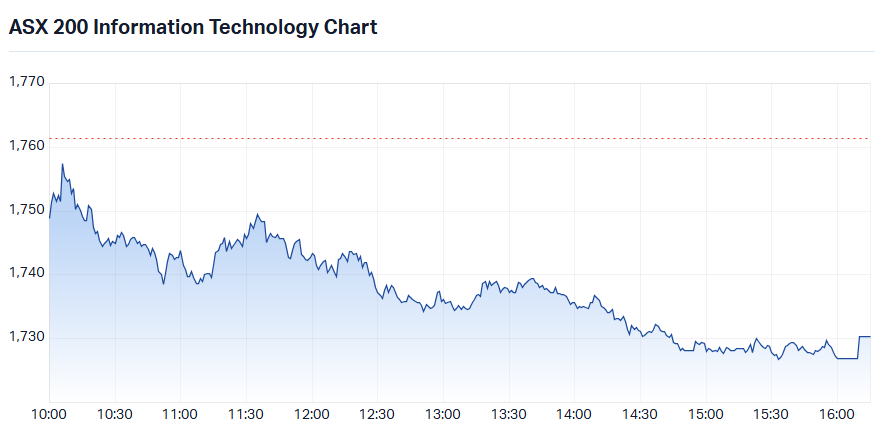
S&P-ASX 200 Information Technology Sector Index intraday chart
Real Estate (XPJ) (-1.5%) was caught in a particularly vicious pincer — higher benchmark bond yields compress the relative appeal of property trust income streams as a bond proxy, while the accelerating housing market deterioration threatens both the value of the underlying assets and the quality of retail and commercial tenants who are themselves under consumer spending pressure. Stockland (SGP) (-3.0%), Lendlease (LLC) (-2.4%), Charter Hall (CHC) (-1.7%), and Goodman Group (GMG) (-1.7%) were all sharply lower.
Today's best ASX Top 300 gainers
Company | Last Price | Change $ | Change % | 1mo % | 1yr % |
|---|---|---|---|---|---|
| Sunrise Energy Metals (SRL) | $19.39 | +$3.39 | +21.2% | +21.7% | +869.5% |
| Arafura Rare Earths (ARU) | $0.21 | +$0.015 | +7.7% | +7.7% | +10.5% |
| Turaco Gold (TCG) | $0.89 | +$0.06 | +7.2% | +33.8% | +79.8% |
| Core Lithium (CXO) | $0.35 | +$0.02 | +6.1% | +22.8% | +233.3% |
| EQ Resources (EQR) | $0.385 | +$0.02 | +5.5% | +26.2% | +969.4% |
| MAAS Group Holdings (MGH) | $5.96 | +$0.29 | +5.1% | +8.4% | +32.4% |
| New Murchison Gold (NMG) | $0.084 | +$0.004 | +5.0% | +50.0% | +236.0% |
| Lindian Resources (LIN) | $0.695 | +$0.03 | +4.5% | -0.4% | +202.2% |
| Predictive Discovery (PDI) | $4.69 | +$0.17 | +3.8% | +23.4% | +106.2% |
| Brazilian Rare Earths (BRE) | $3.78 | +$0.12 | +3.3% | -13.1% | +22.7% |
| Downer EDI (DOW) | $6.66 | +$0.20 | +3.1% | -15.1% | -4.0% |
| Elevra Lithium (ELV) | $7.75 | +$0.22 | +2.9% | -7.5% | +124.6% |
| Metrics Master Income Trust (MXT) | $1.765 | +$0.05 | +2.9% | -7.8% | -13.5% |
| Mesoblast (MSB) | $2.29 | +$0.06 | +2.7% | +2.7% | +3.6% |
| Genesis Energy (GNE) | $2.30 | +$0.06 | +2.7% | +9.5% | +9.7% |
| Zimplats Holdings (ZIM) | $17.90 | +$0.46 | +2.6% | +14.8% | +10.4% |
| Viva Energy Group (VEA) | $2.98 | +$0.06 | +2.1% | +12.5% | +47.5% |
| FireFly Metals (FFM) | $1.82 | +$0.035 | +2.0% | -4.2% | +55.3% |
| Centuria Capital Group (CNI) | $1.305 | +$0.025 | +2.0% | -11.8% | -44.0% |
| NRW Holdings (NWH) | $7.86 | +$0.15 | +1.9% | +9.2% | +78.6% |
Today's worst ASX Top 300 losers
Company | Last Price | Change $ | Change % | 1mo % | 1yr % |
|---|---|---|---|---|---|
| BlueScope Steel (BSL) | $30.66 | -$1.90 | -5.8% | -13.0% | +34.4% |
| Tasmea (TEA) | $9.30 | -$0.56 | -5.7% | +6.5% | +99.1% |
| 4DMedical (4DX) | $3.35 | -$0.17 | -4.8% | -20.6% | +45.0% |
| Judo Capital Holdings (JDO) | $1.02 | -$0.05 | -4.7% | 0.0% | -38.0% |
| Dicker Data (DDR) | $14.10 | -$0.62 | -4.2% | +7.0% | +41.0% |
| Treasury Wine Estates (TWE) | $5.35 | -$0.23 | -4.1% | -1.5% | -30.0% |
| AUB Group (AUB) | $28.15 | -$1.10 | -3.8% | -4.1% | -17.6% |
| Lovisa Holdings (LOV) | $22.72 | -$0.88 | -3.7% | -16.2% | -45.7% |
| Bravura Solutions (BVS) | $3.01 | -$0.11 | -3.5% | +7.5% | +48.3% |
| Liberty Financial Group (LFG) | $3.43 | -$0.12 | -3.4% | +5.2% | -17.1% |
| Nine Entertainment Co. Holdings (NEC) | $0.86 | -$0.03 | -3.4% | -14.4% | -48.2% |
| The Star Entertainment Group (SGR) | $0.15 | -$0.005 | -3.2% | +11.1% | +42.9% |
| Bannerman Energy (BMN) | $4.23 | -$0.14 | -3.2% | +24.8% | +25.1% |
| Air New Zealand (AIZ) | $0.31 | -$0.01 | -3.1% | -12.7% | -42.1% |
| Stockland (SGP) | $4.27 | -$0.13 | -3.0% | -0.7% | -31.6% |
| Zip Co (ZIP) | $2.31 | -$0.07 | -2.9% | -19.2% | -49.1% |
| PWR Holdings (PWH) | $10.97 | -$0.33 | -2.9% | +2.2% | +28.6% |
| IperionX (IPX) | $3.03 | -$0.09 | -2.9% | -11.9% | -59.2% |
| Wisetech Global (WTC) | $35.25 | -$1.01 | -2.8% | -14.0% | -63.0% |
| CAR Group (CAR) | $25.29 | -$0.71 | -2.7% | -6.4% | -35.9% |
Chartwatch
Nasdaq Composite Index
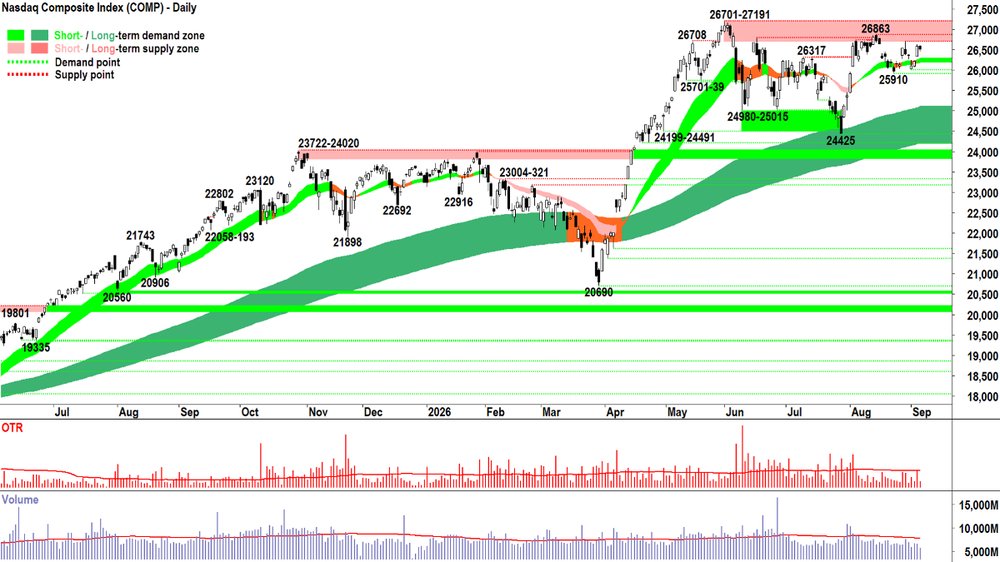
Nasdaq Composite Index chart
Analysis
No change here as US markets were closed last night for the Labor Day holiday. Go here and scroll down, if you want to re-read yesterday's analysis!
View
1/2RP. (RP = Risk Position — it reflects my personal allowable capital allocation limit for my investments in US stocks. So 1/2RP is 50%, 2/3RP is 67% and FRP is 100%).
Key Levels
26863 is the closest key point of supply vs 25910-25995 as the closest key point of demand, and then the long term trend ribbon (presently 24206-25099).
S&P/ASX 200 (XJO)
%20chart_8%20Sep.png)
S&P/ASX 200 (XJO) chart
Analysis
Yep, not great. Not exactly a surprise, either, though! 🫤
It’s record highs. The OTP just can’t bottle them! Which considering the precipitous falls following each record high that’s occurred over the last couple of years — is the understatement of the century! 🤦
As much as being 50% cash here makes me look like some kind of genius… don’t forget that as a trend follower it was compulsory for me to also be FRP = 100% invested at the top.
What it feels like to go FRP on the OTP every time it makes a new high...
That’s just the trend following gig. But, when it’s done well… when one’s model is sensitive enough to cut risk quickly when the balance between demand and supply shifts — one needn't go down with the ship.
And, yes, today’s candle is quite a bit of a “the ship is silently sinking below the black surface of the deep ocean” candle… glug, glug, glug, bubble, bubble, gurgle… pop!
Bloody OTP — you did it to us again!
But there’s still the long term uptrend ribbon to peg our hopes upon! The ribbon proved rock solid through back in June-July when the basing pattern that set the foundation for the last all time high formed — just look at all of those downward pointing shadows there…BTD central! 🤞
I’m confident (optimistic!?) that it will again prove to be an impenetrable zone of excess demand. The candles, price action and volume there will tell us.
It’s just a matter of sitting on one’s hands and managing the remaining 50% risk allocation I’m allowed to apply until then.
1/3RP? 🤔 With today’s candle really confirming the short term trend ribbon as a zone of dynamic excess supply (how prophetic were the two upward pointing shadows of Friday and Monday= STR!?). And given the awful price action, plus the wall of supply side candles since 9297 (i.e., those with black bodies and or upward pointing shadows), I can’t argue against such a move.
Go if you have to… But for me, the risk is already largely managed. Also consider that the risk I can take includes shorts✅. So, I’m just going to play it cool at 1/2RP and retain some flexibility to add risk if we get a strong bounce off the long term trend ribbon.
View
I am at 1/2RP on Australian shares (i.e., 50% of my capital allocated to ASX shares invested vs 50% cash).
Key Levels
9123-9297 is the key zone of supply to contend with, while 8935-40 is the next key zone of demand.
(Glossary of acronyms! Old Tin Pot (OTP): S&P/ASX 200 | MOTN: More Often Than Not | FOMO: Fear Of Missing Out | HOFU: Holding On For Upside | BTD: Buy The Dip | NUTE: No Urgency To Enter | FOHO: Fear Of Holding On | STR: Sell The Rally | RP: Risk Position | FFS: Fund Flow Shenanigans!)
***CHARTWATCH LIVE WEBINARS***
Is this the end for the stock market? This expert analyst is loading up on cash 💰
ChartWatch LIVE Webinar
ChartWatch LIVE Webinars – WEEKLY Wednesday's @ 12pm AEDT
Learn more about technical analysis and trend following through real case studies on ASX stocks. Australia's premier technical analyst, Carl Capolingua, shares his unique insights on stocks as requested by viewers. Ask about a company in your portfolio or anything related to trading and investing and get Carl's expert opinion.
Places are limited so >REGISTER NOW!<
Economy
TODAY
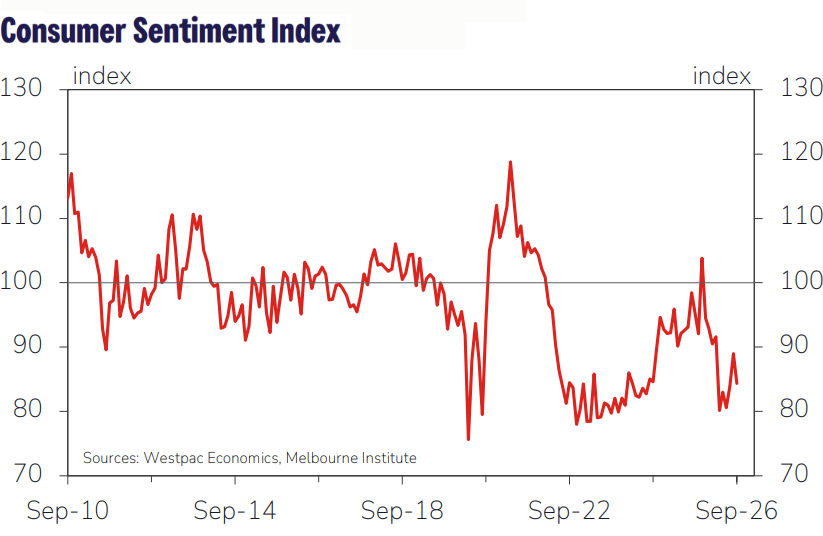
Westpac–Melbourne Institute Consumer Sentiment Index September. Source: Westpac
AUS Westpac Consumer Sentiment
Result: -5.2% to 84.4 vs +6.0% in August (consider that readings below 100 indicate pessimism among consumers — this results moves the dial back towards the deeply pessimistic levels from March (i.e., post rate hikes + US-Iran war start).
Consumers were concerned about another surge in petrol prices, the prospect of an impending RBA interest rate hike, and the current housing market downturn.
Family finances vs a year ago fell 9.2% to 72.6 (deeply pessimistic) as unemployment expectations rose 2.8% to 139.4 vs long-run average 129.
Westpac economists described the result as: "a broad-based decline led by a pull back in current assessments of family finances".
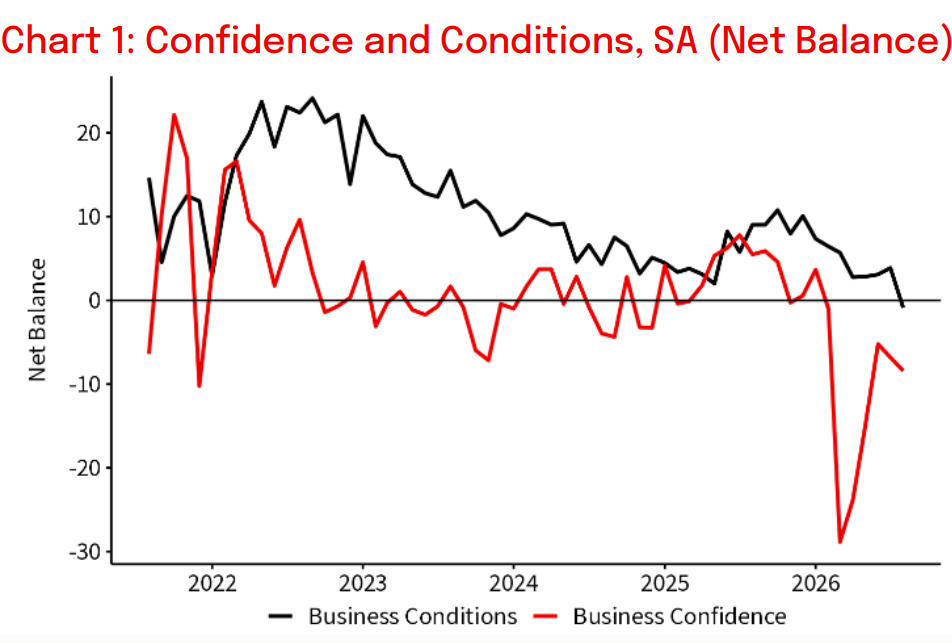
NAB Monthly Business Survey August. Source: National Australia Bank Limited
AUS NAB Business Confidence
Result: Conditions -5 points vs -1 point in August (first negative print in six years); Confidence -8 points vs -7 points in August (worst since January).
Businesses are worried about persistent cost pressures which are increasingly hurting profits and activity.
Purchase cost growth was +2.3% quarter on quarter, annualise that... and we're getting close to +10% p.a. – yet product price growth over the same period was only +0.8%. The difference must be absorbed in margins = lower profits.
LATER THIS WEEK
WEDNESDAY
11:30 CHN August Consumer Price Index (CPI) (+0.8% m/m forecast vs +0.5% m/m in July)
11:30 CHN August Producer Price Index (PPI) (+0.8% m/m forecast vs +0.5% m/m in July)
THURSDAY
22:15 EUR European Central Bank (ECB) Main Financing Rate (+0.25% p.a. forecast to 2.65% p.a.)
22:30 USA August Core PPI (+0.3% m/m forecast vs +0.2% m/m in July)
FRIDAY
22:30 USA August Core CPI (+0.2% m/m forecast vs +0.2% m/m in July)
Interesting Movers
Trading higher
- Sunrise Energy Metals (SRL) $19.39+21.2%
Released a corporate presentation today alongside the company's annual report. Critical minerals stocks,
- Iondrive (ION) $0.13+13.6%
No news, continued positive response to yesterday's announcement of improved modelling assumptions and financials for the company's ONSolv process modules. ION is a regular in the ChartWatch ASX Scans Uptrend List. 📈
- Amplitude Energy (AEL) $1.87+12.3%
Released an update on drilling operations at its Juliet-1 well in Victoria (50% interest). Preliminary drilling and logging data recorded elevated gas readings in the Waarre C reservoir. The Waarre C sandstone exhibits a gross gas-bearing interval of at least 60m, which includes 49m of interpreted high-quality net pay. AEL was added to the ChartWatch ASX Scans Uptrend List on 18-Aug. 📈
- Sunshine Metals (SHN) $0.04+10.5%
Released an update on the progress of refurbishment of the Mt Moss processing facility in Queensland. Management noted that engineering, environmental and site works are progressing on track for first gold pour in mid-2027.
- Arafura Rare Earths (ARU) $0.21+7.7%
No news. Second decent day up... 🤔
- Tungsten Mining NL (TGN) $0.35+7.7%
No news. Decent trends here. TGN was added to the ChartWatch ASX Scans Uptrend List on 31-Aug. 📈
- Actinogen Medical (ACW) $0.06+6.8%
No news. ACW was added to the ChartWatch ASX Scans Uptrend List this morning. 📈
- Core Lithium (CXO) $0.35+6.1%
Announced that the first spodumene concentrate has been produced from the recommissioned processing plant at the company’s Finniss Lithium Operation in the Northern Territory.
- Turaco Gold (TCG) $0.88+5.7%
No news. TCG is a regular in the ChartWatch ASX Scans Uptrend List. 📈
- Chalice Mining (CHN) $1.35+5.1%
Announced that several broad, low-grade copper-silver-gold intersections were returned in drilling at the company's Goomalling Copper Project in Western Australia.
- Brazilian Rare Earths (BRE) $3.81+4.1%
Announced that the Stage I pilot plant at its Camaçari project in Brazil was successfully commissioned. Hydrometallurgical plant co-funding and technical support secured for Stage II, with commissioning planned for Q2 2027.
- Elevra Lithium (ELV) $7.82+3.9%
Released a corporate presentation today.
- IRESS (IRE) $5.84+3.6%
Announced the appointment of Neil Montford as Group Chief Financial Officer, effective 16-Nov.
- Nanosonics (NAN) $2.82+3.5%
ASX filing released today showed that director Tracey Batten has purchased 20,000 shares in the company worth $53,063 (average price of $2.65 per share) in on-market trades on 3 September.
- Select Harvests (SHV) $5.07+3.5%
Released a business update. Management now expect a near record crop of 28,800 - 29,600 million tonnes (+16-19% vs previous corresponding period).
Trading Lower
- Dateline Resources (DTR) $0.08-9.0%
No news. DTR is a regular in the ChartWatch ASX Scans Downtrends List. 📉
- Vulcan Steel (VSL) $5.15-8.4%
ASX filing released today showed that board chairman and former CEO Rhys Jones has sold 120,000 shares in the company worth NZ$834,000 in on-market trades on 2 September.
- 4DMedical (4DX) $3.36-4.7%
No news. 4DX is a regular in the ChartWatch ASX Scans Downtrends List. 📉
- Gentrack Group (GTK) $3.52-4.4%
Released a NZX filing today noting that UBS Group has reduced its holding in the company from 5.0% to 4.2%. GTK is a regular in the ChartWatch ASX Scans Downtrends List. 📉
- Objective Corporation (OCL) $6.13-3.9%
No news. OCL went ex-dividend $0.05 today.
- Lycopodium (LYL) $20.62-3.8%
Released a statement that its staff were unimpacted by a "security incident" that occurred on Friday at the Tulu Kapi Gold Project in Ethiopia where the company is contracted to carry out work.
Broker Moves
Company | Broker | Action | Rating | Price Target |
|---|---|---|---|---|
APEEagers Automotive | UBS | Retained | Neutral | $22.00(from $22.95) |
APZAspen Group | Citi | Retained | Buy | $6.10 |
ASBAustal | Citi | Retained | Buy | $5.75 |
BC8Black Cat Syndicate | Ord Minnett | Retained | Buy | $1.50(from $1.60) |
BGDBarton Gold Holdings | Canaccord Genuity | Retained | Speculative Buy | $2.05 |
BHPBHP Group | Citi | Retained | Neutral | $63.00 |
BUBBubs Australia | Bell Potter | Retained | Speculative Buy | $0.19(from $0.14) |
| Ord Minnett | Retained | Accumulate | $0.12 | |
BWPBWP Trust | Citi | Retained | Buy | $4.00 |
CNICenturia Capital Group | Morgan Stanley | Retained | Overweight | $1.60 |
COLColes Group | Morgan Stanley | Retained | Overweight | $26.10 |
CQRCharter Hall Retail REIT | Citi | Retained | Buy | $4.70 |
CTDCorporate Travel Management | Morgan Stanley | Initiated | Equal Weight | $2.60(from $11.80) |
DOWDowner EDI | Macquarie | Retained | Outperform | $8.90 |
GLFGemlife Communities Group | Ord Minnett | Upgraded | Buy(from Accumulate) | $5.40(from $5.30) |
GMGGoodman Group | Citi | Retained | Buy | $40.00 |
GPTGPT Group | Citi | Retained | Buy | $6.00 |
INAIngenia Communities Group | Citi | Retained | Buy | $5.43 |
| Ord Minnett | Downgraded | Accumulate(from Buy) | $4.35 | |
LICLifestyle Communities | Ord Minnett | Downgraded | Lighten(from Hold) | $4.90(from $5.00) |
MADMader Group | Macquarie | Retained | Outperform | $10.00 |
MGHMAAS Group Holdings | Macquarie | Retained | Outperform | $6.75 |
MGRMirvac Group | Ord Minnett | Retained | Accumulate | $1.90(from $1.95) |
MNDMonadelphous Group | Macquarie | Retained | Outperform | $32.70 |
MP1Megaport | Citi | Retained | Buy | $24.60(from $22.10) |
NWHNRW Holdings | Macquarie | Retained | Outperform | $8.60 |
PRNPerenti | Macquarie | Retained | Outperform | $2.80 |
PXAPEXA Group | Macquarie | Retained | Outperform | $13.90 |
| Ord Minnett | Retained | Buy | $10.15(from $11.80) | |
RGNRegion Group | Citi | Retained | Buy | $2.60 |
SCGScentre Group | Citi | Retained | Buy | $4.10 |
SGPStockland | Ord Minnett | Retained | Accumulate | $4.75(from $5.00) |
SHVSelect Harvests | Bell Potter | Retained | Buy | $6.05(from $5.30) |
SSMService Stream | Macquarie | Retained | Outperform | $2.90 |
STOSantos | Citi | Retained | Buy | $9.20(from $9.00) |
| Macquarie | Retained | Outperform | $9.25 | |
TTMTitan Minerals | Canaccord Genuity | Retained | Speculative Buy | $1.65 |
VCXVicinity Centres | Citi | Retained | Neutral | $2.70 |
VNTVentia Services Group | Macquarie | Retained | Outperform | $6.60 |
WORWorley | Macquarie | Retained | Outperform | $11.90 |
WOWWoolworths Group | Morgan Stanley | Retained | Equal Weight | $39.00 |
Scans
Top Gainers
Code | Company | Last | % Chg |
|---|---|---|---|
| VR8 | Vanadium Resources Ltd | $0.038 | +40.74% |
| MEL | Metgasco Ltd | $0.017 | +30.77% |
| MRD | Mount Ridley Mines Ltd | $0.049 | +25.64% |
| DWG | Dataworks Group Ltd | $0.15 | +25.00% |
| TD1 | Tali Digital Ltd | $0.11 | +25.00% |
Top Fallers
Code | Company | Last | % Chg |
|---|---|---|---|
| BPP | Babylon Pump & Power Ltd | $0.052 | -32.90% |
| HT8 | Harris Technology Group Ltd | $0.015 | -25.00% |
| MVL | Marvel Gold Ltd | $0.012 | -20.00% |
| QEM | QEM Ltd | $0.013 | -18.75% |
| MEG | Megado Minerals Ltd | $0.014 | -17.65% |
52 Week Highs
Code | Company | Last | % Chg |
|---|---|---|---|
| FZR | Fitzroy River Corporation Ltd | $0.37 | +23.33% |
| ION | Iondrive Ltd | $0.125 | +13.64% |
| FMR | FMR Resources Ltd | $0.495 | +12.50% |
| CDR | Codrus Minerals Ltd | $0.046 | +12.20% |
| ZMI | ZINC of Ireland Ltd | $0.024 | +9.09% |
52 Week Lows
Code | Company | Last | % Chg |
|---|---|---|---|
| BPP | Babylon Pump & Power Ltd | $0.052 | -32.90% |
| QEM | QEM Ltd | $0.013 | -18.75% |
| RAN | Range International Ltd | $0.10 | -16.67% |
| GG1 | Green & Gold Minerals Ltd | $0.105 | -16.00% |
| NVX | Novonix Ltd | $0.095 | -9.52% |
Near Highs
Code | Company | Last | % Chg |
|---|---|---|---|
| EXUS | Betashares Global Shares Ex US ETF | $37.84 | +0.03% |
| DXN | DXN Ltd | $0.45 | +7.14% |
| SMLL | Betashares Australian Small Companies Select ETF | $4.57 | +1.11% |
| RHC | Ramsay Health Care Ltd | $53.22 | +1.78% |
| OZBD | Betashares Australian Composite Bond ETF | $43.18 | +0.07% |
Relative Strength Index (RSI) Oversold
Code | Company | Last | % Chg |
|---|---|---|---|
| NVX | Novonix Ltd | $0.105 | -4.55% |
| CHC | Charter Hall Group | $19.00 | 0.00% |
| WES | Wesfarmers Ltd | $77.30 | -0.55% |
| WAX | Wam Research Ltd | $0.89 | +2.30% |
| LED | LDR Capital Property Fund | $0.39 | 0.00% |
