
The ASX 200 edged higher as a sharp pullback in oil prices triggered a broad rotation back into miners and gold stocks. Consumer staples, utilities, healthcare, and banks — last week’s winners — all gave ground as capital rotated out.
Be sure to click/scroll through for the usual reporting of the major sector and stock-specific moves, the broker responses to them, as well as all the key economic data in tonight's Evening Wrap. Also, I have detailed technical analysis on the Nasdaq Composite and the S&P/ASX 200 in today's ChartWatch.
Let’s dive in!
Today in Review
Name | Value | % Chg |
|---|---|---|
Major Indices | ||
| ASX 200 | 8,809.9 | +0.17% |
| All Ords | 8,926.6 | +0.23% |
| Small Ords | 3,092.0 | +0.83% |
| All Tech | 2,839.2 | +0.58% |
| Emerging Companies | 2,679.4 | +0.85% |
Currency | ||
| AUD/USD | 0.703 | -0.07% |
US Futures | ||
| S&P 500 | 7,659.75 | -0.58% |
| Dow Jones | 52,394.0 | -1.27% |
| Nasdaq | 29,117.75 | -0.08% |
Name | Value | % Chg |
|---|---|---|
Sector | ||
| Materials | 21,709.9 | +1.71% |
| Real Estate | 3,286.1 | +1.32% |
| Information Technology | 1,616.9 | +1.03% |
| Energy | 11,004.9 | +0.92% |
| Industrials | 8,197.4 | +0.03% |
| Financials | 9,671.4 | -0.52% |
| Communication Services | 1,590.6 | -0.52% |
| Health Care | 34,370.5 | -0.52% |
| Utilities | 10,741.2 | -0.63% |
| Consumer Discretionary | 3,736.1 | -0.96% |
| Consumer Staples | 13,677.3 | -1.54% |
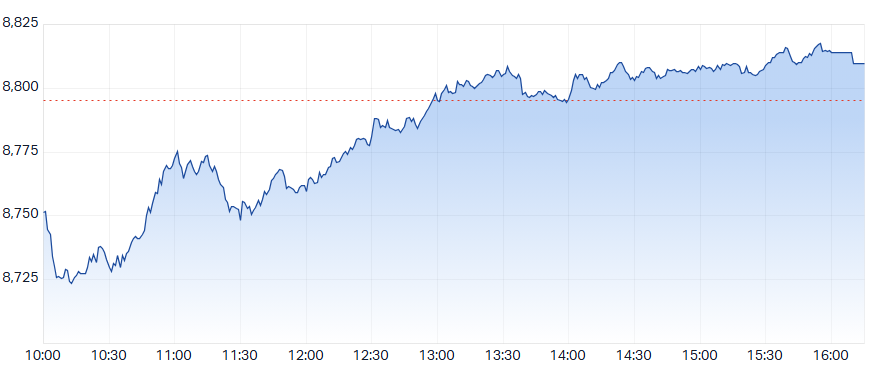
ASX 200 Intraday Chart
Markets
The S&P/ASX 200 (XJO) finished 14.7 points higher at 8,809.9, 1% from its session low and just 0.1% from its high. In the broader-based S&P/ASX 300 (XKO) advancers beat decliners by 172 to 108.
The Gold Sub-Index (XGD) (+2.9%) led the session as investors rotated back into gold stocks after last week’s heavy sell-off — a move driven by sentiment and global fund flows rather than any meaningful commodity price catalyst, with COMEX benchmark gold futures adding just +0.3% to US$4,020/oz in the Asian session. Westgold Resources (WGX) (+3.8%) was among the leaders, alongside Capricorn Metals (CMM) (+3.6%), Genesis Minerals (GMD) (+3.6%), and Kingsgate Consolidated (KCN) (+3.6%).
Materials (XMJ) (+1.7%) rallied on the same rotation dynamic, with ICE benchmark Brent crude oil futures falling sharply — down -6.1% to US$109.62/bbl in the Asian session — easing the energy cost headwind that had weighed on miners throughout the previous week. Lynas Rare Earths (LYC) (+5.2%) was the standout, with Fortescue (FMG) (+2.2%), Iluka Resources (ILU) (+2.2%), and BHP (BHP) (+1.0%) also advancing.
BlueScope Steel (BSL) (+2.9%) added further support after lifting its first-half profit guidance on a stronger-than-expected performance from its North Star steelmaking operation in the US.
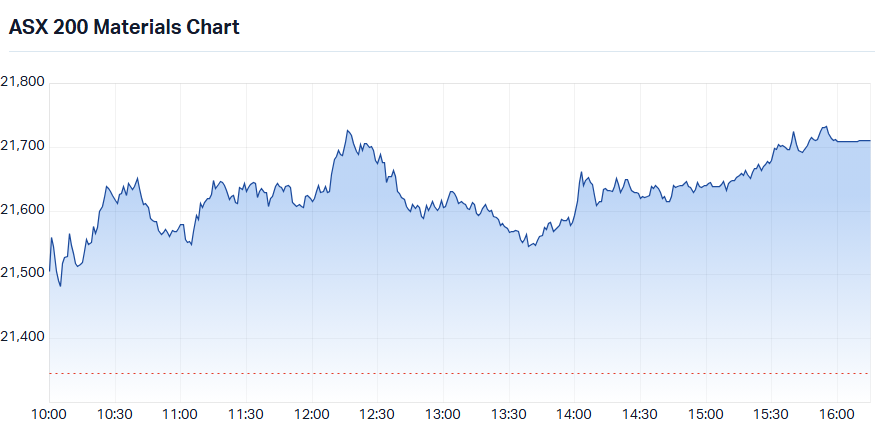
S&P-ASX 200 Materials Sector Index (XMJ) intraday chart
Lithium stocks were among the session’s strongest individual performers despite GFEX lithium carbonate futures in China falling -1.8% to CNY95,500/t — the commodity price gave no lead, but the two-month sell-off in the sector appeared to have stretched sentiment far enough to trigger a sharp bounce. Vulcan Energy Resources (VUL) (+10.6%) and PLS Group (PLS) (+8.4%) led the move, followed by Liontown (LTR) (+6.3%), Core Lithium (CXO) (+5.1%), Elevra Lithium (ELV) (+4.1%), and IGO (IGO) (+3.8%).
Real Estate (XPJ) (+1.3%) was lifted by M&A activity, with Ingenia Communities (INA) (+5.0%) surging after receiving an unsolicited cash takeover offer at $5.40 per security — the third bidder for the company. Goodman Group (GMG) (+2.6%) also advanced.
Consumer Staples (XSJ) (-1.5%) bore the brunt of the rotation reversal as last week’s defensive flows unwound. Woolworths (WOW) (-2.1%) and Coles Group (COL) (-1.5%) were the notable fallers.
Utilities (XUJ) (-0.6%) also gave back some of last week’s defensive gains, with AGL Energy (AGL) (-1.0%) and Origin Energy (ORG) (-0.7%) both lower.
Health Care (XHJ) (-0.5%) followed the same anti-defence pattern, with Cochlear (COH) (-3.4%) the heaviest faller, followed by Telix Pharmaceuticals (TLX) (-2.6%) and CSL (CSL) (-0.8%).
Financials (XFJ) (-0.5%) edged lower despite recovering through the session to maintain their index-anchoring role. It was always going to be a tough day for the big banks with the miners in rally mode! The retreats were modest, however: National Australia Bank (NAB) (-0.8%) led the pullback, with Westpac Banking Corp (WBC) (-0.7%), Commonwealth Bank of Australia (CBA) (-0.5%), and ANZ (ANZ) (-0.4%) also lower.
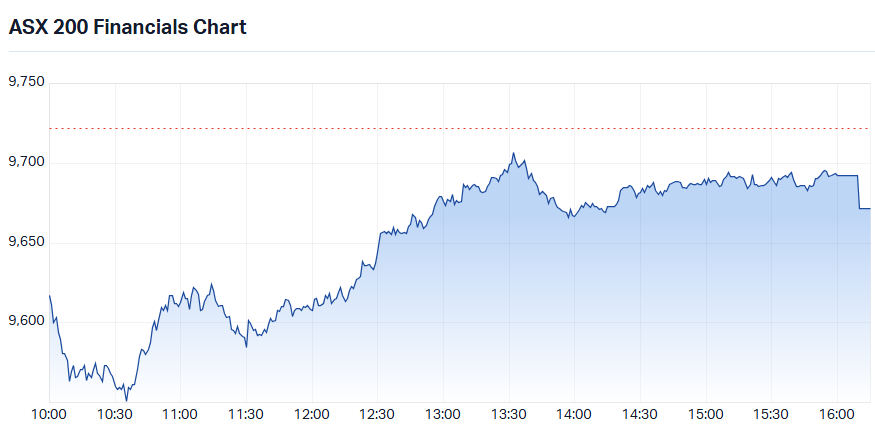
S&P-ASX 200 Financials Sector Index (XFJ) intraday chart
Today's best ASX Top 300 gainers
Company | Last Price | Change $ | Change % | 1mo % | 1yr % |
|---|---|---|---|---|---|
| Zip Co (ZIP) | $1.62 | +$0.16 | +11.0% | -18.4% | -59.2% |
| PLS Group (PLS) | $2.84 | +$0.22 | +8.4% | -26.0% | -12.1% |
| Eagers Automotive (APE) | $20.03 | +$1.44 | +7.7% | +8.3% | -34.5% |
| Minerals 260 (MI6) | $0.71 | +$0.05 | +7.6% | -24.5% | +136.7% |
| PDI Gold (PDI) | $3.80 | +$0.26 | +7.3% | -17.9% | +35.7% |
| Greatland Resources (GGP) | $9.29 | +$0.61 | +7.0% | -14.0% | +21.8% |
| Ora Banda Mining (OBM) | $1.185 | +$0.075 | +6.8% | -23.3% | -6.0% |
| Liontown (LTR) | $0.68 | +$0.04 | +6.3% | -27.7% | -44.3% |
| Pantoro Gold (PNR) | $2.74 | +$0.16 | +6.2% | -6.8% | -48.5% |
| Resolute Mining (RSG) | $1.09 | +$0.055 | +5.3% | -10.7% | -3.5% |
| FireFly Metals (FFM) | $1.29 | +$0.065 | +5.3% | -25.0% | -17.4% |
| Lynas Rare Earths (LYC) | $11.27 | +$0.56 | +5.2% | -20.7% | -40.1% |
| Ingenia Communities Group (INA) | $5.00 | +$0.24 | +5.0% | +11.1% | -14.5% |
| Civmec (CVL) | $1.615 | +$0.075 | +4.9% | -6.1% | +12.5% |
| Catapult Sports (CAT) | $3.26 | +$0.15 | +4.8% | +3.8% | -55.8% |
| Metals X (MLX) | $1.545 | +$0.07 | +4.7% | -26.1% | +80.7% |
| Regis Resources (RRL) | $6.32 | +$0.27 | +4.5% | -18.1% | +1.8% |
| Digico Infrastructure REIT (DGT) | $2.02 | +$0.08 | +4.1% | -17.9% | -27.9% |
| Catalyst Metals (CYL) | $4.94 | +$0.19 | +4.0% | -16.1% | -28.0% |
| Sandfire Resources (SFR) | $19.18 | +$0.73 | +4.0% | -14.3% | +22.9% |
Today's worst ASX Top 300 losers
Company | Last Price | Change $ | Change % | 1mo % | 1yr % |
|---|---|---|---|---|---|
| Zimplats Holdings (ZIM) | $13.22 | -$0.79 | -5.6% | -10.2% | -29.6% |
| Neuren Pharmaceuticals (NEU) | $18.65 | -$0.93 | -4.7% | -7.8% | -12.8% |
| Chrysos Corporation (C79) | $6.61 | -$0.29 | -4.2% | +4.4% | -18.0% |
| The Star Entertainment Group (SGR) | $0.115 | -$0.005 | -4.2% | -11.5% | +21.1% |
| Block, Inc. (XYZ) | $108.01 | -$3.88 | -3.5% | -0.3% | -10.3% |
| Southern Cross Gold Consolidated (SX2) | $8.67 | -$0.31 | -3.5% | -30.9% | +1.2% |
| Cochlear (COH) | $141.82 | -$4.99 | -3.4% | -0.3% | -51.1% |
| Beach Energy (BPT) | $0.91 | -$0.03 | -3.2% | +8.3% | -27.5% |
| Nickel Industries (NIC) | $0.63 | -$0.02 | -3.1% | -22.7% | -14.9% |
| Telix Pharmaceuticals (TLX) | $12.85 | -$0.34 | -2.6% | -19.2% | -22.2% |
| Southern Cross Electrical Engineering (SXE) | $3.54 | -$0.09 | -2.5% | -25.8% | +51.9% |
| Alkane Resources (ALK) | $1.44 | -$0.035 | -2.4% | -24.0% | +37.8% |
| Mercury NZ (MCY) | $5.44 | -$0.13 | -2.3% | +1.5% | -4.6% |
| GenusPlus Group (GNP) | $7.56 | -$0.18 | -2.3% | -18.5% | +18.3% |
| Supply Network (SNL) | $34.51 | -$0.79 | -2.2% | +0.4% | -6.6% |
| Ventia Services Group (VNT) | $5.79 | -$0.13 | -2.2% | -5.5% | +7.4% |
| Judo Capital Holdings (JDO) | $0.895 | -$0.02 | -2.2% | -6.3% | -49.3% |
| Lovisa Holdings (LOV) | $25.29 | -$0.54 | -2.1% | +3.9% | -34.5% |
| Woolworths Group (WOW) | $40.88 | -$0.87 | -2.1% | +6.3% | +53.0% |
| Meridian Energy (MEZ) | $4.50 | -$0.09 | -2.0% | +4.7% | -14.8% |
Chartwatch
Nasdaq Composite Index
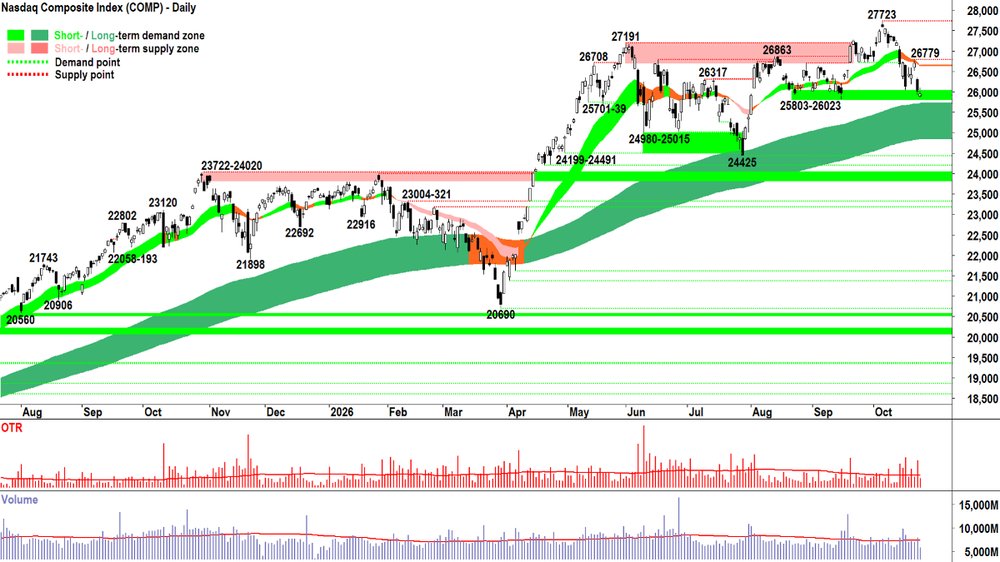
Nasdaq Composite Index chart
Analysis
Friday’s candle did little to undo the damage done by Thursday’s wipeout in terms of index points, or the damage done to our confidence about the demand side’s ability to control the Comp’s price.
It’s more dead cat bounce than Comp in beast mode. 🙀
The latter likely still remains somewhere around the corner, that is, if the face-ripping “rallies out of nowhere / out of total despair” we've seen so many times during the current bull market are to go by.
For me now, though, I must allocate risk based on what I can see and not what I suspect might happen. And I can see 🧐:
Short term downtrend (i.e., the price is below the short term trend ribbon, the short term trend ribbon is falling, and the short term trend ribbon is behaving as a zone of dynamic supply) ⚠️
The price action is lower peaks and lower troughs 📉 (i.e., evidence of STR = lower peaks and failure to BTD = lower troughs… smacks of NUTE and FOHO!) ⚠️
There is a predominance of supply side candles (i.e., those with black bodies and or upward pointing shadows = STR, NUTE, FOHO & pervasive sell orders in the system) ⚠️
There is no evidence of BTD within 25803-26023 — it was a zone of demand before… which means investors clearly saw value there… so why aren’t those same investors seeing value there now… or perhaps they are, but there’s too much supply around! ⚠️
And yet, despite the above, the long term trend remains up = ✅ Which still means a great deal to me.
So I have: ⚠️⚠️⚠️⚠️✅ = Best to retain a balanced approach ⚖️
I’m watching closely for signs demand is kicking back in near / within the long term uptrend ribbon. I want to see long white candle bodies and or long downward pointing shadows that indicate BTD, FOMO, and a return to HOFU.
If I see the opposite there… i.e., black bodied candles and or upward pointing shadows — then I’m going to officially move to “Okay, now I’m worried” mode! 😱
View
I am 1/2RP on US stocks (RP = Risk Position – it reflects my personal allowable capital allocation limit for my investments in US stocks. So 1/2RP is 50%, 2/3RP is 67% and FRP is 100%).
Key Levels
26779 is the closest key point of supply, but the short term trend ribbon will also likely act as a dynamic zone of supply (presently 26648-26657). 25803 as the closest key point of demand, then it's the long term uptrend ribbon (presently 24846-25715).
S&P/ASX 200 (XJO)
S&P/ASX 200 (XJO) chart
Analysis
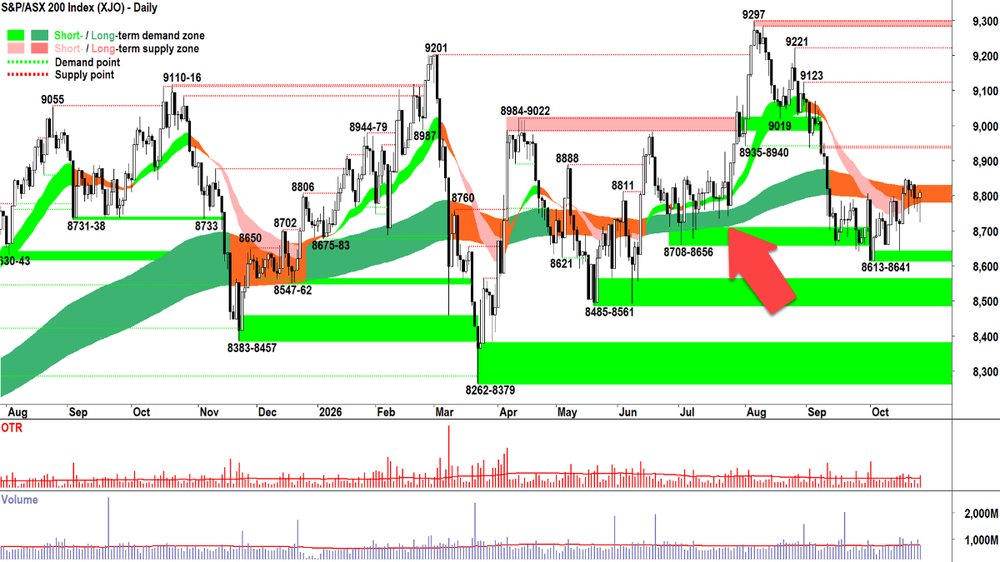
Remember the bit I've marked with a big red arrow?
That was the last time things felt / looked really crappy for the Aussie share market but the index refused to go down. 🚫📉
Candle after candle of BTD.
It felt totally JUICY, i.e., the Plunge Protection Team's invisible hand at work... but who cares how or why, UP is the preferred mode of transport for most of us! 🧃📈
It's happening again. It's palpable. I'll spare you the Gandalf and Austin Powers clips again... but for those who haven't been around long enough to get those references... see this wrap, and this one.
I feel like I've done this before... 🤔
The big question is whether I jump the gun, anticipate the Powers That Be massaging the Old Tin Pot higher... and add RP now? 🤔
View
Tempting, but not just yet! I am 1/3RP on Australian shares (i.e., 67% cash vs 33% invested, with some of the invested portion allocated to shorts).
Key Levels
8935-8940 is the closest zone of supply vs 8613-8641 is the critical zone of demand.
(Glossary of acronyms! Old Tin Pot (OTP): S&P/ASX 200 | MOTN: More Often Than Not | FOMO: Fear Of Missing Out | HOFU: Holding On For Upside | BTD: Buy The Dip | NUTE: No Urgency To Enter | FOHO: Fear Of Holding On | STR: Sell The Rally | RP: Risk Position | FFS: Fund Flow Shenanigans!)
ChartWatch LIVE Webinars – WEEKLY Wednesday's @ 12pm AEDT
Learn more about technical analysis and trend following through real case studies on ASX stocks. Australia's premier technical analyst, Carl Capolingua, shares his unique insights on stocks as requested by viewers. Ask about a company in your portfolio or anything related to trading and investing and get Carl's expert opinion.
Places are limited so >REGISTER NOW!<
Economy
TODAY
There weren't any major economic data releases in our time zone today
LATER THIS WEEK
TUESDAY
23:30 USA September Core Durable Goods Orders (0.6% m/m forecast vs +0.2% m/m in August)
WEDNESDAY
01:00 USA Conference Board Consumer Sentiment (80.5 forecast vs 81.9 previous)
11:30 AUS September Consumer Price Index (CPI)
Headline: +0.7% m/m and 4.2% p.a. forecast vs +0.4% p.a. and 4.0% p.a. in August
Trimmed Mean: +0.3% m/m and 3.6% p.a. forecast vs +0.2% p.a. and 3.6% p.a. in August
THURSDAY
05:00 USA Federal Reserve FOMC interest rate decision (unchanged at 3.75%-4.0% forecast)
23:30 USA September quarter Advance GDP q/q (+3.2% p.a. forecast vs +2.2% p.a. in June quarter)
23:30 USA September Core Personal Consumption Expenditures (PCE)
PCE Index: +0.3% m/m forecast vs +0.2% m/m in August
Personal Income: +0.3% m/m forecast vs +0.2% m/m in August
Personal Spending: +0.6% m/m forecast vs +0.9% m/m in August
FRIDAY
00:15 European Central Bank (ECB) main financing rate decision (no change at +2.6% p.a. forecast)
11:30 AUS September quarter Producer Price Index (PPI) (+1.0% p.a. forecast vs +1.3% p.a. in June quarter)
SATURDAY
00:00 CHN October Purchasing Managers Index (PMI)
Manufacturing: 50.1 forecast, unchanged vs September
Non-Manufacturing: 50.5 forecast vs 50.2 in September
Interesting Movers
Trading higher
- Echo IQ (EIQ) $0.52+17.1%
Released its September quarterly activities report. 9,697 full-result assessments were processed via EchoSolv in the quarter (~193% growth y/y). Cash was $107.8 million at 30 Sep 2026 following completion of $110 million institutional placement.
- Metallium (MTM) $0.22+16.2%
Signed a non-binding MOU with Traxys North America LLC to evaluate U.S. critical-metals supply chains using Metallium’s Flash Joule Heating platform. Framework runs through 30 November 2027 to define priority feedstocks/products, assess processing economics and negotiate supply, offtake and financing terms.
- Lotus Resources (LOT) $0.19+12.1%
Secured final approval for transportation and export of first shipment of uranium product from the company's Kayelekera uranium project. First shipment of ~145k lbs of uranium ore concentrate expected to leave site next week and shipment ex Walvis Bay booked for November.
- PLS Group (PLS) $2.84+8.4%
Announced the closing of offering of US$700m 8.00% Senior Notes due 2032.
- Eagers Automotive (APE) $20.03+7.8%
Entered a binding, unconditional agreement to acquire the remaining 20% of the BYD retail JV (EV Dealer Group Pty Ltd) for cash and Eagers shares. Expected to complete the deal by 31 Oct 2026 and that it will be ~5.0–5.5% earnings accretive.
- Ingenia Communities Group (INA) $5.00+5.0%
Received an unsolicited cash takeover offer from Avid Property Group valuing the business up to $5.40 per security (cash bid $5.35 plus ability to keep upcoming dividend of up to 5¢). INA board has granted Avid up to six weeks limited exclusivity.
- BlueScope Steel (BSL) $33.31+2.9%
Management raised its first-half profit guidance — now expects underlying EBIT to be 'approaching $1.1 billion' vs prior $860–960 million guidance. Driven by stronger-than-expected North Star performance and improved US steel spreads.
Trading Lower
- Tuas (TUA) $1.27-30.5%
Announced that Singapore's communications regulator is investigating subsidiary Simba Telecom over alleged unauthorised network use and governance failures. The IMDA has issued a show-cause notice with potential fines or licence suspension and Simba has until Nov 16 to respond.
- Cochlear (COH) $141.82-3.4%
Management reaffirmed underlying full-year net profit guidance of $330m–$350m.
- CSL (CSL) $195.14-0.8%
Chairman Brian McNamee set to retire in March with Gordon Naylor to replace him. Naylor remains interim CEO until February.
Broker Moves
Company | Broker | Action | Rating | Price Target |
|---|---|---|---|---|
ABBAussie Broadband | Macquarie | Retained | Outperform | $5.00(from $5.20) |
| Ord Minnett | Retained | Buy | $5.67(from $6.12) | |
| UBS | Retained | Buy | $6.20 | |
ACEAcusensus | Morgans | Retained | Speculative Buy | $2.10(from $2.00) |
| Ord Minnett | Retained | Buy | $1.63(from $1.53) | |
AELAmplitude Energy | Macquarie | Retained | Outperform | $2.55 |
AL3AML3D | Bell Potter | Retained | Speculative Buy | $0.25(from $0.35) |
ALKAlkane Resources | Bell Potter | Retained | Buy | $2.20(from $2.15) |
| Ord Minnett | Retained | Buy | $2.40(from $2.20) | |
AMPAMP | UBS | Retained | Neutral | $2.61 |
BAPBapcor | Citi | Retained | Neutral | $0.86(from $0.69) |
BHPBHP Group | Morgan Stanley | Retained | Overweight | $68.00 |
BOEBoss Energy | Morgan Stanley | Retained | Equal Weight | $1.40 |
BPTBeach Energy | Ord Minnett | Retained | Buy | $1.08 |
BREBrazilian Rare Earths | Canaccord Genuity | Retained | Speculative Buy | $7.35 |
CPUComputershare | UBS | Retained | Neutral | $41.55 |
CSLCSL | Citi | Retained | Neutral | $180.00 |
DRRDeterra Royalties | Morgan Stanley | Retained | Equal Weight | $3.95 |
ELDElders | Morgans | Downgraded | Accumulate(from Buy) | $7.20(from $7.90) |
EVTEVT | Citi | Retained | Buy | $17.55 |
FEXFenix Resources | Bell Potter | Retained | Buy | $0.38(from $0.54) |
FMGFortescue | Bell Potter | Retained | Sell | $13.15(from $15.80) |
GMGGoodman Group | Citi | Retained | Buy | $40.00 |
IAGInsurance Australia Group | UBS | Retained | Buy | $9.10 |
IGOIGO | Morgan Stanley | Retained | Equal Weight | $6.40 |
ILUIluka Resources | Morgan Stanley | Retained | Overweight | $7.05 |
KARKaroon Energy | Citi | Retained | Buy | $1.90(from $1.80) |
| Ord Minnett | Retained | Buy | $2.20(from $2.50) | |
LLCLendLease Group | Morgan Stanley | Retained | Equal Weight | $3.21 |
LOTLotus Resources | Canaccord Genuity | Retained | Speculative Buy | $0.70 |
LYCLynas Rare Earths | Morgan Stanley | Retained | Overweight | $14.65 |
MFGMagellan Financial Group | Morgans | Upgraded | Buy(from Accumulate) | $8.66(from $10.25) |
MINMineral Resources | Bell Potter | Retained | Buy | $63.00 |
| Morgans | Retained | Buy | $61.00(from $65.00) | |
| Ord Minnett | Retained | Buy | $63.00 | |
| UBS | Retained | Buy | $72.00 | |
MMSMcMillan Shakespeare | Morgan Stanley | Retained | Overweight | $23.00 |
MPLMedibank Private | Jefferies | Upgraded | Buy(from Hold) | $5.80(from $5.20) |
| UBS | Retained | Neutral | $5.00 | |
MXIMaxiPARTS | Ord Minnett | Retained | Buy | $3.40 |
NABNational Australia Bank | Citi | Retained | Buy | $42.10 |
NEMNewmont Corporation | UBS | Retained | Buy | $210.00 |
NHFNIB Holdings | UBS | Retained | Neutral | $7.05 |
NICNickel Industries | Bell Potter | Retained | Buy | $1.20(from $1.45) |
| Ord Minnett | Retained | Buy | $1.80 | |
OBMOra Banda Mining | Canaccord Genuity | Retained | Buy | $2.00(from $2.05) |
| Macquarie | Upgraded | Outperform(from Neutral) | $1.30(from $1.50) | |
| UBS | Retained | Buy | $1.95(from $2.10) | |
OCCOrthocell | Bell Potter | Downgraded | Hold(from Speculative Buy) | $0.65(from $1.13) |
PLSPLS Group | Morgan Stanley | Retained | Equal Weight | $3.85 |
PXAPEXA Group | UBS | Retained | Buy | $8.35 |
QBEQBE Insurance Group | UBS | Retained | Neutral | $25.25 |
REAREA Group | Macquarie | Retained | Neutral | $170.00 |
RIORio Tinto | Citi | Retained | Neutral | $155.00 |
| Morgan Stanley | Retained | Underweight | $146.00 | |
S32South32 | Morgan Stanley | Retained | Equal Weight | $5.20 |
SFRSandfire Resources | Morgan Stanley | Retained | Underweight | $20.35 |
SLDSaluda Medical, Inc. | Morgans | Retained | Speculative Buy | $1.61(from $2.17) |
SLXSilex Systems | Canaccord Genuity | Retained | Speculative Buy | $10.48 |
SNLSupply Network | Ord Minnett | Retained | Buy | $41.00 |
SRZStellar Resources | Ord Minnett | Initiated | Speculative Buy | $0.45 |
TCGTuraco Gold | Canaccord Genuity | Retained | Speculative Buy | $1.55 |
TORTorque Metals | Morgans | Retained | Speculative Buy | $0.63(from $0.68) |
TPWTemple & Webster Group | Citi | Retained | Neutral | $5.66(from $4.35) |
| Morgan Stanley | Retained | Equal Weight | $4.80 | |
| Ord Minnett | Retained | Hold | $5.50 | |
| UBS | Retained | Neutral | $5.30 | |
VCXVicinity Centres | Morgan Stanley | Retained | Underweight | $2.70 |
WBCWestpac Banking Corporation | Morgans | Retained | Trim | $31.67 |
WC8Wildcat Resources | Canaccord Genuity | Retained | Speculative Buy | $0.95 |
WHCWhitehaven Coal | Bell Potter | Retained | Hold | $8.15(from $7.50) |
| Morgan Stanley | Retained | Overweight | $8.95 | |
| Ord Minnett | Retained | Buy | $10.30 | |
ZIPZip Co | Citi | Retained | Buy | $2.70(from $3.30) |
| Macquarie | Retained | Outperform | $3.50(from $3.60) | |
| Ord Minnett | Retained | Buy | $3.10(from $4.20) |
Scans
Top Gainers
Code | Company | Last | % Chg |
|---|---|---|---|
| BNLDB | Blue Star Helium Ltd | $0.13 | +30.00% |
| DTR | Dateline Resources Ltd | $0.09 | +26.76% |
| LVE | Love Group Global Ltd | $0.12 | +20.00% |
| SPD | Southern Palladium Ltd | $1.63 | +19.85% |
| OZM | Ozaurum Resources Ltd | $0.074 | +19.36% |
Top Fallers
Code | Company | Last | % Chg |
|---|---|---|---|
| TUA | Tuas Ltd | $1.265 | -30.50% |
| STK | Strickland Metals Ltd | $0.038 | -29.63% |
| EVE | EVE Health Group Ltd | $0.011 | -26.67% |
| OEQ | Orion Equities Ltd | $0.13 | -25.71% |
| OFX | OFX Group Ltd | $0.385 | -24.51% |
52 Week Highs
Code | Company | Last | % Chg |
|---|---|---|---|
| BNLDB | Blue Star Helium Ltd | $0.13 | +30.00% |
| CLDD | Betashares Cloud Computing ETF | $16.81 | +2.19% |
| FUEL | Betashares Global Energy Comp Currency Hedged ETF | $9.67 | +1.05% |
| OOO | Betashares Crude Oil INDEX Currncy HDG Complex ETF | $11.00 | +0.73% |
| OML | Ooh!Media Ltd | $1.675 | +0.60% |
52 Week Lows
Code | Company | Last | % Chg |
|---|---|---|---|
| TUA | Tuas Ltd | $1.265 | -30.50% |
| STK | Strickland Metals Ltd | $0.038 | -29.63% |
| EVE | EVE Health Group Ltd | $0.011 | -26.67% |
| OEQ | Orion Equities Ltd | $0.13 | -25.71% |
| OFX | OFX Group Ltd | $0.385 | -24.51% |
Near Highs
Code | Company | Last | % Chg |
|---|---|---|---|
| BEAR | Betashares Australian Equities Bear Complex ETF | $7.48 | +0.40% |
| RHC | Ramsay Health Care Ltd | $54.79 | -0.20% |
| OZBD | Betashares Australian Composite Bond ETF | $43.17 | +0.54% |
| AN3PI | Australia and New Zealand Banking Group Ltd | $102.72 | -0.16% |
| PCI | Perpetual Credit Income Trust | $1.07 | -0.47% |
Relative Strength Index (RSI) Oversold
Code | Company | Last | % Chg |
|---|---|---|---|
| KAU | Kaiser Reef Ltd | $0.16 | -3.03% |
| IPX | Iperionx Ltd | $1.775 | -5.08% |
| CHN | Chalice Mining Ltd | $0.88 | -5.38% |
| MGX | MGX Resources Ltd | $0.295 | -1.67% |
| ETPMPM | Global X Metal Securities Australia Ltd | $345.66 | -2.23% |