News | Market Wraps
Evening Wrap: ASX 200 firmer on CBA, WBC, BHP and gold stocks strength, Woodside Energy tumbles on weak energy prices
The S&P/ASX 200 closed 59.9 points higher, up 0.68%.

Mentioned
The S&P/ASX 200 closed 59.9 points higher, up 0.68%.
When Financials (XFJ) (+1.2%) and Resources (XJR) (+0.8%) are both up a decent amount in a trading session, there's a very strong chance the benchmark S&P/ASX 200 is going to log a solid gain... and it almost goes without saying these days that the Gold (XGD) (+2.1%) sector is also a winner! 🏆
To make sense of all the above, I have detailed technical analysis on the Nasdaq Composite, the S&P/ASX 200, Silver, and Gold in today's ChartWatch.
Be sure to click/scroll through for the usual reporting of the major sector and stock-specific moves, the broker responses to them, as well as all the key economic data in tonight's Evening Wrap.
Let's dive in!
Today in Review
Fri 12 Sep 25, 5:09pm (AEST)
Name | Value | % Chg |
|---|---|---|
Major Indices | ||
| ASX 200 | 8,864.9 | +0.68% |
| All Ords | 9,128.6 | +0.63% |
| Small Ords | 3,651.8 | +0.67% |
| All Tech | 4,219.2 | -0.11% |
| Emerging Companies | 2,691.0 | +0.55% |
Currency | ||
| AUD/USD | 0.6657 | -0.06% |
US Futures | ||
| S&P 500 | 6,587.25 | -0.08% |
| Dow Jones | 46,080.0 | -0.13% |
| Nasdaq | 24,014.5 | -0.01% |
Name | Value | % Chg |
|---|---|---|
Sector | ||
| Materials | 17,836.6 | +1.45% |
| Real Estate | 4,200.0 | +1.30% |
| Financials | 9,662.8 | +1.16% |
| Health Care | 38,590.5 | +0.61% |
| Information Technology | 2,959.1 | +0.56% |
| Consumer Staples | 12,179.2 | +0.20% |
| Utilities | 9,932.7 | +0.04% |
| Industrials | 8,555.6 | -0.07% |
| Communication Services | 1,893.8 | -0.14% |
| Consumer Discretionary | 4,508.0 | -0.67% |
| Energy | 8,729.3 | -2.43% |
Markets
%20intraday%20chart_12%20Sep.png)
ASX 200 Session Chart
The S&P/ASX 200 (XJO) finished 59.9 points higher at 8,864.9, 0.68% from its session low and 0.26% from its high. In the broader-based S&P/ASX 300 (XKO) advancers beat decliners by a modest 164 to 108.
For the week, the XJO finished down 6.3 points or 0.07% lower, but this was a healthy 0.94% from its intraweek low and just 0.26% from its intraweek high.
You can't argue with Financials (XFJ) (+1.2%) and Resources (XJR) (+0.8%) both up a decent amount on any trading day for the Aussie share market – when it occurs there's a very strong chance the benchmark is going to log a solid gain.
All four of the Big 4 logged +1% gains (Westpac Banking Corp. (WBC) (+1.4%) and Commbank (CBA) (+1.3%) the best), as the iron ore majors BHP Group (BHP) (+1.3%) and Rio Tinto (RIO) (+1.1%) also did their bit – from a market capitalisation standpoint it almost didn't matter what anything else did from there!
I mentioned in my last wrap on Wednesday that Mineral Resources (MIN) (+4.3%) was the only of the lithium-exposed to still be "hanging in there", so today it offered further reassurance that it may be able to dodge the carnage in that sector. As for the rest of the bunch, a modest rally today as benchmark GFEX lithium futures steadied in China – Liontown Resources (LTR) (+3.9%), IGO (IGO) (+2.6%), and Pilbara Minerals (PLS) (+0.5%) each limped higher.
The best of the rest was Real Estate (XPJ) (+1.3%) as sector major Goodman Group (GMG) (+2.0%) continued to rebound from its recent sell off... and it almost goes without saying these days that the Gold (XGD) (+2.1%) sector was also a winner again...
You can check out the charts of gold and silver in ChartWatch below to see why this remains the case, and I note that ChartWatch ASX Scans is chock full of winners from that sector too (💪!).
Energy was the only really major let down today, as most sector themes slumped – oil, gas, coal, and uranium. Woodside Energy (WDS) (-3.4%) and Santos (STO) (-2.2%) did the most damage, both in terms of sector weakness and knocking a few points off the ASX 200 – but +2% losses were widespread (e.g., Beach Energy (BPT) (-3.3%), Karoon Energy (KAR) (-2.7%), Bannerman Energy (BMN) (-2.6%), Deep Yellow (DYL) (-2.4%).
Coal, crude, and natural gas prices were all lower overnight. Both major coal contracts are in short and long term downtrends – now news there – but for your reference, see below the charts of Brent Crude oil and Natural Gas.
%20ICE%20chart_12%20Sep.png)
%20NYMEX%20chart_12%20Sep.png)
Brent Crude Oil Futures (Front month, back-adjusted) ICE (top) & Natural Gas Futures (Front month, back-adjusted) NYMEX (bottom)
Neither of them inspire great confidence… but I put to you that Brent’s been the better of the bunch. But looking at last night’s move (second candle from right because last candle is today’s, live candle) – even it seems intent on breaking lower. Near term points of demand at 64.50-65.07 are the only barrier between the present sideways shuffle a more protracted downturn.
Elsewhere, the chart of Uranium (not shown – will cover it in a ChartWatch next week) is steady, so more likely just a pullback from a recent strong run there...
Today's best blue chip gainers
Company | Last Price | Change $ | Change % | 1mo % | 1yr % |
|---|---|---|---|---|---|
Mineral Resources (MIN) | $37.45 | +$1.54 | +4.3% | +4.0% | +23.6% |
Seek (SEK) | $28.00 | +$0.85 | +3.1% | +11.6% | +21.6% |
Life360 (360) | $49.34 | +$1.28 | +2.7% | +11.1% | +189.7% |
IGO (IGO) | $4.34 | +$0.11 | +2.6% | -19.2% | -11.2% |
Newmont Corporation (NEM) | $119.85 | +$2.6 | +2.2% | +13.7% | +57.3% |
Evolution Mining (EVN) | $9.90 | +$0.2 | +2.1% | +24.7% | +155.8% |
South32 (S32) | $2.59 | +$0.05 | +2.0% | -10.7% | -13.4% |
Goodman Group (GMG) | $34.37 | +$0.66 | +2.0% | -4.0% | +2.8% |
Macquarie Group (MQG) | $224.09 | +$4.18 | +1.9% | +3.4% | -1.4% |
Downer EDI (DOW) | $7.26 | +$0.13 | +1.8% | +6.3% | +30.8% |
Mirvac Group (MGR) | $2.37 | +$0.04 | +1.7% | +2.6% | +7.7% |
Steadfast Group (SDF) | $6.20 | +$0.1 | +1.6% | +0.6% | +16.5% |
Perseus Mining (PRU) | $4.35 | +$0.07 | +1.6% | +22.2% | +85.9% |
Northern Star Resources (NST) | $21.20 | +$0.33 | +1.6% | +17.8% | +45.2% |
Bank of Queensland (BOQ) | $7.08 | +$0.11 | +1.6% | -8.6% | +8.8% |
Scentre Group (SCG) | $4.20 | +$0.06 | +1.4% | +10.5% | +18.6% |
Stockland (SGP) | $6.35 | +$0.09 | +1.4% | +12.4% | +21.9% |
Westpac Banking Corporation (WBC) | $38.48 | +$0.53 | +1.4% | +6.8% | +19.1% |
BHP Group (BHP) | $40.81 | +$0.54 | +1.3% | -1.7% | +5.6% |
Commonwealth Bank of Aus. (CBA) | $169.97 | +$2.2 | +1.3% | +1.7% | +18.2% |
Today's worst blue chip losers
Company | Last Price | Change $ | Change % | 1mo % | 1yr % |
|---|---|---|---|---|---|
Aristocrat Leisure (ALL) | $67.47 | -$2.79 | -4.0% | -3.7% | +22.8% |
Woodside Energy Group (WDS) | $24.22 | -$0.85 | -3.4% | -9.5% | +1.0% |
Car Group (CAR) | $38.33 | -$1.22 | -3.1% | -7.0% | +2.4% |
Qantas Airways (QAN) | $11.41 | -$0.32 | -2.7% | -1.3% | +69.3% |
Reece (REH) | $10.18 | -$0.26 | -2.5% | -32.9% | -62.2% |
REA Group (REA) | $227.09 | -$5.23 | -2.3% | -9.1% | +12.2% |
Santos (STO) | $7.59 | -$0.17 | -2.2% | -4.0% | +9.7% |
Washington H Soul Pattinson (SOL) | $42.51 | -$0.59 | -1.4% | -0.3% | +27.9% |
Computershare (CPU) | $36.47 | -$0.43 | -1.2% | -9.8% | +31.3% |
Ampol (ALD) | $29.80 | -$0.25 | -0.8% | +10.1% | +3.2% |
Treasury Wine Estates (TWE) | $7.58 | -$0.06 | -0.8% | -2.2% | -33.9% |
A2 Milk Company (A2M) | $9.15 | -$0.07 | -0.8% | +16.9% | +63.4% |
IDP Education (IEL) | $5.28 | -$0.04 | -0.8% | +22.2% | -67.3% |
Telix Pharmaceuticals (TLX) | $13.69 | -$0.09 | -0.7% | -19.6% | -24.6% |
Worley (WOR) | $14.23 | -$0.07 | -0.5% | +9.5% | -4.6% |
Reliance Worldwide (RWC) | $4.12 | -$0.02 | -0.5% | -8.9% | -25.0% |
Brambles (BXB) | $25.33 | -$0.11 | -0.4% | +9.9% | +38.9% |
Origin Energy (ORG) | $12.40 | -$0.05 | -0.4% | -1.5% | +28.4% |
Block (XYZ) | $111.28 | -$0.41 | -0.4% | -4.6% | +21.6% |
Charter Hall Group (CHC) | $23.10 | -$0.08 | -0.3% | +5.6% | +46.3% |
ChartWatch
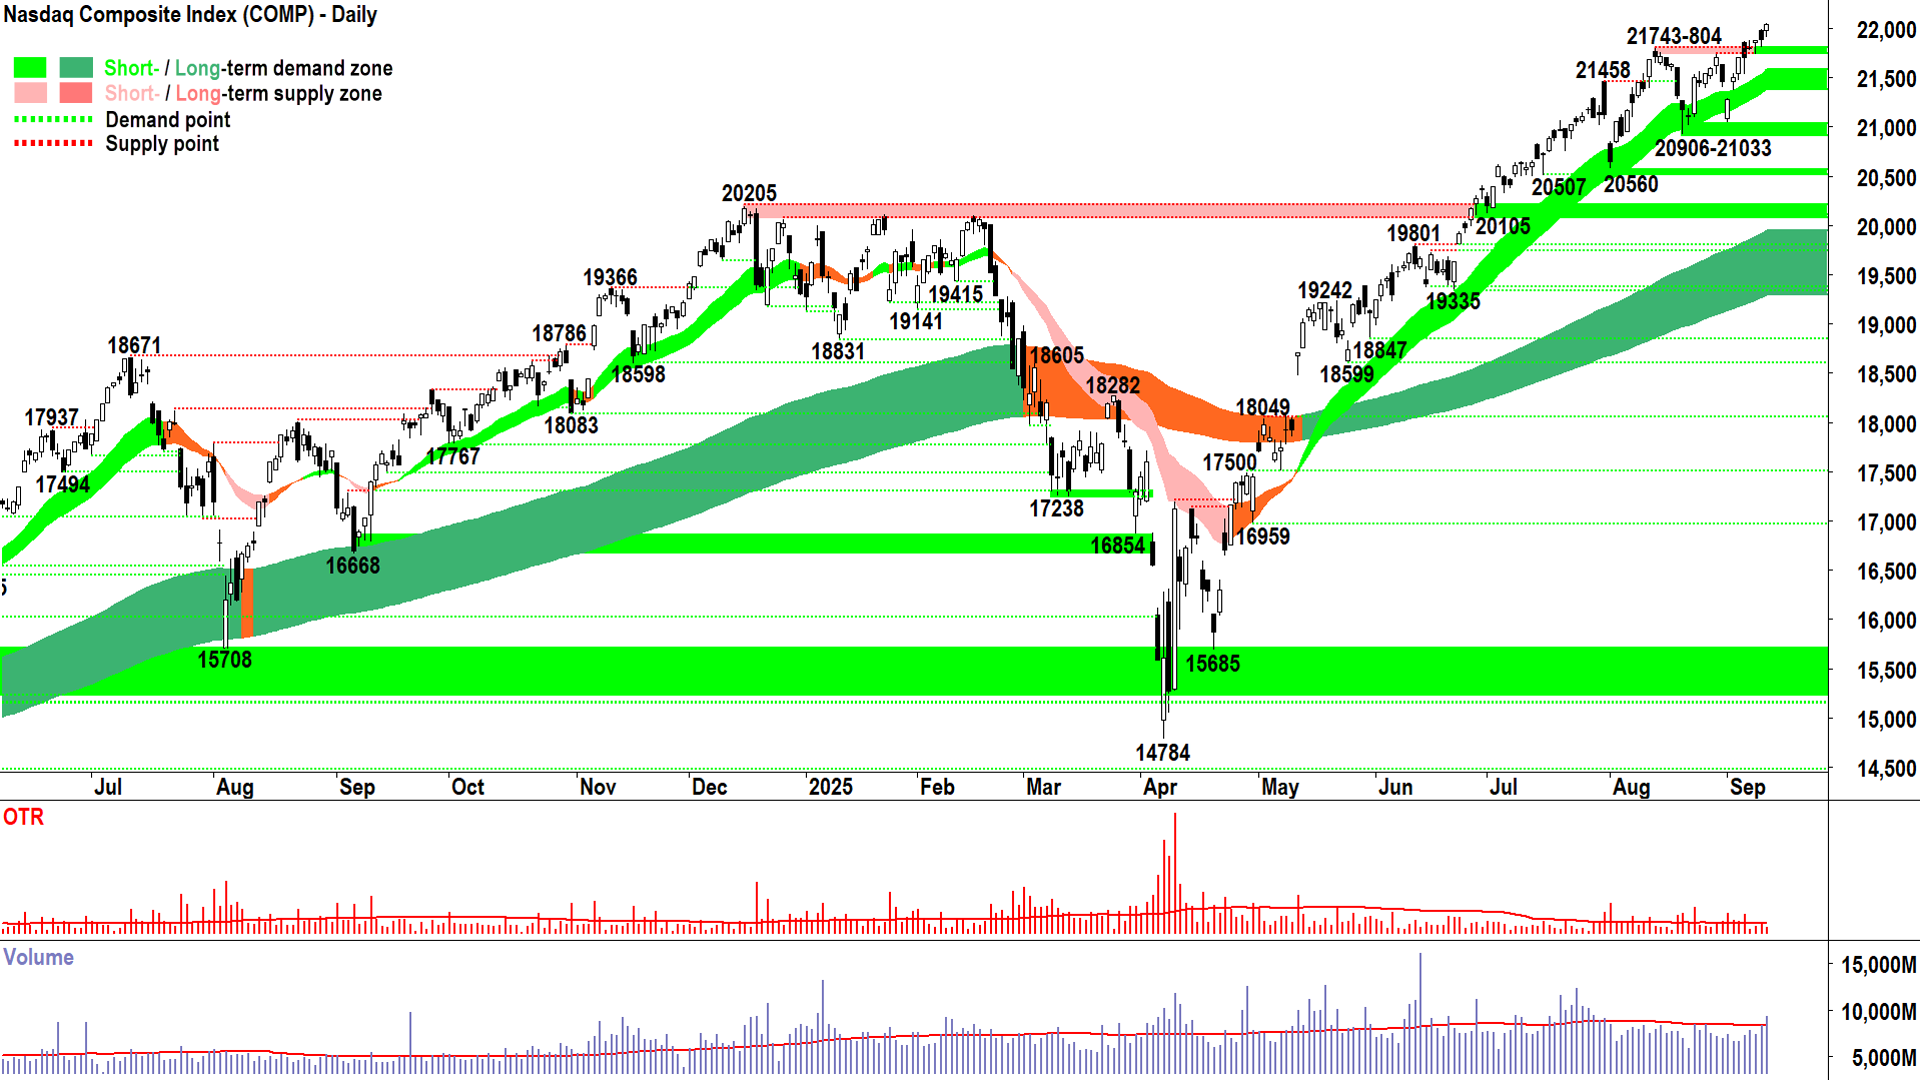
Nasdaq Composite Index

Nasdaq Composite Index chart (click here for full size image)
What did you expect? 🤷
After all, it is a bull market. Which when you really think about it – is just a silly name for “an environment of demand-side control”.
But I don’t think anyone will be adopting my definition for a rising market any time soon!
Silly animal names aside, you and I both know the only thing that really matters is: D + S = P.
And when D > S, then more often than not (“MOTN”) the result is P⬆️. It really is that simple (if you let it be… Oh, but Carl… what about those valuations!? 🙋).
I hope that some of the crazy stuff I say here – which I accept might be at odds with some of the other stuff you hear and read out there in Investor Land – is beginning to resonate.
Hey, you can pick your stocks anyway you want and listen to whoever you want – but if I can get just the slightest little bit of “Hmmm, what does the chart/trend say” in there 🤏 – then I have done my job!!! 💪
Back to the Comp. You know the drill:
ST & LT uptrends remain intact and ST & LT trend ribbons continue to act as zones of excess demand = Accumulation and buy the dip ✅
Price action remains rising peaks and rising troughs = Supply removal and demand reinforcement ✅
Candles remain predominantly demand-side (i.e., white-bodied and or downward pointing shadows) = Accumulation and buy the dip, pervasive programmed buy orders ✅
✅ + ✅ + ✅ = DEMAND-SIDE CONTROL = PROBABILITY P⬆️ > PROBABILITY P⬇️
= STAY THE COURSE: FRP
Stuff we don’t want to see 🧐:
Big supply-side candles (i.e., black-bodied and or upward pointing shadows) = Excess supply entering the market
Lower peak = Supply reinforcement
Close below ST uptrend ribbon = Nullifies the short term uptrend = ⚠️
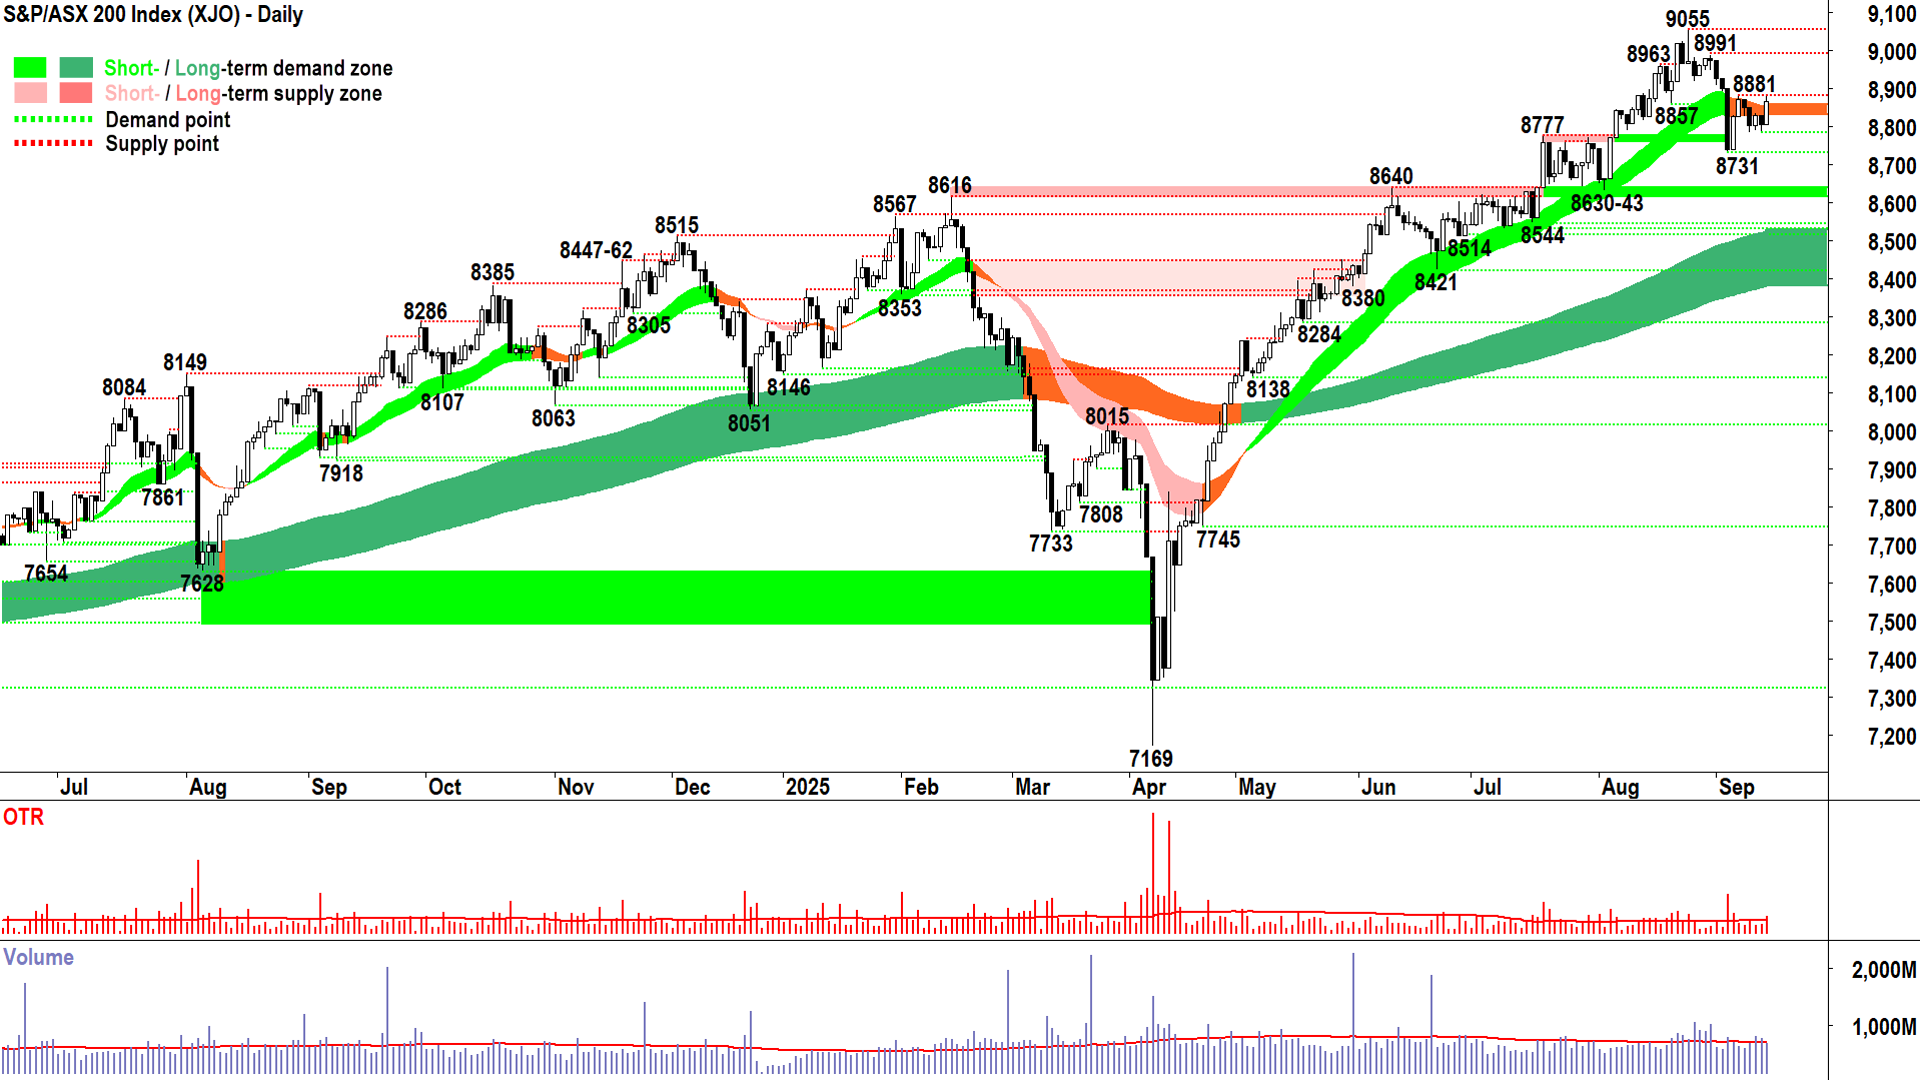
S&P/ASX 200 (XJO)
%20chart_12%20Sep.png)
S&P/ASX 200 chart (click here for full size image)
Better. But could have been even better, still.
You know what I want to see here – I want an emphatic close back above the trend ribbon, and preferably also above the high of "that candle" (i.e., the long black supply-side showing on Weds 3-Sep).
That candle remains (quite literally) a big black mark on the current bull market. I want the excess supply it represents dispensed with ASAP! 🥊
One more solid demand-side candle should do it, and it will also set us back to rising peaks and rising troughs. On this point, I note that today's higher high and higher low sets yesterday's low of 8782 as a higher trough to 8731 (8782 not labelled on above chart due to minimising clutter).
I also note that today's close is back above the short term trend ribbon – another step in the right direction. The ribbon remains neutral / equilibrium, however.
I've talked about the stuff we do want to see, the stuff we don't is nearly a copy and paste from above:
Big supply-side candles (i.e., black-bodied and or upward pointing shadows) = Excess supply entering the market
Lower peak = Supply reinforcement
Lower trough = Demand removal
Close below 8782, but below 8731 would be particularly devasting for the short term trend ⚠️
In the meantime, despite the (welcome) improvement here – I'm going to play it safe and remain at my present personal portfolio risk setting of 2/3RP (this means I can only use up 2/3 of my total portfolio risk on unhedged long positions).
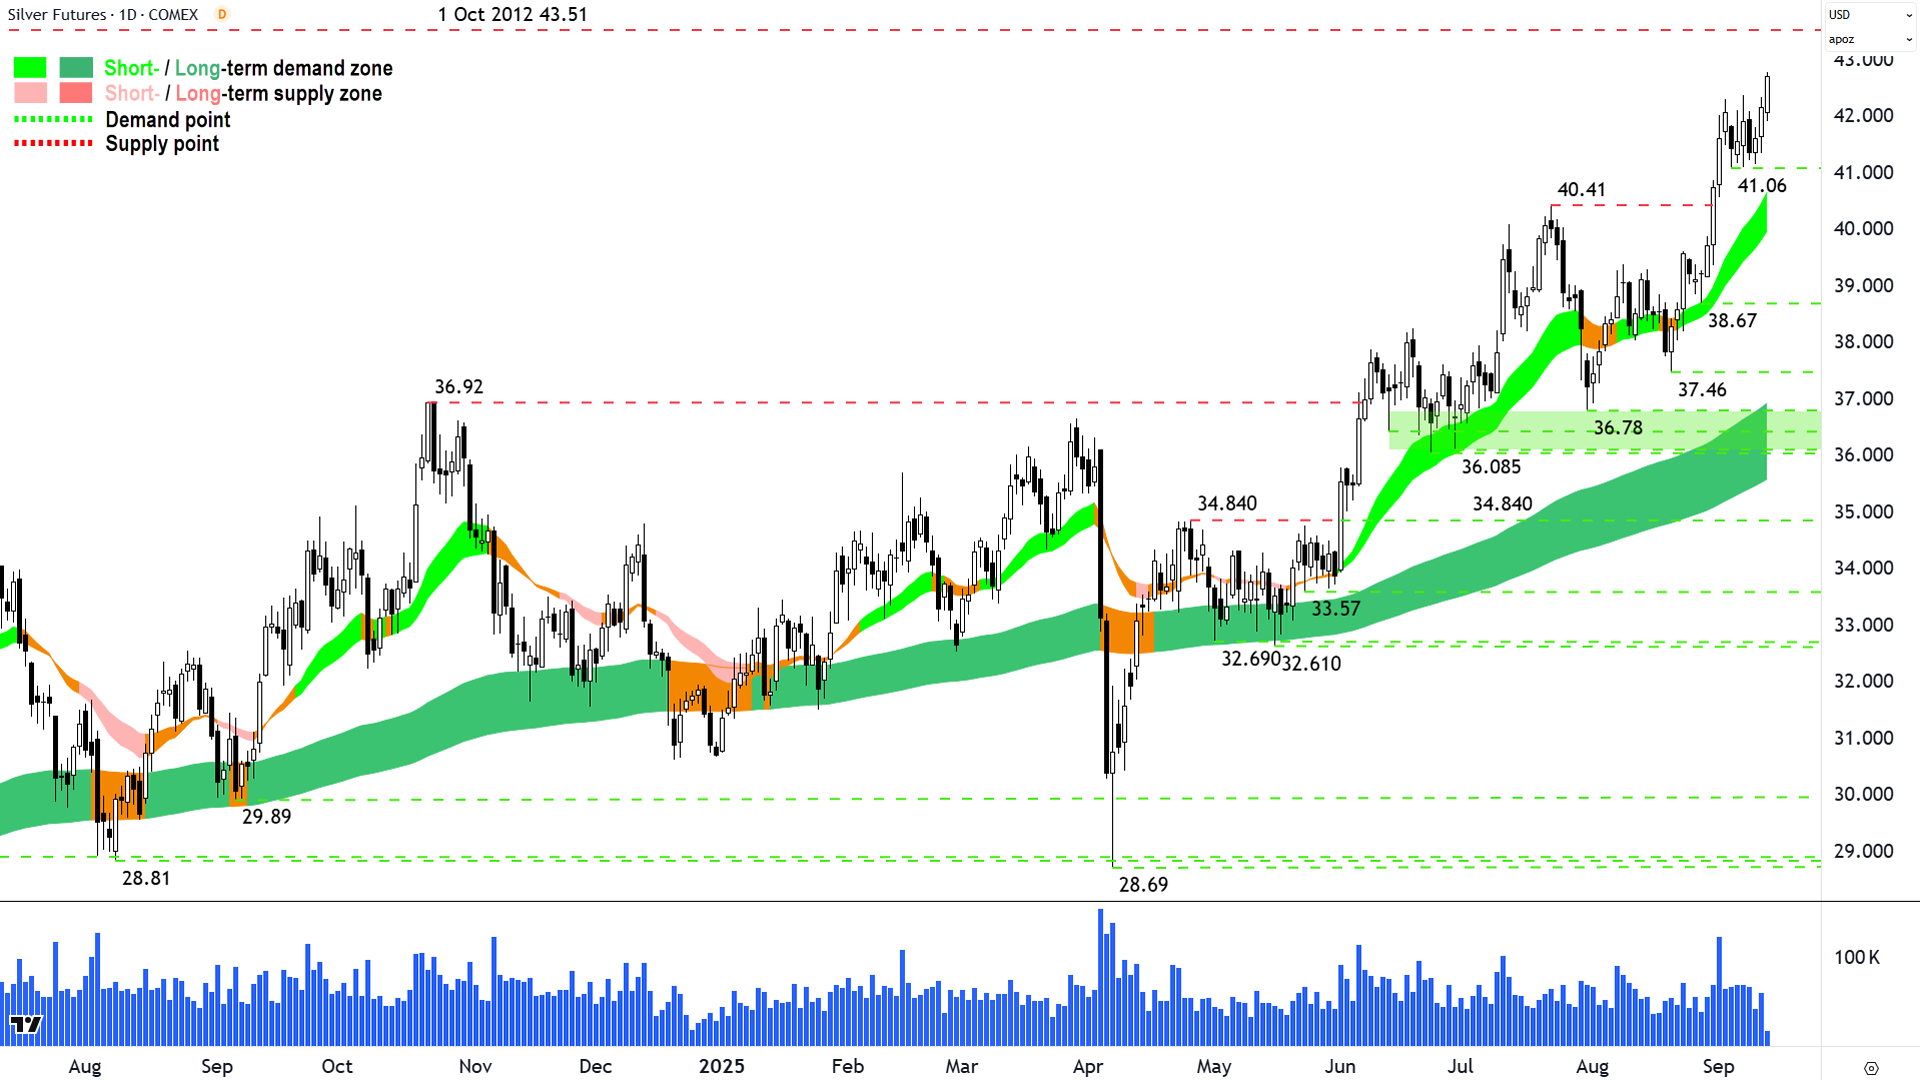
Silver Futures (Front month, back-adjusted) COMEX
%20COMEX%20chart_12%20Sep.png)
Silver is coming first 🥇 (click here for full size image)
The last time we covered silver and gold was in ChartWatch in the Evening Wrap on 1-Sep.
In that update, as with several before it, we had been tracking a new and strengthening short term uptrend in silver.
That uptrend continues to develop towards the point we have identified as the key major near term point of excess supply to contend with: The 1-Oct 2012 peak of 43.51.
That last candle is today’s candle – it’s live – so we must discount it. However, should we see today’s candle close as it currently looks or better – it would indicate substantial confidence approaching a major point of supply.
It would show the demand-side remains resolute, and more importantly, the supply-side remains disengaged.
Apart from that obvious key level approaching, everything else remains intact here (again, copying and pasting – that’s called CONSISTENCY!):
ST & LT uptrends remain intact and ST & LT trend ribbons continue to act as zones of excess demand = Accumulation and buy the dip ✅
Price action remains rising peaks and rising troughs = Supply removal and demand reinforcement ✅
Candles remain predominantly demand-side (i.e., white-bodied and or downward pointing shadows) = Accumulation and buy the dip, pervasive programmed buy orders ✅
✅ + ✅ + ✅ = DEMAND-SIDE CONTROL = PROBABILITY P⬆️ > PROBABILITY P⬇️
There’s absolutely nothing I dislike about this chart – and so I’m happy to stay FRP here (i.e., Full Risk Position). As always, I remain attentive to the usual warning signs, or a close below the last static point of demand at 41.06.
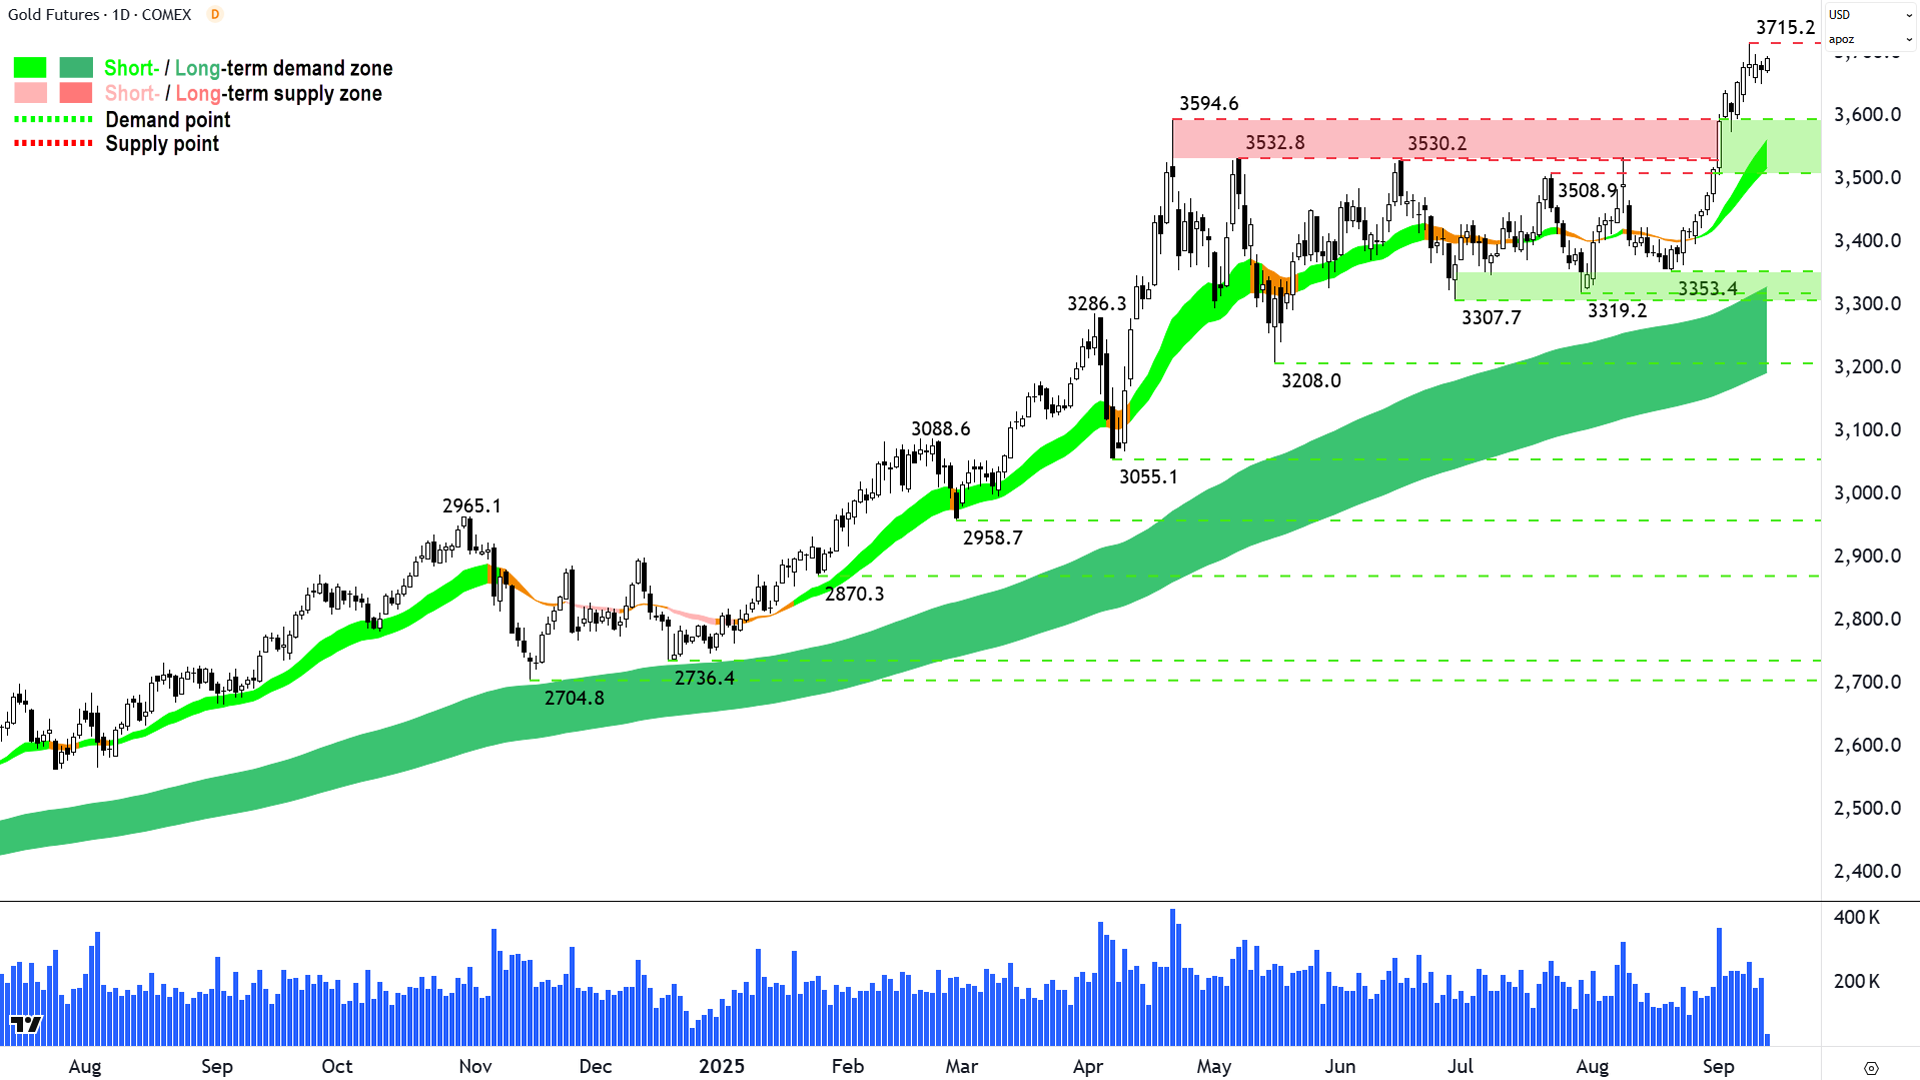
Gold Futures (Front month, back-adjusted) COMEX
%20COMEX%20chart_12%20Sep.png)
Gold is in silver medal position! 🥈 (click here for full size image)
I probably can't cover silver without also covering gold (note, for your reference, we also covered the two together in that 1-Sep update).
I'm going to keep this super brief, because there's only so many ways I can rephrase the concept of total and utter demand-side control... Which is exactly what we're also witnessing here with gold.
So, let me just give you the key downside levels to watch for:
3594.6 begins a zone of static excess demand which bottoms out at 3808.9 and includes the dynamic excess demand usually associated with the short term uptrend ribbon – a close below it would nullify gold's short term uptrend ⚠️.
Economy
Today
There weren't any major economic data releases in our time zone today.
Later this week
Saturday
00:00 Prelim UoM Consumer Sentiment & Inflation Expectations September
Consumer Sentiment: 58.2 forecast unchanged from August
Latest News
Interesting Movers
Trading higher
+36.1% Locksley Resources (LKY) – Continued positive response to 11-Sep LKY Doubles Landholding Abutting MP Materials in Mojave Hub, rise is consistent with prevailing short and long term uptrends, a regular in ChartWatch ASX Scans Uptrends list 🔎📈
+24.7% LTR Pharma (LTP) – No news, rise is consistent with prevailing short term uptrend and long term trend is transitioning from down to up 🔎📈
+18.0% Metallium (MTM) – No news, rise is consistent with prevailing short and long term uptrends, a regular in ChartWatch ASX Scans Uptrends list 🔎📈
+17.9% Lumos Diagnostics (LDX) – No news, rise is consistent with prevailing short and long term uptrends, a regular in ChartWatch ASX Scans Uptrends list 🔎📈
+17.2% Unico Silver (USL) – No news, general strength across the broader Precious Metals sector today, rise is consistent with prevailing short and long term uptrends, a regular in ChartWatch ASX Scans Uptrends list 🔎📈
+13.8% St George Mining (SGQ) – No news, general strength across the broader Precious Metals sector today, rise is consistent with prevailing short and long term uptrends, a regular in ChartWatch ASX Scans Uptrends list 🔎📈
+13.6% Zenith Minerals (ZNC) – Continued positive response to 11-Sep Red Mountain Drilling Demonstrates Higher-Grade Gold System, rise is consistent with prevailing short term uptrend and long term trend is transitioning from down to up 🔎📈
+12.7% Vertex Minerals (VTX) – No news, general strength across the broader Precious Metals sector today, rise is consistent with prevailing short and long term uptrends, a regular in ChartWatch ASX Scans Uptrends list 🔎📈
+12.0% Boab Metals (BML) – Appointment of Project Director for Sorby Hills Project, general strength across the broader Precious Metals sector today, rise is consistent with prevailing short and long term uptrends, a regular in ChartWatch ASX Scans Uptrends list 🔎📈
+11.7% Mithril Resources (MTH) – No news, general strength across the broader Precious Metals sector today, rise is consistent with prevailing short and long term uptrends, a regular in ChartWatch ASX Scans Uptrends list 🔎📈
+11.6% Brightstar Resources (BTR) – Annual Report to Shareholders, general strength across the broader Precious Metals sector today.
+11.3% Nanoveu (NVU) – No news, bounced in the wake of the recent sharp selloff.
+9.8% Sunrise Energy Metals (SRL) – No news, rise is consistent with prevailing short and long term uptrends, a regular in ChartWatch ASX Scans Uptrends list 🔎📈
+9.5% West Coast Silver (WCE) – No news, general strength across the broader Precious Metals sector today, rise is consistent with prevailing short and long term uptrends, a regular in ChartWatch ASX Scans Uptrends list 🔎📈
Trading lower
-8.4% Predictive Discovery (PDI) - No news 🤔.
-6.9% 4DMEDICAL (4DX) - Updated Top 20 Option Holders & Distribution Schedule and Supplementary announcement - 4DX agreements, pulled back in the wake of recent sharp rally.
-6.4% Aura Energy (AEE) - No news, pulled back in the wake of recent sharp rally.
-6.3% Sayona Mining (SYA) - Change in substantial holding (Bank of New York Mellon, decrease from 33.7% to 32.4%).
-5.8% Catalyst Metals (CYL) - No news, pulled back in the wake of recent sharp rally.
-4.7% Mesoblast (MSB) - Change of Director's Interest Notice (an increase, so not necessarily explaining today's fall, but news nonetheless!).
-3.4% Woodside Energy Group (WDS) - No news, general weakness across the broader Energy sector today, fall is consistent with prevailing short term downtrend and long term trend is transitioning from up to down 🔎📉 ChartWatch.
-3.3% Austin Engineering (ANG) - No news, fall is consistent with prevailing short and long term downtrends, a regular in ChartWatch ASX Scans Downtrends list 🔎📉.
-3.3% Beach Energy (BPT) - No news, general weakness across the broader Energy sector today, fall is consistent with prevailing short and long term downtrends, a regular in ChartWatch ASX Scans Downtrends list 🔎📉.
Broker Moves
Aeris Resources (AIS)
Retained at speculative buy at Morgans; Price Target: $0.43 from $0.31
Boss Energy (BOE)
Retained at speculative buy at Canaccord Genuity; Price Target: $3.65
Retained at hold at Ord Minnett; Price Target: $2.10
Downer EDI (DOW)
Retained at accumulate at Ord Minnett; Price Target: $7.90 from $7.70
GQG Partners Inc. (GQG)
Retained at buy at UBS; Price Target: $2.25 from $2.35
Humm Group (HUM)
Retained at buy at Ord Minnett; Price Target: $0.81
Infragreen Group (IFN)
Initiated at buy at Morgans; Price Target: $1.30
Kingsgate Consolidated (KCN)
Upgraded to buy from speculative buy at Canaccord Genuity; Price Target: $4.95 from $4.50
Macquarie Group (MQG)
Retained at equal-weight at Morgan Stanley; Price Target: $216.00
Perenti (PRN)
Retained at buy at Citi; Price Target: $2.55
SEEK (SEK)
Retained at overweight at Morgan Stanley; Price Target: $32.50
Select Harvests (SHV)
Retained at buy at Bell Potter; Price Target: $5.45 from $5.30
Service Stream (SSM)
Retained at buy at Citi; Price Target: $2.65 from $2.45
Retained at outperform at Macquarie; Price Target: $2.70 from $2.42
Upgraded to buy from accumulate at Ord Minnett; Price Target: $2.57 from $2.35
Ventia Services Group (VNT)
Upgraded to accumulate from hold at Ord Minnett; Price Target: $5.25 from $5.20
Scans
Top Gainers
Code | Company | Last | % Chg |
|---|---|---|---|
| T3D | 333D Ltd | $0.16 | +102.53% |
| LKY | Locksley Resources Ltd | $0.49 | +36.11% |
| TG1 | Techgen Metals Ltd | $0.036 | +33.33% |
| L1M | Lightning Minerals Ltd | $0.053 | +32.50% |
| BMM | Bayan Mining and Minerals Ltd | $0.20 | +25.00% |
Top Fallers
Code | Company | Last | % Chg |
|---|---|---|---|
| HFR | Highfield Resources Ltd | $0.066 | -25.84% |
| KLR | Kaili Resources Ltd | $0.275 | -17.91% |
| AMS | Atomos Ltd | $0.011 | -15.39% |
| H2G | GREENHY2 Ltd | $0.011 | -15.39% |
| MQR | Marquee Resources Ltd | $0.011 | -15.39% |
52 Week Highs
Code | Company | Last | % Chg |
|---|---|---|---|
| LKY | Locksley Resources Ltd | $0.49 | +36.11% |
| MTM | Metallium Ltd | $1.05 | +17.98% |
| LDX | Lumos Diagnostics Holdings Ltd | $0.165 | +17.86% |
| XRG | Xreality Group Ltd | $0.062 | +16.98% |
| EVR | EV Resources Ltd | $0.014 | +16.67% |
52 Week Lows
Code | Company | Last | % Chg |
|---|---|---|---|
| HFR | Highfield Resources Ltd | $0.066 | -25.84% |
| RVT | Richmond Vanadium Technology Ltd | $0.065 | -8.45% |
| EVE | EVE Health Group Ltd | $0.026 | -7.14% |
| DM1 | Desert Metals Ltd | $0.015 | -6.25% |
| AA2 | Ariana Resources Plc | $0.28 | -5.09% |
Near Highs
Code | Company | Last | % Chg |
|---|---|---|---|
| PCI | Perpetual Credit Income Trust | $1.19 | 0.00% |
| WVOL | Ishares MSCI World Ex Aust Minimum Volatility ETF | $44.06 | +0.14% |
| IAGPF | Insurance Australia Group Ltd | $104.70 | +0.23% |
| VVLU | Vanguard Global Value Equity Active ETF | $77.20 | +0.73% |
| IHD | Ishares S&P/ASX DIV Opportunities Esg Screened ETF | $16.15 | +1.00% |
Relative Strength Index (RSI) Oversold
Code | Company | Last | % Chg |
|---|---|---|---|
| PEN | Peninsula Energy Ltd | $0.29 | -1.69% |
| REA | REA Group Ltd | $227.09 | -2.25% |
| PNI | Pinnacle Investment Management Group Ltd | $18.62 | -0.05% |
| REH | Reece Ltd | $10.18 | -2.49% |
| EBO | Ebos Group Ltd | $26.15 | -0.27% |
