News | Market Wraps
Evening Wrap: ASX 200 ekes gain despite sagging mining, energy stocks as sublime CBA does it again!
The S&P/ASX 200 closed 3.7 points higher, up 0.04%.

Mentioned
The S&P/ASX 200 closed 3.7 points higher, up 0.04%.
Strong gains in US stocks overnight, very decent gains in Europe, and strong gains across Asia today, weren't enough to spark the ASX 200 past a sliver of a gain.
Why? Sagging Resources and Energy stocks...again! But don't fret...the big banks led by Commonwealth Bank of Australia (CBA) rode to our rescue again today! 💪
To make sense of all the above, I have detailed technical analysis on the Nasdaq Composite, S&P/ASX 200, and Brent Crude Oil in today's ChartWatch.
Be sure to click/scroll through for the usual reporting of the major sector and stock-specific moves, the broker responses to them, as well as all the key economic data in tonight's Evening Wrap.
Let's dive in!
Today in Review
Wed 25 Jun 25, 5:14pm (AEST)
Name | Value | % Chg |
|---|---|---|
Major Indices | ||
| ASX 200 | 8,559.2 | +0.04% |
| All Ords | 8,779.9 | +0.06% |
| Small Ords | 3,212.4 | -0.09% |
| All Tech | 4,015.8 | -0.21% |
| Emerging Companies | 2,238.3 | +0.40% |
Currency | ||
| AUD/USD | 0.6499 | +0.15% |
US Futures | ||
| S&P 500 | 6,147.75 | +0.02% |
| Dow Jones | 43,437.0 | +0.03% |
| Nasdaq | 22,426.5 | +0.06% |
Name | Value | % Chg |
|---|---|---|
Sector | ||
| Financials | 9,632.5 | +1.15% |
| Consumer Discretionary | 4,114.3 | +0.22% |
| Utilities | 9,264.9 | +0.15% |
| Real Estate | 3,978.7 | +0.03% |
| Industrials | 8,328.9 | -0.25% |
| Information Technology | 2,941.6 | -0.42% |
| Consumer Staples | 12,225.9 | -0.53% |
| Health Care | 41,365.4 | -0.58% |
| Communication Services | 1,834.5 | -0.60% |
| Energy | 8,670.6 | -0.81% |
| Materials | 15,601.4 | -1.27% |
Markets
%20intraday%20chart%2025%20Jun%202025.png)
ASX 200 Session Chart
The S&P/ASX 200 (XJO) finished 3.7 points higher at 8,559.2, 0.14% from its session high and 0.21% from its low. Despite the benchmark sneaking into the black, in the broader-based S&P/ASX 300 (XKO) advancers lagged decliners by 124 to 149.
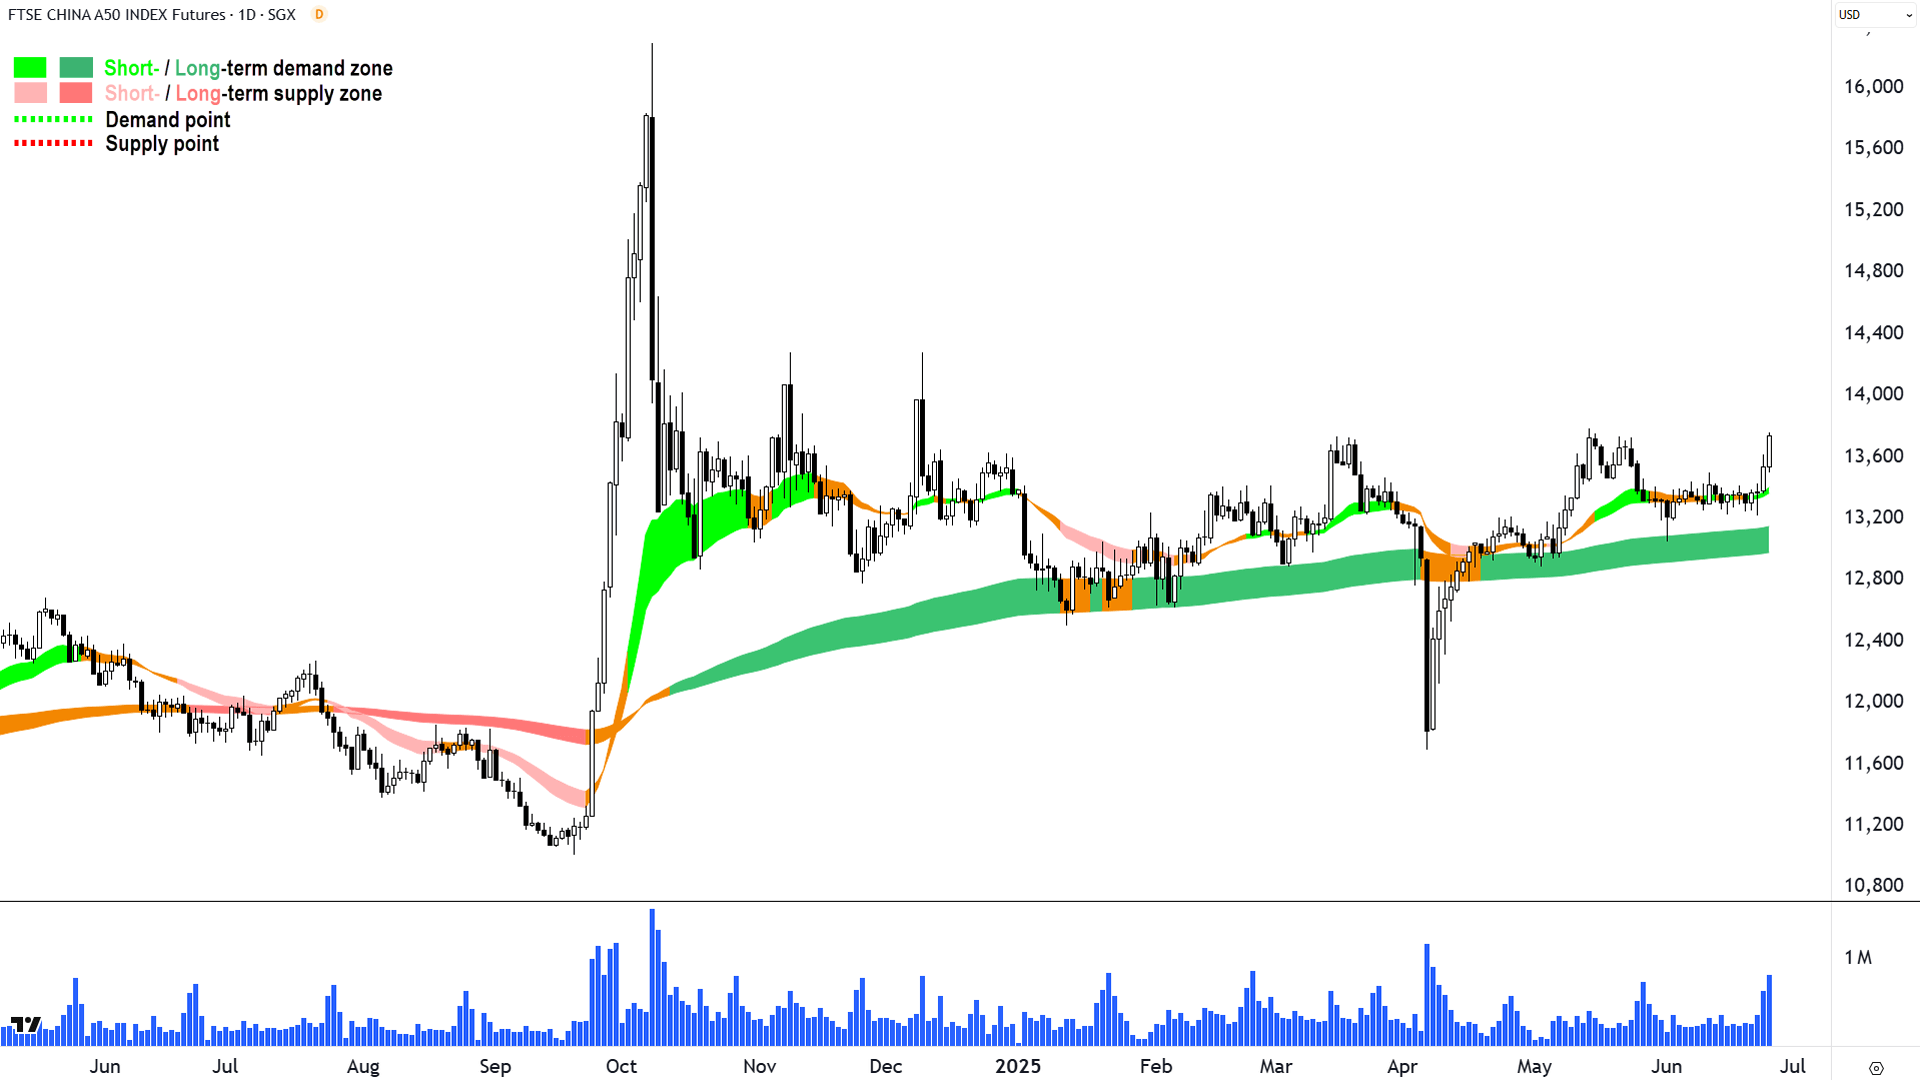
Strong gains in US stocks overnight, very decent gains in Europe (up but generally closed off highs), and strong gains across Asia today (FTSE China A50 chart below)...

FTSE China A50 (click here for full size image)
The ASX200? Hmmm...not so much 👎. A little bit of a failure to fire today 😭.
Why? Well despite the benchmark Chinese mainland stock index above being on track to close at its best level this year – trade War, Real War, and everything, our Resources (XJR) (-1.3%) sector let us down today... Again!
Grrrr...thanks BHP Group (BHP) (-1.0%), Fortescue (FMG) (-2.3%), Mineral Resources (MIN) (-6.0%), and Rio Tinto (RIO) (-0.6%). Of course, ChartWatch ASX Scans followers likely own none of these stocks due to their respective well-entrenched downtrends...📉🚫
The Gold sub-index (XGD) (-2.2%) was worse off again as the big funds continue to rotate out of the sector due to a whiff of weakness in the gold price. The apparent calming of tensions in the Middle East is not helping here, and is also dragging on the Energy (XEJ) (-0.80%) sector, which held up well given the rout in crude oil prices (see ChartWatch below for technical analysis of Brent crude oil).
So, if all that stuff was down (again), then what helped the ASX 200 claw its way back to better than even? Well that would be the big Financials (XFJ) (+1.1%), which despite their modest improvement today, are so big it makes up for plenty else. 61-times ChartWatch ASX Scans Feature Uptrend winner Commonwealth Bank of Australia (CBA) (+1.7%) no doubt extracted further tears from many a value-focussed fund manager!
Fund flows huh? I guess you're either on the right side of them or not. I know where I'd rather be...🤔
Today's best blue chips:
Company | Last Price | Change $ | Change % | 1mo % | 1yr % |
|---|---|---|---|---|---|
Light & Wonder (LNW) | $142.20 | +$13.49 | +10.5% | +4.4% | -6.6% |
Paladin Energy (PDN) | $7.75 | +$0.26 | +3.5% | +23.4% | -42.5% |
SGH (SGH) | $55.24 | +$0.95 | +1.8% | +10.4% | +49.5% |
ANZ Group (ANZ) | $29.10 | +$0.5 | +1.7% | +1.5% | +0.6% |
Commonwealth Bank (CBA) | $191.40 | +$3.27 | +1.7% | +10.1% | +49.9% |
AMP (AMP) | $1.250 | +$0.02 | +1.6% | -3.5% | +15.7% |
Reece (REH) | $17.13 | +$0.27 | +1.6% | +11.7% | -33.2% |
James Hardie (JHX) | $38.39 | +$0.5 | +1.3% | +7.7% | -18.0% |
Metcash (MTS) | $3.97 | +$0.05 | +1.3% | +17.5% | +5.0% |
Charter Hall Group (CHC) | $19.55 | +$0.24 | +1.2% | +9.8% | +59.7% |
Fisher & Paykel Healthcare (FPH) | $33.80 | +$0.38 | +1.1% | +1.4% | +20.3% |
Macquarie Group (MQG) | $216.87 | +$2.37 | +1.1% | +4.7% | +9.0% |
Flight Centre Travel (FLT) | $12.65 | +$0.13 | +1.0% | -4.0% | -36.1% |
Block (XYZ) | $100.00 | +$1.02 | +1.0% | +9.8% | +5.6% |
Suncorp Group (SUN) | $21.75 | +$0.2 | +0.9% | +5.4% | +31.6% |
Resmed Inc (RMD) | $39.50 | +$0.35 | +0.9% | +5.6% | +23.6% |
Qantas Airways (QAN) | $10.40 | +$0.08 | +0.8% | +1.1% | +72.5% |
The Lottery Corp (TLC) | $5.23 | +$0.04 | +0.8% | -3.0% | +1.7% |
National Australia Bank (NAB) | $40.05 | +$0.3 | +0.8% | +7.1% | +10.6% |
Westpac Banking Corp (WBC) | $34.54 | +$0.25 | +0.7% | +10.5% | +26.8% |
Today's worst blue chips:
Company | Last Price | Change $ | Change % | 1mo % | 1yr % |
|---|---|---|---|---|---|
Mineral Resources (MIN) | $20.18 | -$1.28 | -6.0% | -16.2% | -63.8% |
Pilbara Minerals (PLS) | $1.245 | -$0.04 | -3.1% | -10.1% | -60.0% |
South32 (S32) | $2.84 | -$0.08 | -2.7% | -6.9% | -23.7% |
Northern Star (NST) | $19.28 | -$0.52 | -2.6% | -8.0% | +40.6% |
IGO (IGO) | $3.94 | -$0.1 | -2.5% | -7.5% | -29.4% |
Fortescue (FMG) | $14.88 | -$0.35 | -2.3% | -4.2% | -31.5% |
Whitehaven Coal (WHC) | $5.45 | -$0.12 | -2.2% | -0.4% | -31.4% |
Treasury Wine (TWE) | $7.84 | -$0.16 | -2.0% | -5.0% | -37.9% |
Sandfire Resources (SFR) | $10.99 | -$0.22 | -2.0% | -0.3% | +23.5% |
Ampol (ALD) | $24.92 | -$0.42 | -1.7% | -1.5% | -24.0% |
Nextdc (NXT) | $14.25 | -$0.24 | -1.7% | +9.1% | -19.4% |
Atlas Arteria (ALX) | $5.13 | -$0.08 | -1.5% | -2.1% | +1.0% |
Life360 (360) | $31.40 | -$0.45 | -1.4% | -2.3% | +100.5% |
Dexus (DXS) | $6.83 | -$0.09 | -1.3% | -2.3% | +4.3% |
Lynas Rare Earths (LYC) | $9.07 | -$0.11 | -1.2% | +11.3% | +49.4% |
Santos (STO) | $7.57 | -$0.09 | -1.2% | +17.5% | -0.7% |
CSL (CSL) | $238.45 | -$2.77 | -1.1% | -3.5% | -18.6% |
Dyno Nobel (DNL) | $2.63 | -$0.03 | -1.1% | +0.8% | -7.7% |
IDP Education (IEL) | $3.57 | -$0.04 | -1.1% | -56.2% | -75.4% |
Newmont Corp (NEM) | $89.01 | -$0.96 | -1.1% | +7.6% | +37.6% |
ChartWatch
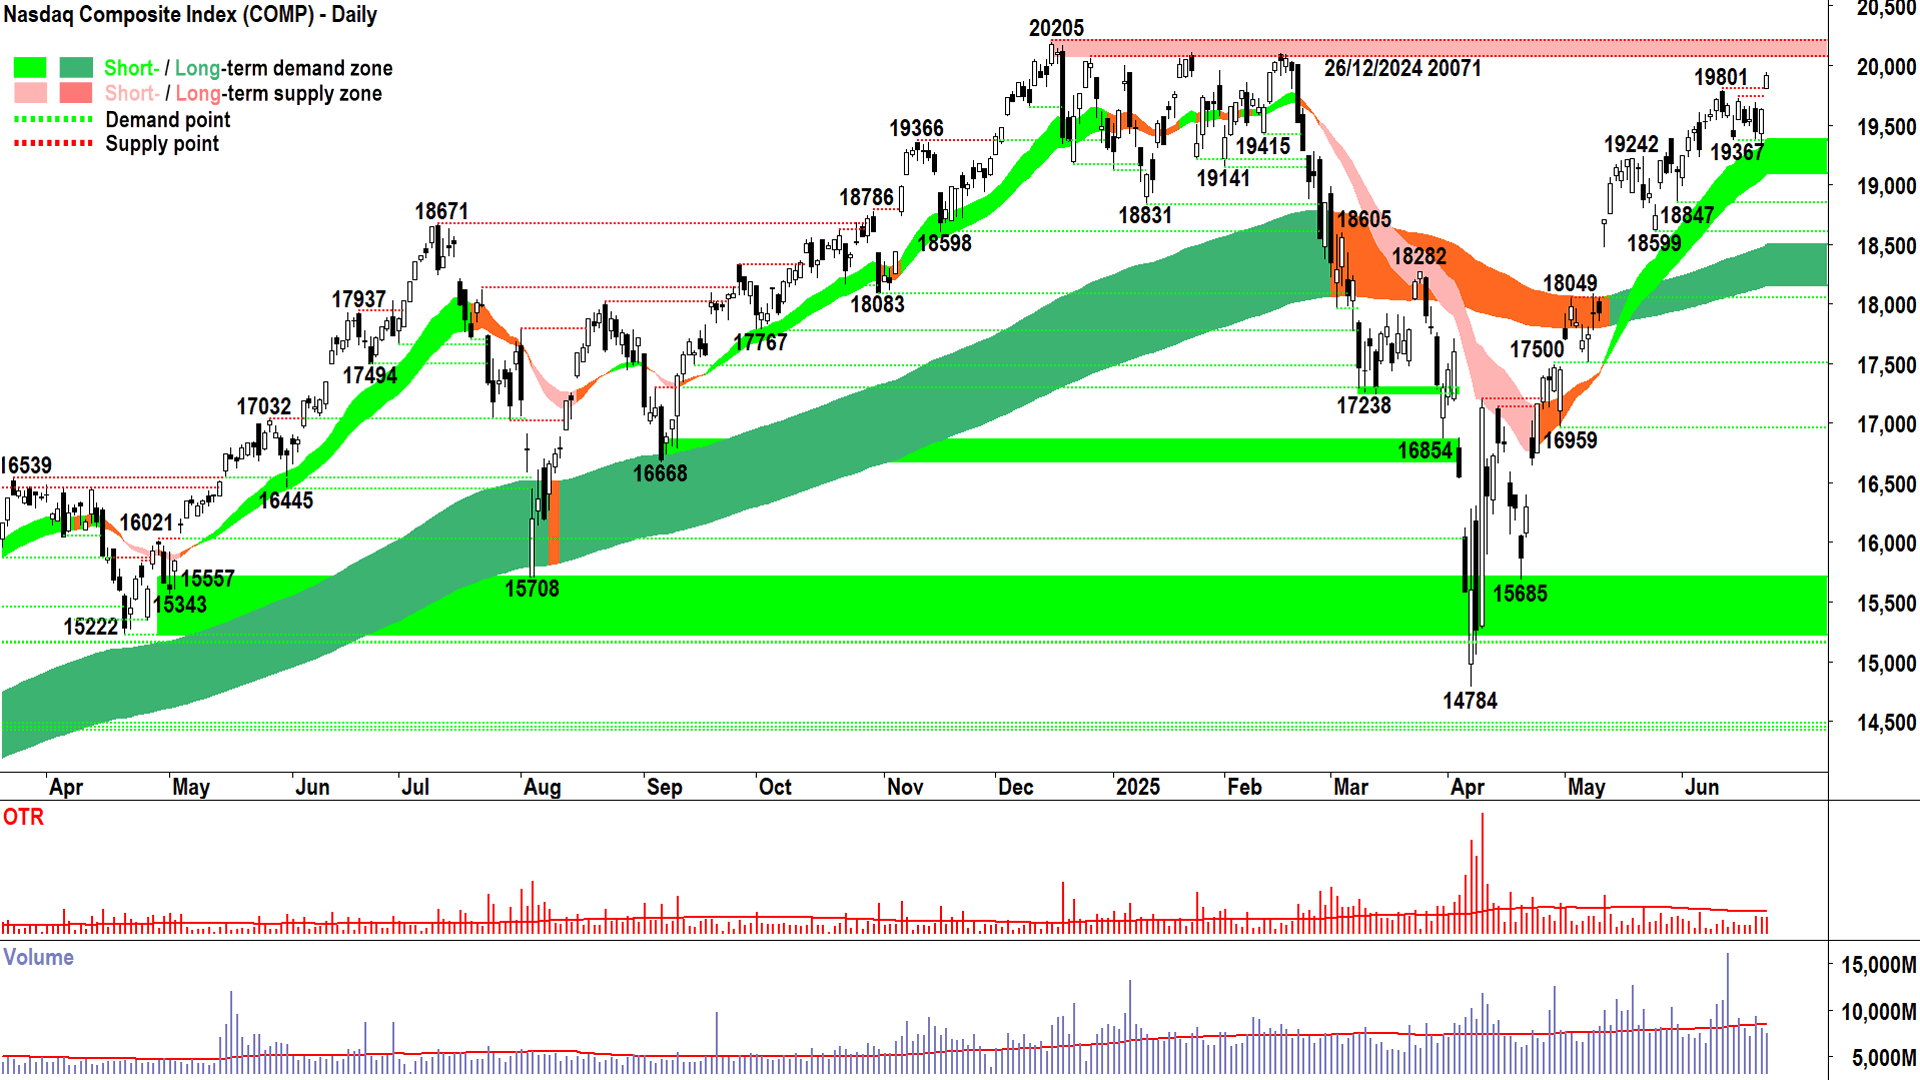
NASDAQ Composite Index

If it can’t go down... (click here for full size image)
Well, that was a bit of a boilover! 😁
A couple of weeks ago I shared a snippet of one of my learnings over the years:
If it can’t go down, it’ll probably go up!
So often, you will see that in the face of what would appear to most sensible people as insurmountable odds…a stock or an index fails to fall / crash as the “experts” predicted… Sure, it may ease back a little…again to the confusion and disdain of the naysayers – but then on the slightest of perceived good news – it shoots through the roof 🚀.
If it can’t go down, it’ll probably go up. Trade War. Real War. Yet here we are within spitting distance of record highs.
Consider why the Comp couldn’t go down? 🤔
Because of an excess of latent demand in the system…demand that has assessed the risks and still wanted/wants to own stocks (i.e., extremely risky assets!). Similarly, despite the perceived risks, there simply isn’t enough motivated supply (from the naysayers) to break the will of that latent demand.
And then the “bad” news subsides, and a bit of “good” news comes out…and the naysayers are left scrambling to cover their shorts or underweight positions into an already demand-side controlled market.
It really is a thing of beauty, and seeing it play out still gives me great pleasure! Oh, memories of the days way back when I put serious weight on news, fundamentals, and valuations (nostalgic tear drips from left eye 🥲).
“…in the face of what would appear to most sensible people”
"Sensible!"
Fortunately, I don’t fit into that camp anymore. I am the opposite of sensible. Reckless! Crazy! Ignorant! Destined for failure!
As my fundamental analysis friends will assure both you and I! 😤
I agree, though. Placing one’s entire faith in a bunch of black, white, orange, green, and pink pixels (really, that’s all my model is!) – certainly seems the opposite of sensible.
And yet, I have found that for me it is the best way. And that’s my message today: Find what works for you and just do it (okay, that last bit’s not mine!).
Okay, I better do some Comp analysis now, but I suspect if you’ve been a long-time sufferer of my rantings here, you already know what I’m about to write – which is exactly my goal by the way! 💪
The Comp chart, via trends, price action, and candles, is a picture of demand-side control. I cannot tell the future, I can only tell the now, but I believe that more often than not (“MOTN”), demand-side control is consistent with rising prices. Therefore, I am FRP (“Full Risk Position”). This will change if I begin to see the tell-tale signs of excess supply creeping in (e.g., large supply-side candles, changing trends, changing price action etc.).
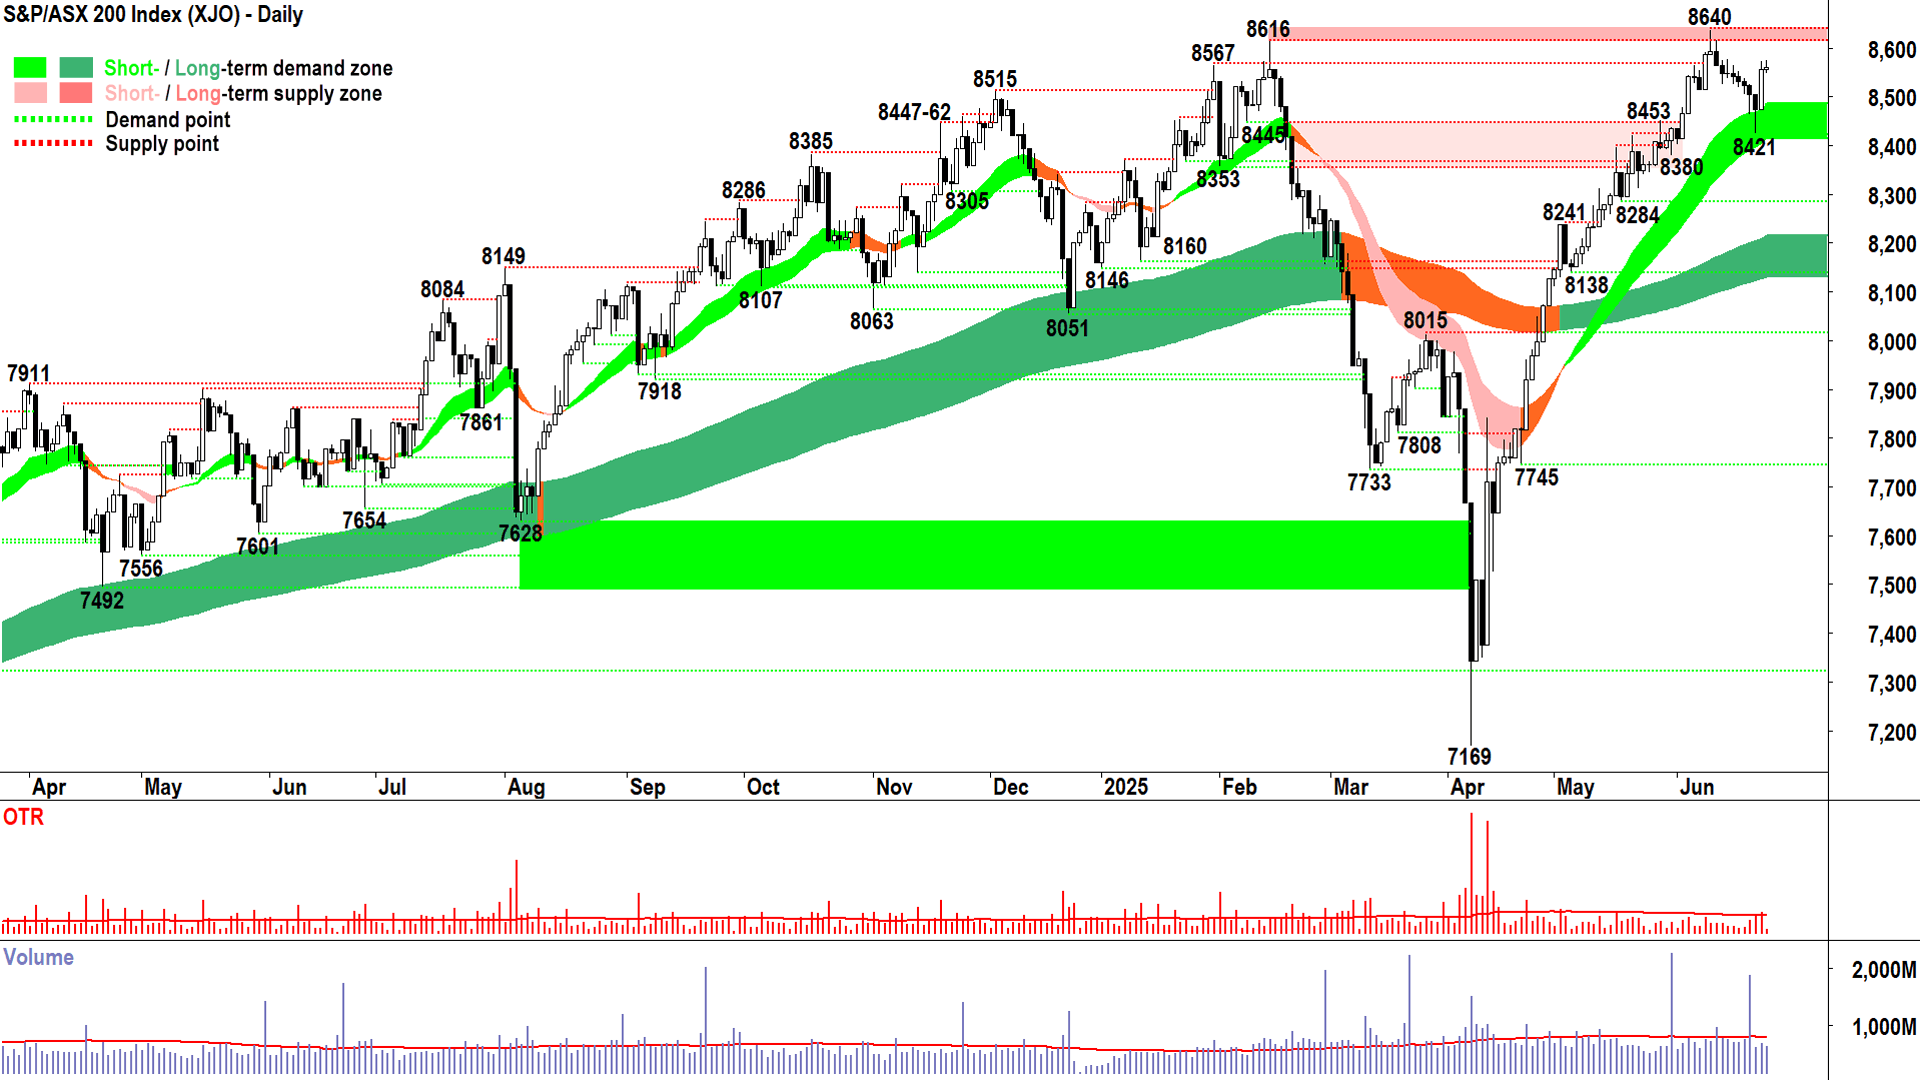
S&P/ASX 200 (XJO)
%20chart%2025%20Jun%202025.png)
An interesting chart (click here for full size image)
What do the black, white, orange, green, and pink pixels say about the little Aussie battler, our beloved XJO? 🤔
They suggest far less enthusiasm to pressure new highs here than on the Comp. Perhaps our heroics were spent in yesterday's candle…
Still, it’s not like there was a whole heap of supply around today, below average volume suggests this – it was a case of not a great deal of motivated demand hitting not a great deal of motivated supply.
Look past today’s malaise, though, and I can see a broader environment of solid excess demand. From rising trend ribbons – each doing an excellent job of acting as dynamic demand zones, to rising peaks and rising troughs price action (i.e., equals supply removal and demand reinforcement), and a predominance of demand-side candles (i.e., white-bodied and or downward pointing shadows equals buy the dip / accumulation).
The zone defined by the last two most prominent all-time highs of 8616-8640 is the main event. We’ve never closed in there – but if we can – we’ll most likely set a new all-time high and hopefully quite a bit more 🤞.
If on the other hand, we see the tell-tale signs of excess supply in that zone (detailed in the Comp analysis above), we’ll at least need to spend some time around here…soaking up supply and firming up demand…or it could be more sinister – we’ll just have to see how the candles fall.
Until then, and until the XJO closes below the new 8421 point of demand / short term uptrend ribbon, I am very much FRP / stay the course here.
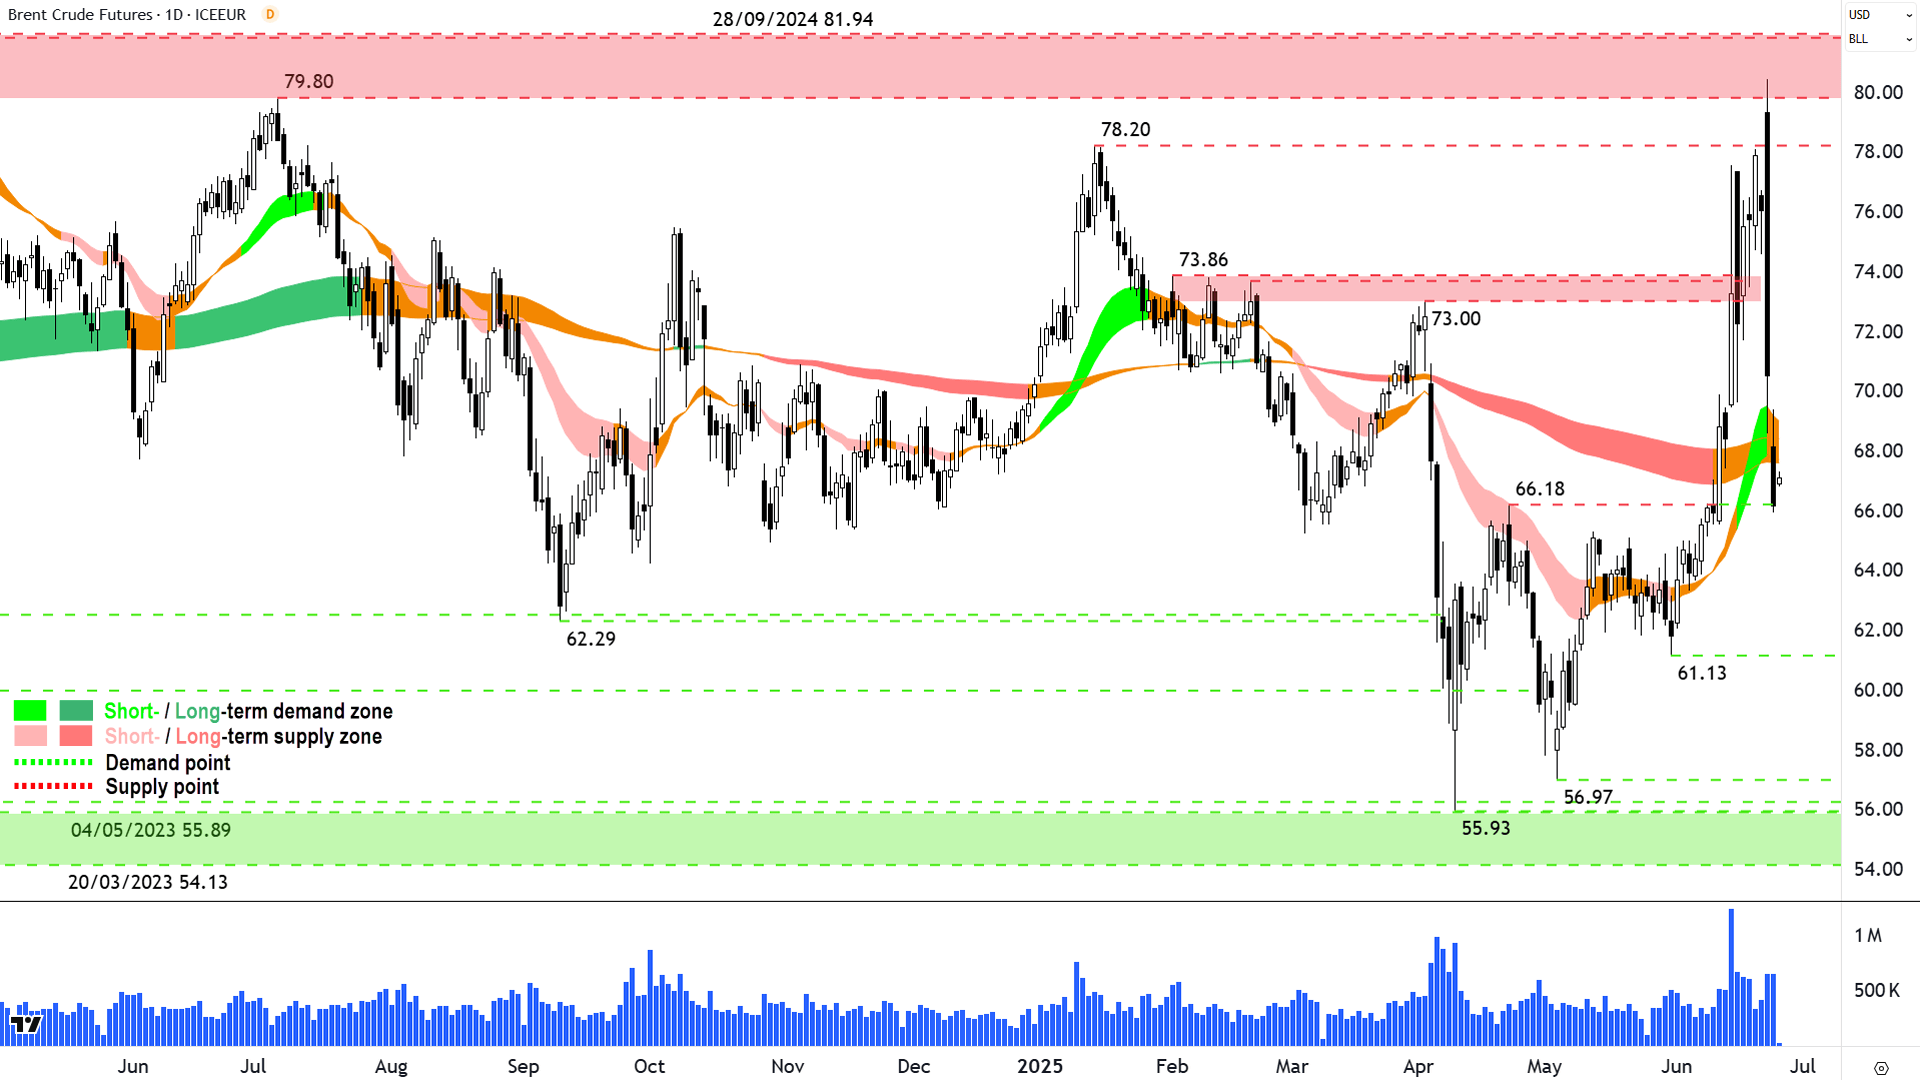
Brent Crude Oil Futures (Front month, back-adjusted) ICE
%20ICE%20chart%2025%20Jun%202025.png)
Stuck in the middle with crude…🎵🎶 (click here for full size image)
Israel to the left, Iran to the right…and here we are, stuck in the middle with crude…🎵🎶
Okay, that’s terrible…🤦
But, after Monday’s species ending event supply-side candle, “in the middle” is where Brent crude oil is likely to remain for the foreseeable future.
The last time we covered Brent was on that Monday candle, but it was only a fraction of its final blackness by that stage (about 76.85). Note that today’s chart and Monday’s might appear different because there has been a contract roll, which means the prices have changed. This is normal! Don’t panic…all the major points of demand and supply remain intact – they’re just at different prices now!
Anyways, on Monday, the supply-side candle that was there – topping out smack bang in the major, major historic supply zone of 79.80-81.94 – was a solid indication that Brent had its work cut out to move much higher.
It wasn’t meant to be this time around. There will be no “moving into a new trading range and a new psychological acceptance by the market that crude prices can go materially higher”.
The price action suggests quite the opposite. Monday’s candle ended up being a monster, a wall of excess supply. Demand just melted away. And then Tuesday’s near-total lack of demand-side response, and continued supply-side domination seals the deal here. Even 66.18 fell by its close. (The last candle on the chart above is today’s candle, it’s live…so discount it!)
So, at best, Brent is back in its range… where it could oscillate for a very long time.
Considering what awful things would likely need to occur in the Middle East to break it through the top of the range, it’s probably a good thing too.
Economy
Today
AUS Consumer Price Index (CPI) May
Headline: +2.1% p.a. actual vs +2.4% p.a. forecast and +2.4% p.a. in April
Trimmed mean: +2.4% p.a. vs +2.8% p.a. in April
Comment: "In the next meeting, the RBA is going to focus mostly on the encouraging trimmed mean measure (which strips out the large outliers including falls in electricity or fuel). The monthly trimmed mean has been inside the RBA target band for 6 consecutive months now and points to a mild June quarter reading of just 2.5%." – My Bui, Economist AMP

Later this week
Thursday
22:30 USA Final GDP March (-0.2% p.a. forecast vs +2.4% p.a. in December)
22:30 USA Core Durable Goods Orders May (+0.1% m/m forecast vs +0.2% m/m in April)
Friday
22:30 USA Core Personal Consumption Expenditures (PCE) May
Price Index: +0.1% m/m forecast vs +0.1% m/m in April
Personal Income: +0.2% m/m forecast vs +0.8% m/m in April
Personal Spending: +0.2% m/m forecast vs +0.2% m/m in April
Latest News
Interesting Movers
Trading higher
+19.9% Droneshield (DRO) – June 2025 Investor Presentation and $61.6m European military contract, rise is consistent with prevailing short and long term uptrends, a regular in ChartWatch ASX Scans Uptrends list 🔎📈
+11.5% Humm Group (HUM) – The Abercrombie Group's NBIO to acquire hummgroup.
+11.0% Tasmea (TEA) – FY26 Earnings Guidance, rise is consistent with prevailing short and long term uptrends, a regular in ChartWatch ASX Scans Uptrends list 🔎📈
+10.5% Light & Wonder (LNW) – No news, tracked a similar rise in Nasdaq listing overnight / stronger US stocks. I did also find a news report of it signing a deal with a US casino yesterday..
+10.3% Elsight (ELS) – No news, rise is consistent with prevailing short and long term uptrends, a regular in ChartWatch ASX Scans Uptrends list 🔎📈
+9.1% GQG Partners (GQG) – No news, rising global stocks usually a tailwind for asset managers.
+8.2% Collins Foods (CKF) – Continued positive response to 24-Jun FY25 Results, also several positive broker notes today including "Upgraded to buy from hold at Canaccord Genuity and price target increased to $9.65 from $8.00" (see Broker Moves section below for full details).
+8.0% The Star Entertainment Group (SGR) – 2025 General Meeting Chairman's Address.
+7.9% Adairs (ADH) – No news, bounced in the wake of the recent sharp selloff.
+7.6% SRG Global (SRG) – $850m of Contracts Secured in Diverse Sectors, rise is consistent with prevailing short and long term uptrends, a regular in ChartWatch ASX Scans Uptrends list 🔎📈
+7.4% Electro Optic Systems (EOS) – Response to ASX Appendix 3Y Query, rise is consistent with prevailing short and long term uptrends, a regular in ChartWatch ASX Scans Uptrends list 🔎📈
Trading lower
-13.9% Andean Silver (ASL) – Gold Coast Investment Showcase Presentation, general weakness across the broader Precious Metals sector today.
-10.6% Emerald Resources (EMR) – Continued negative response to 24-Jun June 2025 Quarterly Production, general weakness across the broader Precious Metals sector today.
-7.7% Coronado Global Resources (CRN) – No news, general weakness across the broader Energy sector today, fall is consistent with prevailing short and long term downtrends, one of the most Featured (highest conviction) stocks in ChartWatch ASX Scans Downtrends list 🔎📉
-6.0% Mineral Resources (MIN) – No news, general weakness across the broader Resources sector today, fall is consistent with prevailing short and long term downtrends, a regular in ChartWatch ASX Scans Downtrends list 🔎📉
-5.7% Astral Resources (AAR) – Mandilla Project Pre-Feasibility Study - Maiden Ore Reserve, general weakness across the broader Precious Metals sector today.
-5.7% Antipa Minerals (AZY) – No news, general weakness across the broader Precious Metals sector today.
-5.2% Develop Global (DVP) – Growth Raise - Announcement and Growth Raise - Presentation, general weakness across the broader Resources sector today.
-4.7% Capricorn Metals (CMM) – No news, general weakness across the broader Precious Metals sector today.
-4.7% Stanmore Resources (SMR) – No news, general weakness across the broader Energy sector today, fall is consistent with prevailing short and long term downtrends, a regular in ChartWatch ASX Scans Downtrends list 🔎📉
-4.6% Ora Banda Mining (OBM) – No news, general weakness across the broader Precious Metals sector today.
-4.3% Perenti (PRN) – No news, general weakness across the broader Resources sector today.
-4.2% Pantoro (PNR) – Change in substantial holding (Regal Funds Management 13.4% to 12.3%), general weakness across the broader Precious Metals sector today.
-4.0% Genesis Minerals (GMD) – No news, general weakness across the broader Precious Metals sector today.
-3.7% Pinnacle Investment Management Group (PNI) – Ian Macoun Pinnacle shareholding and sale.
-3.4% Perseus Mining (PRU) – No news, general weakness across the broader Precious Metals sector today.
-3.3% Botanix Pharmaceuticals (BOT) – No news, fall is consistent with prevailing short and long term downtrends, a regular in ChartWatch ASX Scans Downtrends list 🔎📉
-3.3% Fletcher Building (FBU) – Continued negative response to 24-Jun Fletcher Building Investor Day, fall is consistent with prevailing short and long term downtrends 🔎📉
-3.1% Pilbara Minerals (PLS) – Corporate Presentation - Fastmarkets Conference 2025, general weakness across the broader Resources sector today (no follow through in lithium carbonate futures after yesterday's strong gain!).
Broker Moves
Adairs (ADH)
Downgraded to hold from buy at Bell Potter; Price Target: $2.10 from $2.65
Aristocrat Leisure (ALL)
Retained at buy at Bell Potter; Price Target: $79.00
Austal (ASB)
Retained at neutral at Citi; Price Target: $6.10 from $4.09
ASX (ASX)
Retained at neutral at Macquarie; Price Target: $66.00
Adveritas (AV1)
Upgraded to buy from speculative buy at Bell Potter; Price Target: $0.180 from $0.150
Boss Energy (BOE)
Downgraded to sell from hold at UBS; Price Target: $3.50 from $3.30
Collins Foods (CKF)
Upgraded to buy from hold at Canaccord Genuity; Price Target: $9.65 from $8.00
Retained at buy at Citi; Price Target: $10.13 from $9.60
Retained at outperform at CLSA; Price Target: $11.10 from $10.10
Retained at buy at Goldman Sachs; Price Target: $10.40 from $10.00
Retained at neutral at Macquarie; Price Target: $8.40 from $8.20
Retained at buy at Morgans; Price Target: $10.10 from $10.50
Retained at accumulate at Ord Minnett; Price Target: $9.50
Emerald Resources (EMR)
Retained at buy at Canaccord Genuity; Price Target: $5.10 from $5.95
Fletcher Building (FBU)
Retained at neutral at E&P; Price Target: $2.87 from $2.83
Greatland Gold (GGP)
Initiated at outperform at Macquarie; Price Target: $7.80
Insurance Australia Group (IAG)
Retained at equal-weight at Morgan Stanley; Price Target: $8.40 from $7.95
Imdex (IMD)
Retained at neutral at Citi; Price Target: $2.80 from $2.90
LGI (LGI)
Retained at buy at Bell Potter; Price Target: $3.65 from $3.50
Light & Wonder (LNW)
Retained at buy at Bell Potter; Price Target: $194.00
Lynas Rare Earths (LYC)
Retained at overweight at Morgan Stanley; Price Target: $10.50 from $10.00
Predictive Discovery (PDI)
Retained at speculative buy at Canaccord Genuity; Price Target: $0.560
Paladin Energy (PDN)
Retained at buy at Canaccord Genuity; Price Target: $12.80
Retained at buy at UBS; Price Target: $9.40 from $9.10
Reece (REH)
Upgraded to accumulate from hold at Ord Minnett; Price Target: $20.40
Suncorp Group (SUN)
Retained at overweight at Morgan Stanley; Price Target: $25.20 from $25.00
Treasury Wine Estates (TWE)
Retained at neutral at Citi; Price Target: $8.50 from $8.68
Retained at buy at Jefferies; Price Target: $11.50 from $12.00
Retained at neutral at Macquarie; Price Target: $8.50 from $8.90
Retained at overweight at Morgan Stanley; Price Target: $10.75 from $12.00
Retained at hold at Ord Minnett; Price Target: $9.50
Retained at outperform at RBC Capital Markets; Price Target: $10.70 from $10.80
Retained at buy at UBS; Price Target: $10.00 from $12.00
Xero (XRO)
Retained at neutral at E&P; Price Target: $186.00
Retained at outperform at RBC Capital Markets; Price Target: $210.00
Scans
Top Gainers
Code | Company | Last | % Chg |
|---|---|---|---|
| ATR | Astron Corporation Ltd | $0.64 | +47.13% |
| OLY | Olympio Metals Ltd | $0.11 | +37.50% |
| TGH | Terragen Holdings Ltd | $0.022 | +29.41% |
| NHE | Noble Helium Ltd | $0.031 | +29.17% |
| IFG | Infocus Group Holdings Ltd | $0.014 | +27.27% |
Top Fallers
Code | Company | Last | % Chg |
|---|---|---|---|
| PFM | Platformo Ltd | $0.047 | -47.78% |
| X2M | X2M Connect Ltd | $0.018 | -30.77% |
| PV1 | Provaris Energy Ltd | $0.012 | -29.41% |
| BVR | Bellavista Resources Ltd | $0.255 | -23.88% |
| MIO | Macarthur Minerals Ltd | $0.015 | -21.05% |
52 Week Highs
Code | Company | Last | % Chg |
|---|---|---|---|
| OLY | Olympio Metals Ltd | $0.11 | +37.50% |
| CDE | Codeifai Ltd | $0.057 | +18.75% |
| CHW | Chilwa Minerals Ltd | $1.20 | +13.74% |
| YOJ | Yojee Ltd | $0.36 | +12.50% |
| A1G | African Gold Ltd | $0.185 | +12.12% |
52 Week Lows
Code | Company | Last | % Chg |
|---|---|---|---|
| PFM | Platformo Ltd | $0.047 | -47.78% |
| IRD | Iron Road Ltd | $0.027 | -15.63% |
| IME | Imexhs Ltd | $0.26 | -13.33% |
| CAE | Cannindah Resources Ltd | $0.022 | -12.00% |
| 1MC | Morella Corporation Ltd | $0.015 | -11.77% |
Near Highs
Code | Company | Last | % Chg |
|---|---|---|---|
| SMLL | Betashares Australian Small Companies Select ETF | $3.72 | -0.80% |
| OZBD | Betashares Australian Composite Bond ETF | $45.53 | +0.26% |
| PCI | Perpetual Credit Income Trust | $1.18 | +1.29% |
| WVOL | Ishares MSCI World Ex Aust Minimum Volatility ETF | $44.21 | -0.02% |
| MTS | Metcash Ltd | $3.97 | +1.28% |
Relative Strength Index (RSI) Oversold
Code | Company | Last | % Chg |
|---|---|---|---|
| DGL | DGL Group Ltd | $0.36 | 0.00% |
| AX1 | Accent Group Ltd | $1.36 | +1.87% |
| AVH | Avita Medical Inc | $1.54 | -1.60% |
| SNL | Supply Network Ltd | $36.34 | -0.41% |
| DMP | Domino's PIZZA Enterprises Ltd | $19.62 | +0.05% |
