

The ASX 200 fell from near-record levels as Westpac's third-quarter update confirmed what the market had feared — mortgage applications are down as rate hikes and budget tax changes are biting. But, good news, capital that left the banks didn't leave the market — it went straight into gold, healthcare, communication services, and consumer staples.
Be sure to click/scroll through for the usual reporting of the major sector and stock-specific moves, the broker responses to them, as well as all the key economic data in tonight's Evening Wrap. Also, I have detailed technical analysis on the Nasdaq Composite and the S&P/ASX 200 in today's ChartWatch.
Let’s dive in!
Today in Review
Name | Value | % Chg |
|---|---|---|
Major Indices | ||
| ASX 200 | 9,232.6 | -0.34% |
| All Ords | 9,424.0 | -0.22% |
| Small Ords | 3,549.5 | +0.62% |
| All Tech | 3,192.3 | +1.40% |
| Emerging Companies | 3,042.6 | +1.85% |
Currency | ||
| AUD/USD | 0.7067 | -0.01% |
US Futures | ||
| S&P 500 | 7,779.75 | +0.58% |
| Dow Jones | 54,152.0 | +0.26% |
| Nasdaq | 29,834.75 | +1.18% |
Name | Value | % Chg |
|---|---|---|
Sector | ||
| Communication Services | 1,689.7 | +1.70% |
| Health Care | 28,380.9 | +1.45% |
| Materials | 25,242.1 | +1.22% |
| Information Technology | 1,930.0 | +0.57% |
| Consumer Staples | 13,577.3 | +0.36% |
| Industrials | 8,580.3 | +0.05% |
| Energy | 10,441.1 | +0.05% |
| Utilities | 9,488.7 | -0.23% |
| Real Estate | 3,673.8 | -0.26% |
| Consumer Discretionary | 4,081.4 | -0.45% |
| Financials | 9,803.1 | -2.27% |
ASX 200 Intraday Chart
%20intraday%20chart_10%20Aug.png)
Markets
The S&P/ASX 200 (XJO) finished 31.0 points lower at 9,232.6, roughly mid-range — 0.31% from its session high and 0.38% from its low. Despite the dip at benchmark level, in the broader-based S&P/ASX 300 (XKO) advancers still managed to beat decliners by a modest 159 to 116.
Financials (XFJ) (-2.3%) was the session's clear casualty. Westpac (WBC) (-5.9%) led the damage after its third-quarter update confirmed a 20% drop in mortgage applications as the combined weight of three RBA rate rises and the federal budget's negative gearing changes took hold. National Australia Bank (NAB) (-2.4%), Commonwealth Bank (CBA) (-2.1%), and ANZ (ANZ) (-1.7%) all followed Westpac lower as the market braced for CBA's results on Wednesday.
%20intraday%20chart_10%20Aug.png)
ASX 200 Financial (XFJ) intraday chart
Consumer Discretionary (XDJ) (-0.5%) followed the banks' logic: if mortgage applications are down 20% and households are under strain from three rate rises and budget changes, discretionary spending will slow. Temple & Webster (TPW) (-2.4%), Domino's Pizza Enterprises (DMP) (-1.9%), and Wesfarmers (WES) (-1.0%) all fell. Tabcorp (TAH) (+2.8%) was a notable exception after announcing it would acquire wagering software provider BetMakers (BET) (+33.3%) for $267 million.
The Gold Sub-Index (XGD) (+2.6%) extended a run that has now made the sector the clear outperformer of August to date. COMEX gold futures gained 0.4% to US$4,417/oz after rising 2.3% on Friday, while COMEX silver futures added 1.5% to US$64.44/oz. Genesis Minerals (GMD) (+6.1%), Capricorn Metals (CMM) (+5.8%), St Barbara (SBM) (+5.4%), Predictive Discovery (PDI) (+4.8%), Newmont (NEM) (+4.4%), and Northern Star Resources (NST) (+1.4%) all advanced.
Health Care (XHJ) (+1.4%) was an obvious destination for capital rotating out of the major banks — defensive earnings, non-cyclical revenue streams, and a sector that has spent much of the year rebuilding from deeply oversold territory. Telix Pharmaceuticals (TLX) (+7.6%) and Neuren Pharmaceuticals (NEU) (+5.4%) led the advance, with Ramsay Health Care (RHC) (+1.3%) also firmer.
%20intraday%20chart_10%20Aug.png)
ASX 200 Healthcare (XHJ) intraday chart
Materials (XMJ) (+1.2%) caught the same defensive-rotation flows as gold and healthcare, with COMEX copper futures gaining 0.6% to US$6.64/lb after rising 1.7% on Friday. BHP (BHP) (+0.9%) and Rio Tinto (RIO) (+0.8%) both advanced. Aurelia Metals (AMI) (+7.0%), South32 (S32) (+2.5%), Sandfire Resources (SFR) (+1.2%), and James Hardie Industries (JHX) (+5.8%) were also very solid.
In other commodities moves, GFEX lithium carbonate futures in China surged 4.5% to CNY 146,260/t — their best single-session gain in weeks — and lithium stocks picked up their recovery with conviction. Liontown Resources (LTR) (+9.3%), Elevra Lithium (ELV) (+6.6%), Pilbara Minerals (PLS) (+6.5%), Core Lithium (CXO) (+5.6%), and Vulcan Energy Resources (VUL) (+4.4%) all surged.
Rare earths stocks also advanced despite NdPr in China falling 1.3% to CNY 726,500/t — a divergence that suggests the buying is strategically motivated by supply chain concerns rather than commodity prices. Iluka Resources (ILU) (+4.4%), Lynas Rare Earths (LYC) (+3.5%), and Arafura Rare Earths (ARU) (+2.6%) were all firmer.
%20intraday%20chart_10%20Aug.png)
ASX 200 Materials (XMJ) intraday chart
Consumer Staples (XSJ) (+0.4%) was the final defensive beneficiary of the capital leaving banks — Endeavour Group (EDV) (+3.4%) was the standout alongside Treasury Wine Estates (TWE) (+4.2%), which rose despite announcing a further $558 million in writedowns mostly related to its US business. Metcash (MTS) (+1.0%) also advanced.
%20intraday%20chart_10%20Aug.png)
ASX 200 Consumer Staples (XSJ) intraday chart
Communication Services (XTJ) (+1.7%) was the session's best sector, but its driver was specific rather than thematic. CAR Group (CAR) (+9.9%) delivered a 14% jump in net profit for FY26 and the market rewarded it emphatically, with the share price surging to $29.70.
Information Technology (XIJ) (+0.6%) tracked a strong lead from the Nasdaq on Friday, with local tech stocks extending their recent recovery. WiseTech Global (WTC) (+4.3%), Catapult Sports (CAT) (+2.5%), and Xero (XRO) (+1.5%) were all solid.
Today's best ASX Top 300 gainers
Company | Last Price | Change $ | Change % | 1mo % | 1yr % |
|---|---|---|---|---|---|
| Lindian Resources (LIN) | $0.825 | +$0.128 | +18.3% | -2.4% | +560.0% |
| Sunrise Energy Metals (SRL) | $18.49 | +$2.56 | +16.1% | +15.2% | +1440.8% |
| CAR Group (CAR) | $29.70 | +$2.68 | +9.9% | +13.5% | -19.7% |
| Arafura Rare Earths (ARU) | $0.21 | +$0.015 | +7.7% | -10.6% | +7.7% |
| Minerals 260 (MI6) | $0.815 | +$0.055 | +7.2% | +35.8% | +552.0% |
| Core Lithium (CXO) | $0.305 | +$0.02 | +7.0% | +19.6% | +205.0% |
| Southern Cross Gold Consolidated (SX2) | $11.98 | +$0.78 | +7.0% | +34.5% | +119.0% |
| SEEK (SEK) | $16.48 | +$1.06 | +6.9% | +23.4% | -33.0% |
| Resolute Mining (RSG) | $1.125 | +$0.065 | +6.1% | +25.0% | +66.7% |
| Echo IQ (EIQ) | $1.56 | +$0.09 | +6.1% | -2.5% | +661.0% |
| Mesoblast (MSB) | $2.36 | +$0.13 | +5.8% | +12.4% | +2.2% |
| Clarity Pharmaceuticals (CU6) | $2.84 | +$0.15 | +5.6% | +19.8% | -25.3% |
| DPM Metals Inc. (DPM) | $61.85 | +$3.08 | +5.2% | +30.9% | +95.1% |
| Greatland Resources (GGP) | $12.42 | +$0.56 | +4.7% | +14.2% | +141.2% |
| Alcoa Corporation (AAI) | $71.53 | +$3.19 | +4.7% | +2.9% | +53.1% |
| IperionX (IPX) | $3.60 | +$0.16 | +4.7% | +4.7% | -36.7% |
| BCI Minerals (BCI) | $0.46 | +$0.02 | +4.5% | +9.5% | +33.3% |
| Kingsgate Consolidated (KCN) | $4.68 | +$0.20 | +4.5% | -2.1% | +70.2% |
| Newmont Corporation (NEM) | $159.48 | +$6.66 | +4.4% | +19.2% | +49.5% |
| Silex Systems (SLX) | $5.07 | +$0.21 | +4.3% | -2.7% | +28.4% |
Today's worst ASX Top 300 losers
Company | Last Price | Change $ | Change % | 1mo % | 1yr % |
|---|---|---|---|---|---|
| Arena REIT (ARF) | $2.56 | -$0.72 | -22.0% | -20.7% | -32.5% |
| Westpac Banking Corporation (WBC) | $35.70 | -$2.23 | -5.9% | -1.4% | +6.1% |
| Codan (CDA) | $39.12 | -$1.94 | -4.7% | -12.1% | +65.6% |
| Beach Energy (BPT) | $0.825 | -$0.04 | -4.6% | -5.2% | -34.8% |
| Southern Cross Electrical Engineering (SXE) | $4.32 | -$0.17 | -3.8% | -1.4% | +129.8% |
| Charter Hall Social Infrastructure REIT (CQE) | $2.64 | -$0.10 | -3.6% | +0.8% | -14.3% |
| News Corporation (NWS) | $46.11 | -$1.74 | -3.6% | +5.0% | -10.4% |
| WAM Leaders (WLE) | $1.345 | -$0.05 | -3.6% | -2.9% | +2.3% |
| Judo Capital Holdings (JDO) | $0.985 | -$0.035 | -3.4% | +9.4% | -39.6% |
| GR Engineering Services (GNG) | $5.84 | -$0.20 | -3.3% | +21.4% | +42.8% |
| Insurance Australia Group (IAG) | $8.35 | -$0.28 | -3.2% | +1.7% | -2.2% |
| L1 Long Short Fund (LSF) | $4.54 | -$0.15 | -3.2% | -0.7% | +47.4% |
| Dalrymple Bay Infrastructure (DBI) | $5.38 | -$0.17 | -3.1% | -4.6% | +12.1% |
| Heartland Group Holdings (HGH) | $0.975 | -$0.03 | -3.0% | -1.5% | +32.7% |
| Electro Optic Systems Holdings (EOS) | $7.51 | -$0.23 | -3.0% | -16.3% | +52.6% |
| Suncorp Group (SUN) | $18.78 | -$0.56 | -2.9% | -0.6% | -7.6% |
| AMP (AMP) | $2.35 | -$0.07 | -2.9% | +41.6% | +25.3% |
| Lovisa Holdings (LOV) | $26.37 | -$0.73 | -2.7% | +13.7% | -24.8% |
| Develop Global (DVP) | $5.10 | -$0.14 | -2.7% | -11.5% | +19.4% |
| Brazilian Rare Earths (BRE) | $4.24 | -$0.11 | -2.5% | +9.8% | +87.6% |
Chartwatch
Nasdaq Composite Index
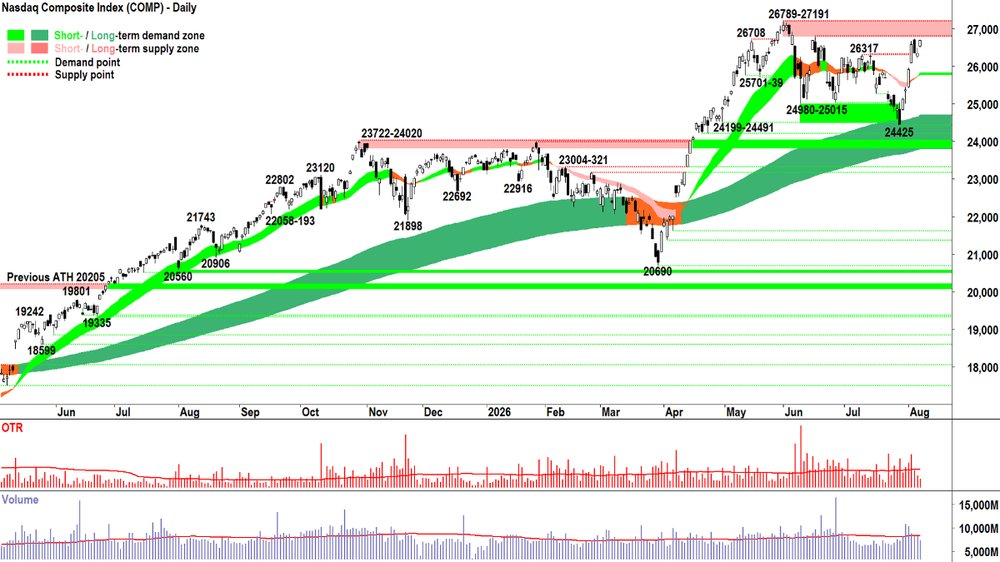
Nasdaq Composite Index chart
Analysis
What did I say on Friday? 🤔
It’s a very good thing when the market “pretty much does exactly what you expect”, i.e., when the price action is “consistent with the control” shown in the trends, price action, candles and volume.
If you had to guess a next candle for the Comp after Thursday’s close, it probably would have been Friday’s strong demand side showing. Gap up / displacement from close-to-open, then despite the pop: a vacuum of motivated supply looking to cash in — and in their place, a steady wall of excess demand.
Marry those words to the candle (white body, miniscule downward pointing shadow, close at the session high) and you’re starting to read candles. A Price action. How demand and supply are manifesting themselves via price.
It’s a valuable skill to have.
As good as Friday’s candle is, and it’s pretty darn solid, it really doesn’t change anything.
Not in terms of our Analysis = Trends, price action, candles and volume point to strong demand side control.
Or our Accept = Strong demand side control = P ⬆️ MOTN.
Or our Act = 2/3 RP
On our Act, that one could really be FRP. But, I think we both feel it’s best to see a little more evidence that 26789-27191 isn’t going to be a major problem.
We could get that signal tonight ( = strong demand side candle / long white body and or downward pointing shadow with close near session high within / above 26789-27191)
Or we could get a warning that the supply side still has plenty of ammo, they’ve just been saving it for a better price to let go… 💣💥 ( = strong supply side candle / long black body and or upward pointing shadow with close near session low within / below 26789-27191)
View
I am 2/3RP on US stocks. (RP = Risk Position — it reflects my personal allowable capital allocation limit for my investments in US stocks. So 1/2RP is 50%, 2/3RP is 67% and FRP is 100%).
Key Levels
26789-27191 is the key zone of supply vs the short term trend ribbon (presently 225778-25814) is the key zone of demand.
S&P/ASX 200 (XJO)
%20chart_10%20Aug.png)
S&P/ASX 200 (XJO) chart
Analysis
Far from a total write-off. But not ideal, either!
Hey, we’d love long white candles that close on the high every day, but that’s about as likely as a permanent peace in the Middle East — sadly to say, on both counts.
There are two main reasons today shouldn’t be considered a write-off:
1. The banks got belted 2.2% and the index was only down %. This means that fund managers are still wanting to be involved in Aussie shares / their cash levels are so high — that they have no choice but to keep buying Aussie shares… The cash coming out of the banks was mostly simply redirected elsewhere to maintain exposure.
2. Candle is small relative to last week's strong demand side showings (i.e., lack of supply size motivation), volume was well-below average (i.e., supply side lacked engagement), and there was a modest downward pointing shadow (i.e., BTD activity = Critical in a strong demand side market).
Given these two points, I’m going with: Glass = Half full today ✅
View
I am FRP on Aussie stocks. (My personal allowable capital allocation limit for my investments in ASX stocks is now 100%).
Key Levels
There is no key point of supply to contend with, while demand is at 8940 and then at the short term uptrend ribbon (presently 8904-8962).
(Glossary of acronyms! Old Tin Pot (OTP): S&P/ASX 200 | MOTN: More Often Than Not | FOMO: Fear Of Missing Out | HOFU: Holding On For Upside | BTD: Buy The Dip | NUTE: No Urgency To Enter | FOHO: Fear Of Holding On | STR: Sell The Rally | RP: Risk Position | FFS: Fund Flow Shenanigans!)
***CHARTWATCH LIVE WEBINARS 📺🍿***
ASX 200 blasts to record, can it keep rising? Plus: Genius! How the best traders think 🧠
ChartWatch LIVE Webinar
ChartWatch LIVE Webinars – WEEKLY Wednesday's @ 12pm AEDT
Learn more about technical analysis and trend following through real case studies on ASX stocks. Australia's premier technical analyst, Carl Capolingua, shares his unique insights on stocks as requested by viewers. Ask about a company in your portfolio or anything related to trading and investing and get Carl's expert opinion.
Places are limited so >REGISTER NOW!<
Economy
TODAY
CHN July Consumer Price Index (CPI) & Producer Price Index (PPI)
CPI: +0.5% p.a. vs +0.8% p.a. forecast and +1.0% p.a. in June
PPI: +3.5% p.a. vs +3.9% p.a. forecast and +4.1% p.a. in June
Reader: Chinese wholesale inflation tends to be exported to the rest of the world, so 3.5% p.a. is a large increase compared to the long term average, however, July's annual reading was well down from June's, and is also better than expected.
LATER THIS WEEK
Tuesday
11:30 AUS July NAB Business Confidence
14:30 AUS Reserve Bank of Australia (RBA) Official Cash Rate & Statement of Monetary Policy (no change +4.35% p.a. forecast)
15:30 AUS RBA Governor Michelle Bullock press conference
Wednesday
22:00 USA July CPI
Headline: +0.1% m/m and +3.4% p.a. forecast vs -0.4% m/m and +3.5% p.a. previous
Core: +0.2% m/m and +2.5% p.a. forecast vs +0.0% m/m and +2.6% p.a. previous
Thursday
TBC CHN July M2 Money Supply & New Loans
22:00 USA July Core PPI (+0.3% m/m forecast vs +0.2% m/m previous)
Friday
09:30 AUS RBA Governor Michelle Bullock speaks
12:30 AUS July CB Leading Index
22:00 USA July Core Retail Sales (+0.2% m/m forecast vs -0.2% m/m previous)
Saturday
00:00 USA Preliminary July University of Michigan Consumer Sentiment (54.4 forecast vs 55.2 previous)
00:00 USA Preliminary July University of Michigan Inflation Expectations
Interesting Movers
Trading higher
- Betmakers Technology Group (BET) $0.22+33.3%
Tabcorp (TAH) will acquire 100% of the issued shares in BetMakers by way of a scheme of arrangement: $0.24 cash for each BetMakers Share OR BetMakers Shareholders may elect to receive 25%, 50%, 75% or 100% of their Scheme Consideration in new Tabcorp shares.
- AVITA Medical, Inc. (AVH) $2.03+31.8%
Announced that it will be participating at the Canaccord Genuity 46th Annual Growth Conference in Boston, taking place August 11–13, 2026.
- Lindian Resources (LIN) $0.83+18.3%
Released a statement responding to what it called "recent inaccurate and misleading media articles" in relation to the company's Kangankunde Rare Earths Project. Management assured shareholders that its mining licence remains valid and that the mine is "operating well within statutory thresholds".
- American Tungsten and Antimony (AT4) $0.07+17.7%
No news, performance reflected general strength in the broader critical minerals sector.
- Sunrise Energy Metals (SRL) $18.49+16.1%
No news, performance reflected general strength in the broader critical minerals sector.
- FleetPartners Group (FPR) $3.89+12.1%
Released a statement: "Following careful consideration and consultation with its professional advisers, the FleetPartners
Board has unanimously determined to reject the SG Fleet Proposal, on the basis that it undervalues the Company and is not in the best interests of FleetPartners shareholders." SG Fleet current bid is $3.60 per share. - CAR Group (CAR) $29.70+9.9%
Reported FY 26 results today. Adjusted NPAT $407.2 million vs StreetAccount consensus forecast of $405.5 million.
- Arafura Rare Earths (ARU) $0.21+7.7%
No news, performance reflected general strength in the broader critical minerals sector.
- Resolute Mining (RSG) $1.14+7.6%
No news, performance reflected general strength in the broader precious metals sector.
- PMET Resources Inc (PMT) $0.50+7.5%
No news, performance reflected general strength in the broader critical minerals sector. Benchmark lithium carbonate futures up 4.5% in China today.
- Core Lithium (CXO) $0.31+7.0%
No news, performance reflected general strength in the broader critical minerals sector. Benchmark lithium carbonate futures up 4.5% in China today.
- Southern Cross Gold Consolidated (SX2) $11.98+7.0%
No news, performance reflected general strength in the broader precious metals sector.
- SEEK (SEK) $16.43+6.6%
No news, has become a recent regular in the ChartWatch ASX Scans Uptrends List.
- Kingsgate Consolidated (KCN) $4.71+5.1%
No news, performance reflected general strength in the broader precious metals sector.
- Emerald Resources NL (EMR) $6.56+5.0%
No news, performance reflected general strength in the broader precious metals sector.
- VanEck Gold Miners ETF (GDX) $110.14+5.0%
No news, performance reflected general strength in the broader precious metals sector.
- Newmont Corporation (NEM) $160.07+4.7%
No news, performance reflected general strength in the broader precious metals sector.
- Treasury Wine Estates (TWE) $5.68+4.5%
Announced several initiatives to rebalance its US supply chain. Also, TWE has become a recent regular in the ChartWatch ASX Scans Uptrends List.
Trading Lower
- Arena REIT (ARF) $2.56-22.0%
Edge Early Learning trading update. Edge has requested a deferral or abatement of rent from Arena in late July 2026 as it pursues a corporate restructure of its business.
- Beach Energy (BPT) $0.83-4.6%
Continued negative response to last week's FY26 results. BPT is a regular in the ChartWatch ASX Scans Downtrends List.
- News Corporation (NWS) $46.11-3.6%
Reported Q4 and full year results for FY26.
Broker Moves
Company | Broker | Action | Rating | Price Target |
|---|---|---|---|---|
BETBetmakers Technology Group | Canaccord Genuity | Downgraded | Hold(from Buy) | $0.24(from $0.25) |
BPTBeach Energy | Morgans | Retained | Sell | $0.82(from $0.81) |
CARCAR Group | Citi | Retained | Buy | $30.60 |
| UBS | Retained | Buy | $32.80 | |
CCPCredit Corp Group | Macquarie | Retained | Outperform | $13.34 |
CHCCharter Hall Group | Citi | Retained | Buy | $26.50 |
COFCenturia Office REIT | Morgans | Retained | Trim | $0.88(from $0.80) |
CQRCharter Hall Retail REIT | Citi | Retained | Buy | $4.70(from $4.50) |
| Moelis Australia | Downgraded | Hold(from Buy) | $4.51(from $4.48) | |
| Ord Minnett | Downgraded | Hold(from Accumulate) | $4.15 | |
| UBS | Retained | Buy | $4.65(from $4.30) | |
GPTGPT Group | Citi | Retained | Buy | $6.00 |
IFTInfratil | Citi | Retained | Buy | $15.18 |
INAIngenia Communities Group | Citi | Retained | Buy | $5.42 |
JHXJames Hardie Industries Plc | Citi | Retained | Buy | $50.10(from $42.60) |
| Macquarie | Retained | Outperform | $47.10(from $41.20) | |
| Morgans | Retained | Hold | $45.00(from $40.00) | |
| UBS | Retained | Neutral | $45.00(from $40.00) | |
LGILGI | Bell Potter | Retained | Buy | $3.20(from $4.50) |
MADMader Group | Bell Potter | Retained | Buy | $9.70 |
MI6Minerals 260 | UBS | Retained | Buy | $0.90 |
MM1Midas Minerals | Canaccord Genuity | Retained | Speculative Buy | $1.50 |
MNDMonadelphous Group | Morgans | Upgraded | Buy(from Hold) | $35.80(from $33.85) |
NCKNick Scali | Citi | Retained | Neutral | $17.25 |
| CLSA | Retained | Outperform | $22.90(from $24.60) | |
| Jarden | Retained | Overweight | $17.30(from $16.60) | |
| Jefferies | Retained | Hold | $16.50(from $15.00) | |
| Macquarie | Retained | Outperform | $17.70(from $16.70) | |
| Morgans | Downgraded | Accumulate(from Buy) | $18.41(from $17.84) | |
| Ord Minnett | Retained | Lighten | $15.00(from $14.00) | |
NWSNews Corporation | Ord Minnett | Upgraded | Buy(from Accumulate) | $60.00 |
NXGNexGen Energy (Canada) | Morgans | Downgraded | Accumulate(from Buy) | $15.60(from $20.80) |
QANQantas Airways | Macquarie | Retained | Outperform | $10.80(from $11.00) |
REAREA Group | Morgan Stanley | Retained | Overweight | $225.00(from $220.00) |
RMDResMed Inc. | Citi | Retained | Neutral | $33.00 |
| Macquarie | Retained | Outperform | $46.80(from $46.60) | |
| Morgans | Retained | Buy | $39.50(from $40.97) | |
| Ord Minnett | Retained | Buy | $36.20 | |
RSGResolute Mining | Ord Minnett | Retained | Buy | $1.60(from $1.75) |
SCGScentre Group | Citi | Retained | Buy | $4.40 |
TAHTabcorp Holdings | Morgans | Retained | Buy | $1.02 |
TCGTuraco Gold | Canaccord Genuity | Retained | Speculative Buy | $1.35 |
TLCThe Lottery Corporation | Citi | Retained | Sell | $5.00 |
TWETreasury Wine Estates | Macquarie | Retained | Neutral | $4.90 |
WBCWestpac Banking Corporation | Citi | Retained | Neutral | $37.50 |
| UBS | Retained | Buy | $45.00 |
Scans
Top Gainers
Code | Company | Last | % Chg |
|---|---|---|---|
| BSN | Basin Energy Ltd | $0.033 | +50.00% |
| WOA | Wide Open Agriculture Ltd | $0.014 | +40.00% |
| RIM | Rimfire Pacific Mining Ltd | $0.015 | +36.36% |
| BET | Betmakers Technology Group Ltd | $0.22 | +33.33% |
| AVH | Avita Medical Inc | $2.03 | +31.82% |
Top Fallers
Code | Company | Last | % Chg |
|---|---|---|---|
| KNI | Kuniko Ltd | $0.02 | -25.93% |
| SNT | Syntara Ltd | $0.027 | -22.86% |
| ARF | Arena REIT | $2.56 | -21.95% |
| ITS | Infotrust Ltd | $0.21 | -20.76% |
| SLM | Solis Minerals Ltd | $0.068 | -20.00% |
52 Week Highs
Code | Company | Last | % Chg |
|---|---|---|---|
| AVH | Avita Medical Inc | $2.03 | +31.82% |
| SRL | Sunrise Energy Metals Ltd | $18.49 | +16.07% |
| CML | Connected Minerals Ltd | $0.42 | +13.51% |
| KRR | King River Resources Ltd | $0.068 | +13.33% |
| MYE | Mastermyne Group Ltd | $0.60 | +13.21% |
52 Week Lows
Code | Company | Last | % Chg |
|---|---|---|---|
| KNI | Kuniko Ltd | $0.02 | -25.93% |
| ARF | Arena REIT | $2.56 | -21.95% |
| ITS | Infotrust Ltd | $0.21 | -20.76% |
| HCT | Holista Colltech Ltd | $0.055 | -17.91% |
| ELK | ELK Range Mining Ltd | $0.18 | -10.00% |
Near Highs
Code | Company | Last | % Chg |
|---|---|---|---|
| GLPR | iShares Ftse GBL Property Ex Aus (Aud Hedged) ETF | $29.01 | +0.90% |
| RHC | Ramsay Health Care Ltd | $44.82 | -0.18% |
| AN3PI | Australia and New Zealand Banking Group Ltd | $102.80 | -0.05% |
| WVOL | iShares MSCI World Ex Aust Minimum Volatility ETF | $46.33 | +0.09% |
| PYC | PYC Therapeutics Ltd | $2.09 | +2.45% |
Relative Strength Index (RSI) Oversold
Code | Company | Last | % Chg |
|---|---|---|---|
| LOT | Lotus Resources Ltd | $0.23 | 0.00% |
| ARF | Arena REIT | $2.56 | -21.95% |
| AXQ | Aura Consolidated Group, Inc | $3.19 | -4.49% |
| LGI | LGI Ltd | $2.07 | -5.91% |
| MYR | Myer Holdings Ltd | $0.215 | -2.27% |
