

The ASX 200 rebounded as benchmark US bond yields eased slightly from three-session highs, providing enough relief for gold stocks, banks, and healthcare to recover. Uranium stocks were a bit of a mystery, however, as the sector surged despite a flat commodity price and few leads from listed overseas peers. Lithium stocks weren't so lucky — their driver clear — a sharp fall in the lithium price today in China.
Be sure to click/scroll through for the usual reporting of the major sector and stock-specific moves, the broker responses to them, as well as all the key economic data in tonight's Evening Wrap. Also, I have detailed technical analysis on the Nasdaq Composite and the S&P/ASX 200 in today's ChartWatch.
Let’s dive in!
Today in Review
Name | Value | % Chg |
|---|---|---|
Major Indices | ||
| ASX 200 | 9,020.1 | +0.46% |
| All Ords | 9,198.3 | +0.42% |
| Small Ords | 3,440.8 | +0.44% |
| All Tech | 2,942.6 | -0.45% |
| Emerging Companies | 3,070.6 | +0.28% |
Currency | ||
| AUD/USD | 0.7171 | +0.02% |
US Futures | ||
| S&P 500 | 7,669.25 | +0.35% |
| Dow Jones | 53,136.0 | +0.58% |
| Nasdaq | 29,141.0 | +0.05% |
Name | Value | % Chg |
|---|---|---|
Sector | ||
| Financials | 9,357.5 | +0.86% |
| Health Care | 31,977.9 | +0.80% |
| Real Estate | 3,362.4 | +0.76% |
| Industrials | 8,077.6 | +0.43% |
| Materials | 25,489.8 | +0.39% |
| Communication Services | 1,578.4 | +0.30% |
| Consumer Discretionary | 3,630.8 | +0.30% |
| Consumer Staples | 13,333.2 | +0.11% |
| Utilities | 10,248.3 | -0.17% |
| Information Technology | 1,790.6 | -0.78% |
| Energy | 11,009.8 | -1.24% |
ASX 200 Intraday Chart
%20intraday%20chart_3%20Sep.png)
Markets
The S&P/ASX 200 (XJO) finished 41.7 points higher at 9,020.1, 0.56% from its session low and just 0.1% from its high. In the broader-based S&P/ASX 300 (XKO) advancers beat decliners by a healthy 168 to 114.
The Gold Sub-Index (XGD) (+2.9%) delivered the session's sharpest recovery as the slight pullback in benchmark US bond yields provided enough relief to reverse a portion of the prior two sessions' damage. COMEX gold futures gained 1.2% to US$4,470/oz in Asian trade — the metal reclaiming the US$4,400 level it had convincingly held before Jackson Hole — and a modest easing in crude oil prices simultaneously reduced diesel cost pressures on mining operations. Kingsgate Consolidated (KCN) (+5.4%), Pantoro Gold (PNR) (+4.9%), Resolute Mining (RSG) (+4.3%), and Ramelius Resources (RMS) (+3.7%) all bounced sharply.
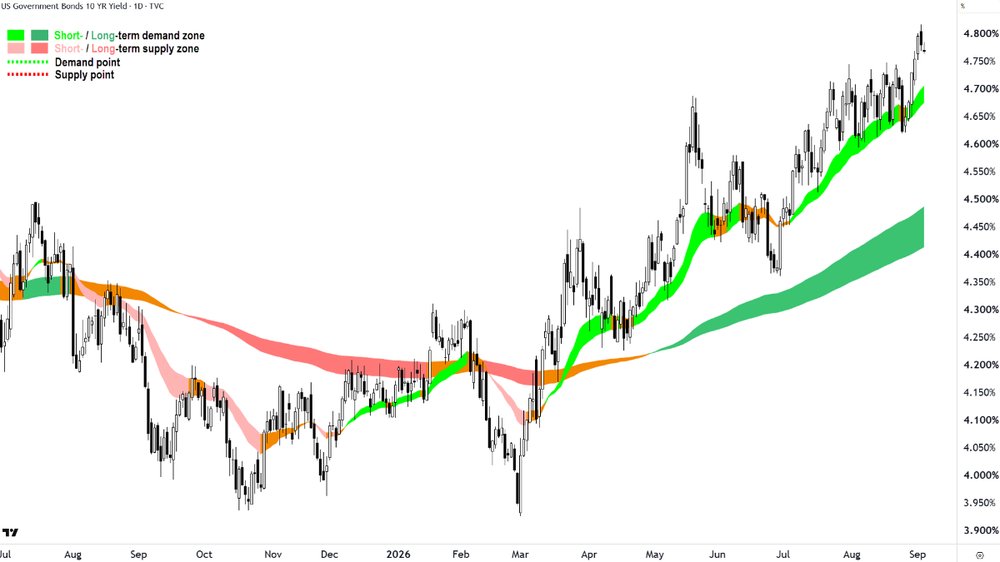
US 10-Year T-Bond Yield chart
%20COMEX%20chart_3%20Sep.png)
Gold Futures (Front month, back-adjusted) COMEX chart
Financials (XFJ) (+0.9%) carried the most index weight in today's recovery and did so with conviction — the major banks advancing in unison. There's safety in big, liquid, blue chip yield. So the Big 4 caught some flows today... National Australia Bank (NAB) (+1.8%), Westpac (WBC) (+1.5%), ANZ (ANZ) (+1.3%), and Commonwealth Bank (CBA) (+0.8%) all gained.
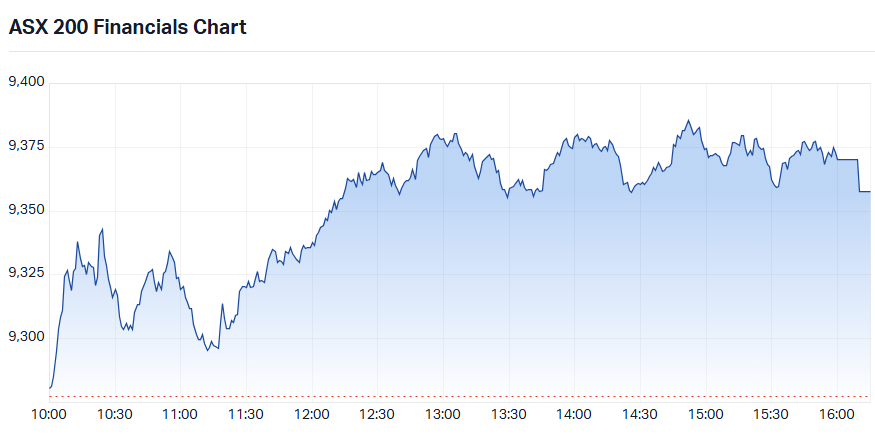
S&P-ASX 200 Financials Sector Index intraday chart
Health Care (XHJ) (+0.8%) benefited from the same blue chip dynamic. The big fund managers have now been adding healthcare exposure on every dip since the sector's historic rout earlier in the year. Telix Pharmaceuticals (TLX) (+3.6%), Cochlear (COH) (+3.3%), Sonic Healthcare (SHL) (+3.0%), Ansell (ANN) (+2.1%), and CSL (CSL) (+0.9%) all advanced.
Materials (XMJ) (+0.4%) was subdued at the sector level but split sharply along commodity lines. LME base metals prices fell broadly on Wednesday — a headwind that weighed on most base metals stocks — yet Sims (SGM) (+3.0%), South32 (S32) (+1.2%), and Nickel Industries (NIC) (+1.2%) all managed positive closes. Iron ore was the sector's bright spot: SGX iron ore futures surged 1.7% to US$99.55/t — their highest close since 15 July — driving Fortescue (FMG) (+2.0%), Mineral Resources (MIN) (+1.9%), Rio Tinto (RIO) (+1.3%), and Champion Iron (CIA) (+1.2%) all higher. BHP (-1.4%) dragged.
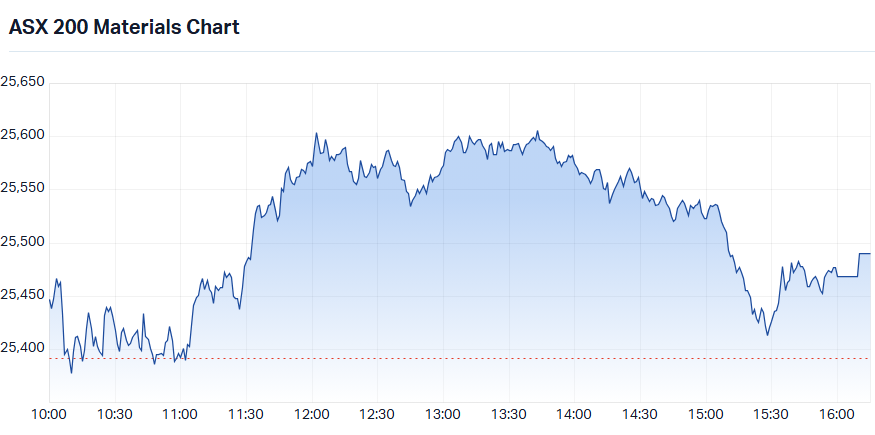
S&P-ASX 200 Materials Sector Index intraday chart
Energy (XEJ) (-1.2%) sagged as ICE Brent crude futures fell 1.2% to US$94.51/bbl following a reduction in tit-for-tat Middle East hostilities over the preceding 24 hours. SGX Australian Premium Coking Coal futures also eased 2.4% to US$272/t, weighing on coal stocks. Karoon Energy (KAR) (-3.1%), Beach Energy (BPT) (-2.8%), and Woodside Energy (WDS) (-2.6%) led the oil and gas declines, with Whitehaven Coal (WHC) (-0.9%) and Yancoal Australia (YAL) (-0.7%) softer within coal.
Information Technology (XIJ) (-0.8%) continued to slide despite the Nasdaq Composite rebounding overnight — a persistent disconnect probably explained by ongoing weakness in major constituent WiseTech Global (WTC) (-2.4%). Technology One (TNE) (-1.9%) and NextDC (NXT) (-1.4%) also lower, but Life360 (360) (+3.8%) bucked the trend (likely due to its Nasdaq exposure).
In other commodities moves, uranium stocks delivered their most perplexing session in weeks — surging strongly despite COMEX uranium futures falling 0.1% to US$89.45/lb and the Sprott Uranium Miners ETF (NYSE: URNM) barely moving overnight. No obvious company-specific or sector news explained the move. The buying appeared to be positioning-driven or speculative in nature rather than a response to any identifiable fundamental signal. Deep Yellow (DYL) (+8.4%), Bannerman Energy (BMN) (+7.8%), Boss Energy (BOE) (+5.1%), NexGen Energy (NXG) (+3.2%), and Paladin Energy (PDN) (+1.4%) all surged.
Lithium stocks moved in the opposite direction, but the reason for their demise was far clearer: GFEX lithium carbonate futures ended sharply lower by 3.2% to CNY 149,880/t — bringing three-day losses to 6.9% and erasing most of the recovery accumulated over the prior week. Core Lithium (CXO) (-9.2%), Pilbara Minerals (PLS) (-5.3%), Vulcan Energy Resources (VUL) (-5.1%), Liontown Resources (LTR) (-5.0%), Elevra Lithium (ELV) (-3.1%), and IGO (IGO) (-2.6%) were all sharply lower.
Today's best ASX Top 300 gainers
Company | Last Price | Change $ | Change % | 1mo % | 1yr % |
|---|---|---|---|---|---|
| Deep Yellow (DYL) | $1.67 | +$0.13 | +8.4% | +26.5% | -7.7% |
| Southern Cross Gold Consolidated (SX2) | $12.24 | +$0.92 | +8.1% | +26.8% | +77.4% |
| The Star Entertainment Group (SGR) | $0.135 | +$0.01 | +8.0% | -3.6% | +28.6% |
| Bannerman Energy (BMN) | $4.29 | +$0.31 | +7.8% | +38.8% | +37.5% |
| PYC Therapeutics (PYC) | $2.57 | +$0.14 | +5.8% | +51.2% | +110.5% |
| Kingsgate Consolidated (KCN) | $5.45 | +$0.28 | +5.4% | +34.9% | +74.1% |
| Pantoro Gold (PNR) | $2.80 | +$0.13 | +4.9% | +37.3% | -46.7% |
| Block, Inc. (XYZ) | $113.16 | +$4.86 | +4.5% | -3.8% | -1.7% |
| Resolute Mining (RSG) | $1.445 | +$0.06 | +4.3% | +55.4% | +106.4% |
| Nine Entertainment Co. Holdings (NEC) | $1.00 | +$0.04 | +4.2% | +4.2% | -40.7% |
| IperionX (IPX) | $3.01 | +$0.12 | +4.2% | -1.3% | -58.5% |
| Life360 Inc (360) | $19.93 | +$0.73 | +3.8% | -22.3% | -54.6% |
| Cobram Estate Olives (CBO) | $3.01 | +$0.11 | +3.8% | -7.1% | -5.9% |
| Bellevue Gold (BGL) | $1.645 | +$0.06 | +3.8% | +30.6% | +80.8% |
| Ramelius Resources (RMS) | $3.92 | +$0.14 | +3.7% | +28.5% | +15.0% |
| Greatland Resources (GGP) | $11.51 | +$0.41 | +3.7% | +15.7% | +85.9% |
| Telix Pharmaceuticals (TLX) | $16.26 | +$0.57 | +3.6% | +14.4% | +14.9% |
| Metals X (MLX) | $1.89 | +$0.065 | +3.6% | +20.0% | +202.4% |
| Catalyst Metals (CYL) | $6.89 | +$0.23 | +3.5% | +27.6% | -15.4% |
| Westgold Resources (WGX) | $6.31 | +$0.21 | +3.4% | +33.4% | +72.9% |
Today's worst ASX Top 300 losers
Company | Last Price | Change $ | Change % | 1mo % | 1yr % |
|---|---|---|---|---|---|
| Regis Healthcare (REG) | $4.30 | -$1.59 | -27.0% | -31.0% | -43.8% |
| Lindian Resources (LIN) | $0.635 | -$0.13 | -17.0% | -18.6% | +164.6% |
| Sunrise Energy Metals (SRL) | $14.23 | -$1.78 | -11.1% | -0.3% | +752.1% |
| EQ Resources (EQR) | $0.355 | -$0.03 | -7.8% | +39.2% | +914.3% |
| Elevra Lithium (ELV) | $7.88 | -$0.45 | -5.4% | +5.6% | +102.1% |
| Echo IQ (EIQ) | $1.225 | -$0.06 | -4.7% | -7.5% | +512.5% |
| MA Financial Group (MAF) | $5.13 | -$0.22 | -4.1% | -10.2% | -44.2% |
| Liontown (LTR) | $1.19 | -$0.05 | -4.0% | +23.3% | +35.2% |
| Lovisa Holdings (LOV) | $23.15 | -$0.88 | -3.7% | -3.0% | -43.3% |
| NIB Holdings (NHF) | $6.72 | -$0.25 | -3.6% | -10.4% | -9.9% |
| The a2 Milk Company (A2M) | $6.56 | -$0.23 | -3.4% | -4.8% | -28.6% |
| LendLease Group (LLC) | $2.87 | -$0.10 | -3.4% | -5.3% | -47.1% |
| Lycopodium (LYL) | $21.95 | -$0.71 | -3.1% | +23.3% | +79.8% |
| Air New Zealand (AIZ) | $0.31 | -$0.01 | -3.1% | -11.4% | -42.1% |
| Meridian Energy (MEZ) | $4.35 | -$0.14 | -3.1% | -5.2% | -17.9% |
| Karoon Energy (KAR) | $1.735 | -$0.055 | -3.1% | -0.3% | +4.2% |
| Metrics Master Income Trust (MXT) | $1.765 | -$0.055 | -3.0% | -8.5% | -13.5% |
| DroneShield (DRO) | $1.665 | -$0.05 | -2.9% | -1.8% | -46.5% |
| Aspen Group (APZ) | $4.75 | -$0.14 | -2.9% | -6.3% | +10.5% |
| Beach Energy (BPT) | $0.87 | -$0.025 | -2.8% | -4.4% | -27.2% |
Chartwatch
Nasdaq Composite Index
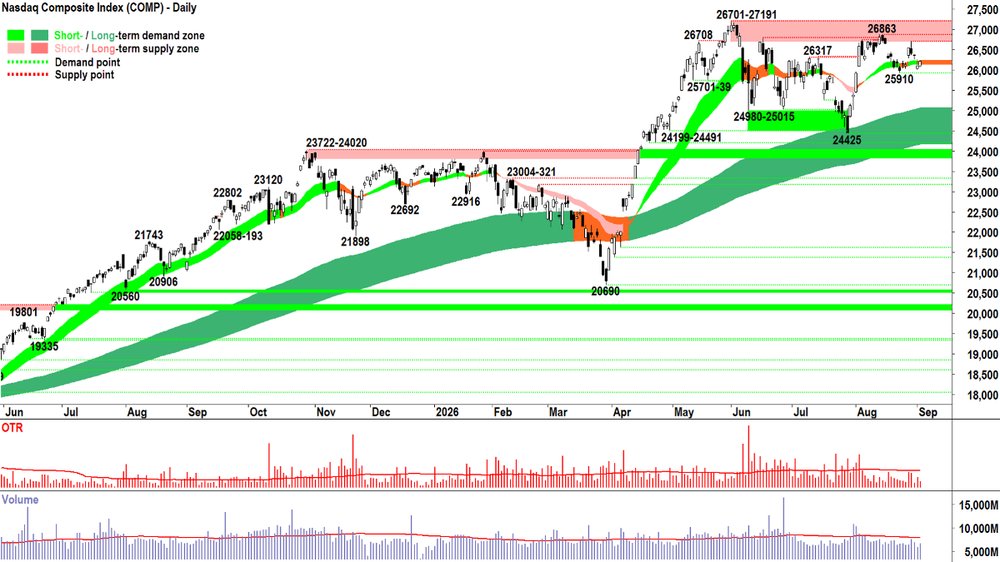
Nasdaq Composite Index chart
Analysis
Zooooommmm in and you’ll see a decent little demand side candle on Wednesday. 🔬
Volume up a little on Tuesday, a bit more demand side engagement and a little more clearing of latent supply.
Still, it’s tiny (see OTR), and it sits completely within Tuesday's candle = There really wasn’t a great deal of movement / motivation overall.
Hey – it’s not like last night saw a strong and confident retest of the 26701-27191 zone of supply!
Which is really what the Comp needs to break it out of the current funk.
I note, also, that the short term trend ribbon has flip-flopped back to amber / neutral, reinforcing my view that we remain in a short term equilibrium market.
This is balanced against the still-strong demand side market in the long term. Which gets us to the present portfolio risk position of 1/2RP.
View
1/2RP. (RP = Risk Position — it reflects my personal allowable capital allocation limit for my investments in US stocks. So 1/2RP is 50%, 2/3RP is 67% and FRP is 100%).
Key Levels
26863 is the key point of supply vs 25910 and then the long term trend ribbon (presently 24166-25058) is the key point / zone of demand.
S&P/ASX 200 (XJO)
%20chart_3%20Sep.png)
S&P/ASX 200 (XJO) chart
Analysis
Just as it’s customary for the ASX 200 to tank the day after I upgrade it from the Old Tin Pot to the Golden Le Creuset…
It’s also customary for it to go up the day after I cut my portfolio RP. 🤦
But as I said yesterday (rather prophetically, too, I might add): “Measured transition. No need to panic and to rush it...”
The problem with 1/2RP is you’re not really sure if you want the market to go up or down. It’s a very weird, and I find it, a very uncomfortable feeling!
You have to just keep calling a spade a spade. No bias. Only D vs S = P matters.
Today’s candle is decent. Market participation looked decent, in particular the banks’ contribution. They’re always a massive swing factor as far as the OTP is concerned.
But that doesn't mean we’ll get great setups for our risk (there aren't any in those banks!). It just means the big funds are juicing index points with a few, heavy-hitting stocks. 🧃
The bottom line: Even after today’s modest demand side showing, there remains more than enough evidence in the price action, short term trend ribbon, and recent candles to confirm that the supply side is in control of the OTP’s short term price.
Long term, we’re sticking with demand side control.
So, like the Comp, it puts my ST/LT assessments on the OTP at odds with each other… and therefore, our portfolio risk remains 1/2RP.
View
I am in the process of moving to 1/2RP on Australian shares (i.e., the goal target over the next few days = 50% of my capital allocated to ASX shares invested vs 50% cash).
Key Levels
9221-9297 is the key zone of supply to contend with, while 8940 is the next key point of demand.
(Glossary of acronyms! Old Tin Pot (OTP): S&P/ASX 200 | MOTN: More Often Than Not | FOMO: Fear Of Missing Out | HOFU: Holding On For Upside | BTD: Buy The Dip | NUTE: No Urgency To Enter | FOHO: Fear Of Holding On | STR: Sell The Rally | RP: Risk Position | FFS: Fund Flow Shenanigans!)
***CHARTWATCH LIVE WEBINARS — NEW VIDEO DROPPED!!! 📺🍿***
Is this the end for the stock market? This expert analyst is loading up on cash 💰
ChartWatch LIVE Webinars – WEEKLY Wednesday's @ 12pm AEDT
Learn more about technical analysis and trend following through real case studies on ASX stocks. Australia's premier technical analyst, Carl Capolingua, shares his unique insights on stocks as requested by viewers. Ask about a company in your portfolio or anything related to trading and investing and get Carl's expert opinion.
Places are limited so >REGISTER NOW!<
Economy
TODAY
No major economic data releases were scheduled for today...
LATER THIS WEEK
FRIDAY
00:00 USA August ISM Services PMI (54.1 forecast vs 54.1 in July)
22:30 USA August Non-Farm Payroll
Non-Farm Employment Change: +58,000 forecast vs -23,000 in July
Unemployment Rate: 4.1% forecast vs 4.1% in July
Average Hourly Earnings: +0.3% m/m forecast vs +0.1% m/m in July
Interesting Movers
Trading higher
- MaxiPARTS (MXI) $2.20+28.7%
Non-binding indicative offer received from Ares Management Asia to acquire 100% of MXI at $2.50 per share in cash.
- Deep Yellow (DYL) $1.67+8.4%
No news. Performance reflected general strength in the broader uranium sector. (A bit of a mystery, Sprott Uranium Miners ETF only marginally higher overnight, as was Cameco – and uranium futures flat. Has been a super volatile sector lately! 🎢).
- Southern Cross Gold Consolidated (SX2) $12.24+8.1%
No news. Performance reflected general strength in the broader gold sector. Benchmark gold futures have rallied ~2% in the last 24 hours as key US bond yields pulled back from early-week surge.
- PYC Therapeutics (PYC) $2.57+5.8%
Released a presentation today regarding its drug candidate PYC-001 that addresses the underlying cause of a blinding eye disease known as Autosomal Dominant Optic Atrophy.
- Gateway Mining (GML) $0.10+5.6%
Continued positive response to yesterday's news regarding its Cowza Prospect (Yandal Gold Project) in Western Australia. Performance also reflected general strength in the broader gold sector.
- Pantoro Gold (PNR) $2.80+4.9%
No news. Performance reflected general strength in the broader sector.
- Resolute Mining (RSG) $1.45+4.3%
No news. Performance reflected general strength in the broader sector.
- Ramelius Resources (RMS) $3.92+3.7%
No news. Performance reflected general strength in the broader sector.
- NexGen Energy (Canada) (NXG) $14.37+3.7%
No news. Performance reflected general strength in the broader uranium sector.
- Paladin Energy (PDN) $11.51+3.6%
No news. Performance reflected general strength in the broader uranium sector.
- PEXA Group (PXA) $7.34+2.8%
ASX filing today showed that director J. Hopkins purchased 4,000 shares in the company at $7.25 per share in an on market trade.
Trading Lower
- Regis Healthcare (REG) $4.30-27.0%
Fell in response to the Australian Government's annual pricing determination for the Australian National Aged Care Classification starting price (an increase of 2.55%) and hotelling supplement remaining unchanged. Basically, the funding increase to aged health providers like REG is lower than the company would prefer, as they put it: "the funding outcome does not reflect the underlying cost of care".
- Lindian Resources (LIN) $0.64-17.0%
Announce that it has executed a Technology and Engineering Services Agreement and a long-term binding Offtake Agreement, for the development of an Oxide Separation Facility with Carester SAS.
- Lovisa Holdings (LOV) $23.15-3.7%
No news. Continues to fade after initial FY26 results pop on 26-Aug. Mixed Consumer Discretionary sector today, but generally still reeling from ramped RBA rate hike expectations last week.
- Karoon Energy (KAR) $1.74-3.1%
No news. Performance reflected general weakness in the broader energy sector.
- DroneShield (DRO) $1.67-2.9%
No news. DRO is a regular in the ChartWatch ASX Scans Downtrends List.
- Beach Energy (BPT) $0.87-2.8%
No news. Performance reflected general weakness in the broader energy sector.
- Woodside Energy Group (WDS) $32.22-2.6%
No news. Performance reflected general weakness in the broader energy sector. Brent crude futures are trading 1.2% lower in Asian session...
Broker Moves
Company | Broker | Action | Rating | Price Target |
|---|---|---|---|---|
AOVAmotiv | Citi | Retained | Neutral | $7.06 |
AQZAlliance Aviation Services | Ord Minnett | Retained | Hold | $0.82(from $0.85) |
ARBARB Corporation | Citi | Retained | Neutral | $22.50 |
BRGBreville Group | Macquarie | Retained | Outperform | $37.10 |
CQRCharter Hall Retail REIT | UBS | Retained | Buy | $4.65 |
DEVDevEx Resources | Bell Potter | Retained | Speculative Buy | $0.41 |
EMREmerald Resources NL | Ord Minnett | Downgraded | Sell(from Lighten) | $5.40 |
GG8Gorilla Gold Mines | Canaccord Genuity | Retained | Speculative Buy | $1.00 |
IFNInfragreen Group | Morgans | Retained | Buy | $1.10(from $1.00) |
IGOIGO | Ord Minnett | Downgraded | Accumulate(from Buy) | $9.00 |
JHXJames Hardie Industries Plc | Morgan Stanley | Retained | Overweight | $48.00 |
LOTLotus Resources | Macquarie | Retained | Neutral | $0.25 |
MEIMeteoric Resources | Ord Minnett | Retained | Speculative Buy | $0.25 |
MGRMirvac Group | UBS | Retained | Neutral | $1.99 |
MPKMany Peaks Minerals | Canaccord Genuity | Retained | Speculative Buy | $1.90 |
NUFNufarm | Bell Potter | Retained | Buy | $3.75(from $3.60) |
PDNPaladin Energy | Canaccord Genuity | Retained | Buy | $15.80 |
| Macquarie | Upgraded | Outperform(from Neutral) | $13.85 | |
REGRegis Healthcare | Ord Minnett | Downgraded | Hold(from Buy) | $6.00(from $8.40) |
| UBS | Retained | Neutral | $5.95(from $6.75) | |
SGPStockland | UBS | Retained | Buy | $5.12 |
SIQSmartgroup Corporation | Morgan Stanley | Upgraded | Overweight(from Equal Weight) | $13.00(from $11.00) |
SLCSuperloop | Morgan Stanley | Retained | Overweight | $4.00 |
SLDSaluda Medical, Inc. | Morgans | Retained | Speculative Buy | $2.17(from $2.94) |
SS1Sun Silver | Canaccord Genuity | Retained | Speculative Buy | $2.85 |
SSMService Stream | Morgan Stanley | Retained | Overweight | $2.90 |
TCLTransurban Group | Macquarie | Retained | Neutral | $13.50 |
TLSTelstra Group | Citi | Upgraded | Buy(from Neutral) | $5.25 |
TTTTitomic | Ord Minnett | Downgraded | Hold(from Speculative Buy) | $0.18(from $0.38) |
VNTVentia Services Group | Ord Minnett | Retained | Accumulate | $6.25(from $6.10) |
Scans
Top Gainers
Code | Company | Last | % Chg |
|---|---|---|---|
| DTZ | DOTZ Nano Ltd | $0.026 | +62.50% |
| VR8 | Vanadium Resources Ltd | $0.027 | +42.11% |
| RAP | Raptor Metals Ltd | $0.028 | +40.00% |
| KAO | Kaoko Metals Ltd | $2.50 | +35.14% |
| MXI | Maxiparts Ltd | $2.29 | +33.92% |
Top Fallers
Code | Company | Last | % Chg |
|---|---|---|---|
| CTD | Corporate Travel Management Ltd | $2.32 | -85.56% |
| REG | Regis Healthcare Ltd | $4.30 | -27.00% |
| GTN | GTN Ltd | $0.20 | -20.00% |
| LPE | Locality Planning Energy Holdings Ltd | $0.105 | -19.23% |
| IAM | Income Asset Management Group Ltd | $0.017 | -17.50% |
52 Week Highs
Code | Company | Last | % Chg |
|---|---|---|---|
| KAO | Kaoko Metals Ltd | $2.50 | +35.14% |
| TET | Tetragon Energy Ltd | $0.34 | +25.93% |
| BCM | Brazilian Critical Minerals Ltd | $0.074 | +13.85% |
| AVH | Avita Medical Inc | $3.01 | +7.50% |
| SOP | Synertec Corporation Ltd | $0.074 | +7.25% |
52 Week Lows
Code | Company | Last | % Chg |
|---|---|---|---|
| CTD | Corporate Travel Management Ltd | $2.32 | -85.56% |
| REG | Regis Healthcare Ltd | $4.30 | -27.00% |
| RAN | Range International Ltd | $0.12 | -14.29% |
| TWL | Trade Window Holdings Ltd | $0.098 | -10.91% |
| SNG | Siren Gold Ltd | $0.04 | -9.09% |
Near Highs
Code | Company | Last | % Chg |
|---|---|---|---|
| SMLL | Betashares Australian Small Companies Select ETF | $4.53 | +0.67% |
| RHC | Ramsay Health Care Ltd | $51.80 | -1.11% |
| AN3PI | Australia and New Zealand Banking Group Ltd | $103.43 | -0.16% |
| PCI | Perpetual Credit Income Trust | $1.11 | +0.91% |
| WVOL | iShares MSCI World Ex Aust Minimum Volatility ETF | $45.92 | -0.09% |
Relative Strength Index (RSI) Oversold
Code | Company | Last | % Chg |
|---|---|---|---|
| WBT | Weebit Nano Ltd | $3.44 | -0.58% |
| SEA | SEA Forest Ltd | $1.55 | +0.65% |
| WGB | Wam Global Ltd | $2.00 | -2.91% |
| KGN | Kogan.com Ltd | $3.44 | -0.29% |
| ABG | Abacus Group | $0.83 | -3.49% |
