
The ASX 200 surged to a two-month high as the Democrat sweep of the US midterms triggered one of the most dramatic single-session reversals in years, with short-covering and a risk-on rotation lighting up metals, gold, and technology stocks. Energy was the standout loser as the oil price plunged for a second consecutive session.
Be sure to click/scroll through for the usual reporting of the major sector and stock-specific moves, the broker responses to them, as well as all the key economic data in tonight's Evening Wrap. Also, I have detailed technical analysis on the Nasdaq Composite and the S&P/ASX 200 in today's ChartWatch.
Let’s dive in!
Today in Review
Name | Value | % Chg |
|---|---|---|
Major Indices | ||
| ASX 200 | 9,065.1 | +2.61% |
| All Ords | 9,205.2 | +2.80% |
| Small Ords | 3,272.3 | +4.72% |
| All Tech | 3,048.0 | +8.22% |
| Emerging Companies | 2,809.5 | +4.54% |
Currency | ||
| AUD/USD | 0.7013 | +0.10% |
US Futures | ||
| S&P 500 | 7,694.0 | -0.34% |
| Dow Jones | 53,624.0 | +0.23% |
| Nasdaq | 28,194.75 | -1.30% |
Name | Value | % Chg |
|---|---|---|
Sector | ||
| Information Technology | 1,797.6 | +10.09% |
| Materials | 23,185.9 | +7.55% |
| Health Care | 35,329.1 | +3.64% |
| Real Estate | 3,523.8 | +3.35% |
| Consumer Staples | 13,621.0 | +3.27% |
| Consumer Discretionary | 3,847.4 | +2.57% |
| Industrials | 8,422.8 | +2.22% |
| Communication Services | 1,651.8 | +2.05% |
| Financials | 9,754.2 | -0.29% |
| Utilities | 10,652.3 | -1.51% |
| Energy | 10,242.3 | -4.76% |
ASX 200 Intraday Chart
Markets
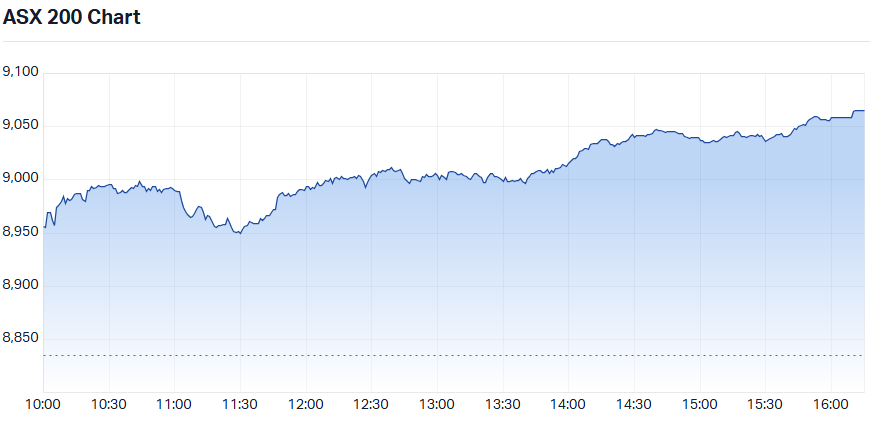
The S&P/ASX 200 (XJO) finished 230.6 points higher at 9,065.1, 2.6% from its session low and smack–bang on its session high. In the broader-based S&P/ASX 300 (XKO) advancers beat decliners by an emphatic 255 to 39. 🚀
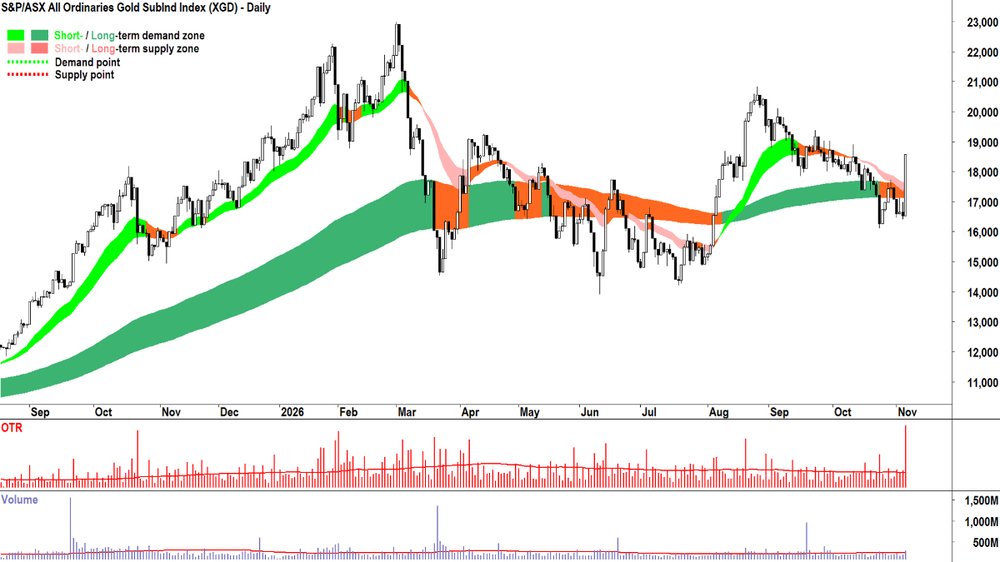
The Gold Sub-Index (XGD) (+12.4%) exploded higher in a move that you might see once-or-twice-a-decade — the kind of seismic single-session surge that usually marks a major shift in the global macro landscape. Or it was just another day on the Old Tin Pot! 🤣
COMEX gold futures surged 3.4% overnight, adding a further +1.3% to US$4,127/oz in Asian trade, as the oil price collapse provided a powerful tailwind for gold producers. Lower oil price equals lower operating costs, equals higher profits. And so it went for goldies, and the broader mining cohort.
In gold, the short-covering was ferocious: Pantoro Gold (PNR) (+18.5%), Catalyst Metals (CYL) (+18.3%), Genesis Minerals (GMD) (+15.4%), Evolution Mining (EVN) (+14.2%), and Newmont (NEM) (+13.0%) all surged. Northern Star Resources (NST) (+9.9%) also ran hard.
S&P-ASX All Ordinaries Gold SubInd Index (XGD) chart
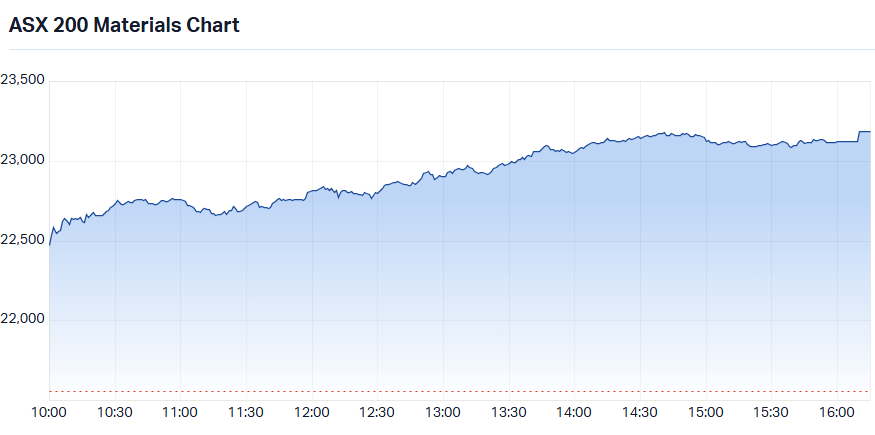
Materials (XMJ) (+7.6%) more broadly surged across all sub-sectors as the oil price collapse unlocked value in beaten-down miners and critical minerals names, with panicked short-covering amplifying every move.
Copper stocks led the charge — COMEX copper futures recovered from lows near US$6.25/lb on Wednesday to close the Asian session at US$6.392/lb, and the sentiment reversal was enough to trigger large-scale short-covering. Rio Tinto (RIO) (+7.0%), Sandfire Resources (SFR) (+6.8%), South32 (S32) (+6.6%), BHP (BHP) (+6.2%), and Capstone Copper (CSC) (+5.5%) all surged.
Iron ore also ran — SGX iron ore futures climbed +1.3% to US$92.85/t in Asian trade — though the magnitude of the stock moves far outpaced the commodity itself, again suggesting heavy short-covering. Champion Iron (CIA) (+17.3%) was among the biggest movers on the entire ASX, with Fortescue (FMG) (+9.2%) also surging.
Lithium stocks joined the party as GFEX lithium carbonate futures jumped +5.3% to CNY91,040/t, snapping a bruising run lower. Pilbara Minerals (PLS) (+8.8%) led the sector higher.
Rare earths also caught a bid — NdPr prices in China rose +1.9% to CNY712,000/t. Lynas Rare Earths (LYC) (+8.0%) was the standout mover.
S&P/ASX 200 Materials Sector Index (XMJ) intraday chart
Information Technology (XIJ) (+10.1%) staged an equally dramatic reversal. The initial fear — that a Democrat-controlled Congress would impose stricter data centre oversight and choke the AI build-out — quickly gave way to the realisation that constrained capacity could actually hand pricing power to the hyperscalers. The pivot from panic to euphoria was swift, and ASX tech names rode the coattails of Wall Street’s best day in months. NextDC (NXT) (+50.8%) was in a class of its own after the takeover raid. Xero (XRO) (+12.5%), Life360 (360) (+9.7%), and WiseTech Global (WTC) (+7.5%) all ran hard.
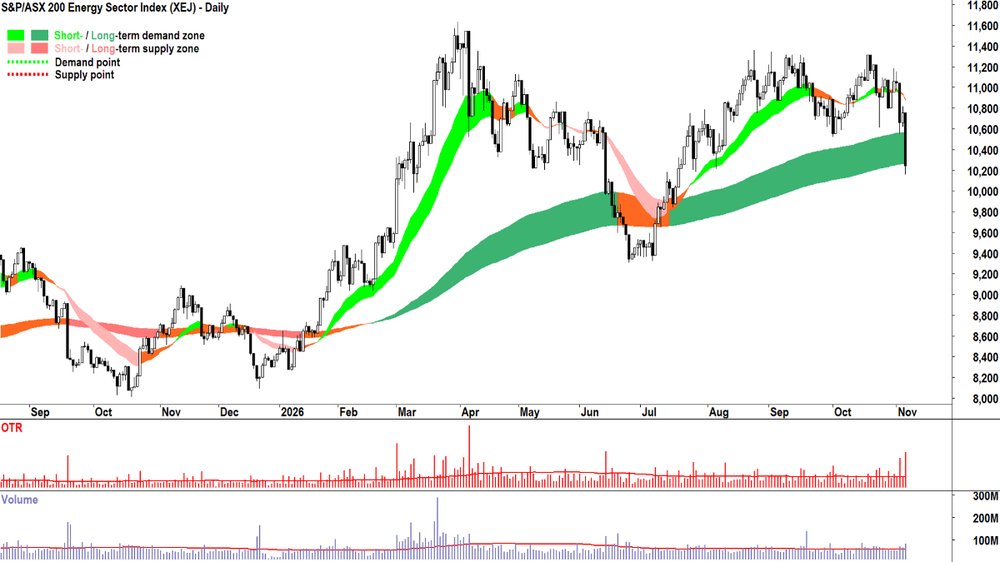
Energy (XEJ) (-4.8%) was the session’s big loser. ICE benchmark Brent crude oil futures had plunged 8.7% overnight after President Trump said he had no plans to strike Iran and Vice President Vance attributed the Republicans’ midterm defeat partly to the ongoing Middle East conflict — the two signals together effectively removed the geopolitical risk premium that had underpinned oil prices for months. Brent steadied with a mild -0.3% dip to US$94.30/bbl in Asian trade, but the damage was done.
Woodside Energy (WDS) (-6.0%) and Santos (STO) (-5.4%) bore the brunt in oil and gas. Coal names also fell: New Hope Corp (NHC) (-4.3%) and Yancoal Australia (YAL) (-4.0%) retreated. Fuel refiners gave back Wednesday’s gains: Viva Energy (VEA) (-4.6%) and Ampol (ALD) (-3.6%) both fell. Uranium was the exception — the sub-sector was swept up in the broader critical minerals enthusiasm, with Deep Yellow (DYL) (+9.4%), Boss Energy (BOE) (+5.9%), Paladin Energy (PDN) (+5.9%), and Bannerman Energy (BMN) (+5.4%) all surging.
S&P/ASX 200 Energy Sector Index (XEJ) chart
Financials (XFJ) (-0.3%) slipped as the rotation back into mining required capital to be pulled from somewhere — and financials had been among the biggest beneficiaries of the resources sector’s decline in recent weeks, so it was first in line. National Australia Bank (NAB) (-5.4%) compounded the sector’s pain with a poor full-year result. Westpac Banking Corp (WBC) (-1.0%) and ANZ (+ANZ) (-0.6%) also fell, while Commonwealth Bank of Australia (CBA) closed flat — a notable outperformance given the day’s crosscurrents.
Today's best ASX Top 300 gainers
Company | Last Price | Change $ | Change % | 1mo % | 1yr % |
|---|---|---|---|---|---|
| NEXTDC (NXT) | $9.85 | +$3.32 | +50.8% | -8.3% | -36.2% |
| Pantoro Gold (PNR) | $3.27 | +$0.51 | +18.5% | +11.6% | -33.4% |
| Catalyst Metals (CYL) | $4.13 | +$0.64 | +18.3% | -28.3% | -39.5% |
| Neuren Pharmaceuticals (NEU) | $23.24 | +$3.46 | +17.5% | +14.6% | +14.9% |
| Champion Iron (CIA) | $2.07 | +$0.305 | +17.3% | -32.4% | -62.4% |
| Zip Co (ZIP) | $2.14 | +$0.29 | +15.7% | +3.4% | -43.2% |
| Genesis Minerals (GMD) | $7.33 | +$0.98 | +15.4% | +3.1% | +29.3% |
| Ora Banda Mining (OBM) | $1.475 | +$0.195 | +15.2% | 0.0% | +28.3% |
| Resolute Mining (RSG) | $1.25 | +$0.16 | +14.7% | +10.6% | +51.5% |
| Westgold Resources (WGX) | $5.86 | +$0.75 | +14.7% | +11.6% | +11.2% |
| Greatland Resources (GGP) | $10.83 | +$1.38 | +14.6% | +5.0% | +49.2% |
| Evolution Mining (EVN) | $13.26 | +$1.65 | +14.2% | +1.3% | +28.4% |
| Kingsgate Consolidated (KCN) | $4.42 | +$0.55 | +14.2% | -7.7% | +1.8% |
| Capricorn Metals (CMM) | $14.50 | +$1.79 | +14.1% | +0.7% | +13.1% |
| Vault Minerals (VAU) | $6.05 | +$0.73 | +13.7% | +2.0% | +33.9% |
| PDI Gold (PDI) | $4.60 | +$0.54 | +13.3% | -9.8% | +72.0% |
| Regis Resources (RRL) | $6.87 | +$0.80 | +13.2% | -6.0% | +9.4% |
| Minerals 260 (MI6) | $0.82 | +$0.095 | +13.1% | -5.2% | +192.9% |
| Newmont Corporation (NEM) | $174.39 | +$20.09 | +13.0% | +5.4% | +42.6% |
| Alkane Resources (ALK) | $1.785 | +$0.205 | +13.0% | -5.3% | +80.3% |
Today's worst ASX Top 300 losers
Company | Last Price | Change $ | Change % | 1mo % | 1yr % |
|---|---|---|---|---|---|
| Eagers Automotive (APE) | $16.61 | -$2.53 | -13.2% | -9.0% | -49.4% |
| Amcor Plc (AMC) | $62.11 | -$5.25 | -7.8% | +2.4% | +2.1% |
| Codan (CDA) | $56.12 | -$3.69 | -6.2% | -16.8% | +60.8% |
| Woodside Energy Group (WDS) | $30.59 | -$1.96 | -6.0% | -2.1% | +21.6% |
| Santos (STO) | $8.56 | -$0.49 | -5.4% | +0.2% | +35.4% |
| National Australia Bank (NAB) | $38.96 | -$2.21 | -5.4% | +1.2% | -12.5% |
| Viva Energy Group (VEA) | $2.68 | -$0.13 | -4.6% | -17.3% | +48.5% |
| New Hope Corporation (NHC) | $5.35 | -$0.24 | -4.3% | -8.2% | +28.0% |
| Yancoal Australia (YAL) | $5.57 | -$0.23 | -4.0% | -2.5% | -0.4% |
| Ampol (ALD) | $36.23 | -$1.35 | -3.6% | -18.1% | +19.8% |
| Light & Wonder Inc. (LNW) | $121.04 | -$3.96 | -3.2% | +11.0% | +4.9% |
| Karoon Energy (KAR) | $1.595 | -$0.05 | -3.0% | +2.6% | +3.9% |
| Origin Energy (ORG) | $12.14 | -$0.26 | -2.1% | +11.4% | +1.7% |
| BlueScope Steel (BSL) | $31.90 | -$0.57 | -1.8% | +4.2% | +46.6% |
| Tasmea (TEA) | $9.10 | -$0.12 | -1.3% | -15.2% | +82.0% |
| Beach Energy (BPT) | $0.91 | -$0.01 | -1.1% | +7.1% | -26.6% |
| Southern Cross Electrical Engineering (SXE) | $3.79 | -$0.04 | -1.0% | -21.9% | +58.6% |
| Aurizon Holdings (AZJ) | $3.85 | -$0.04 | -1.0% | +4.1% | +13.2% |
| Westpac Banking Corporation (WBC) | $36.64 | -$0.37 | -1.0% | +6.8% | -8.9% |
| APA Group (APA) | $11.16 | -$0.11 | -1.0% | +4.6% | +21.2% |
Chartwatch
Nasdaq Composite Index
Nasdaq Composite Index chart
Analysis
The Dow Jones logged a massive demand side candle. As did the S&P500 Equal Weight — a new closing all time high.
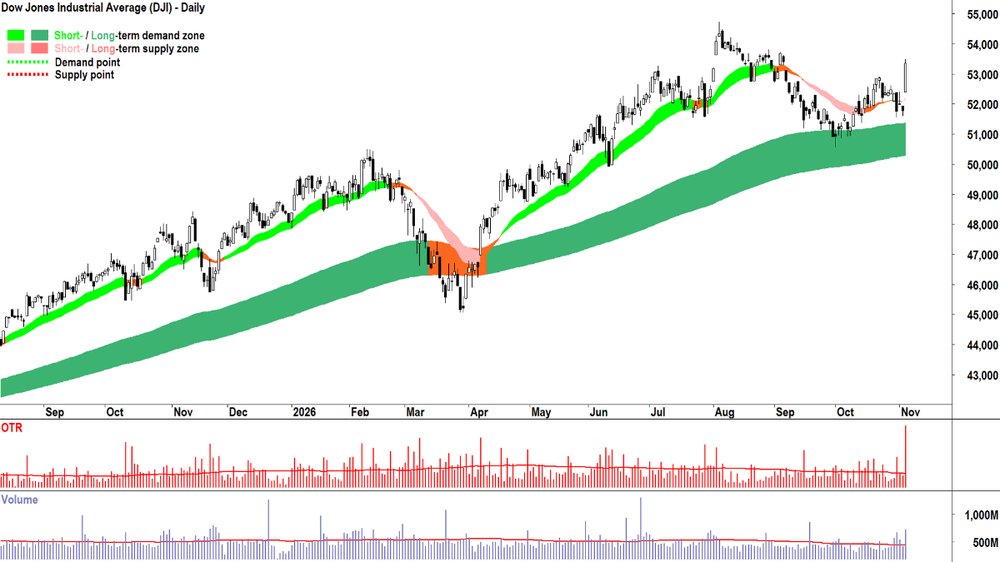
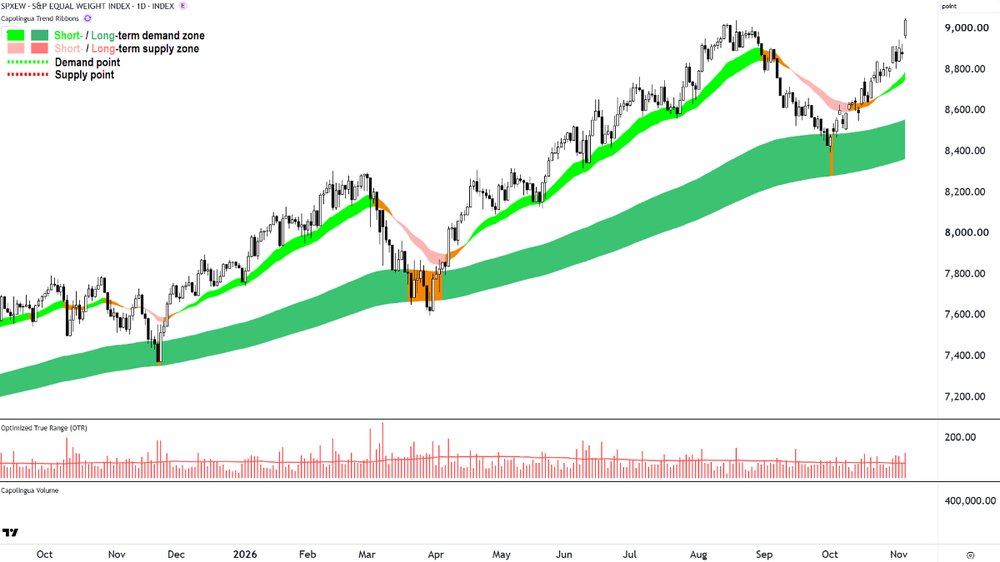
Dow Jones Industrial Average chart (top) and S&P 500 Equal Weight Index chart (bottom)
We talked about the S&P500 EW in the webinar yesterday (link below). The average S&P500 stock just closed at record highs.
It's one of the key reasons why I was not in the "the market is about to crash" camp. It just didn't add up that this chart could be so strong, and yet there was some kind of financial calamity coming.
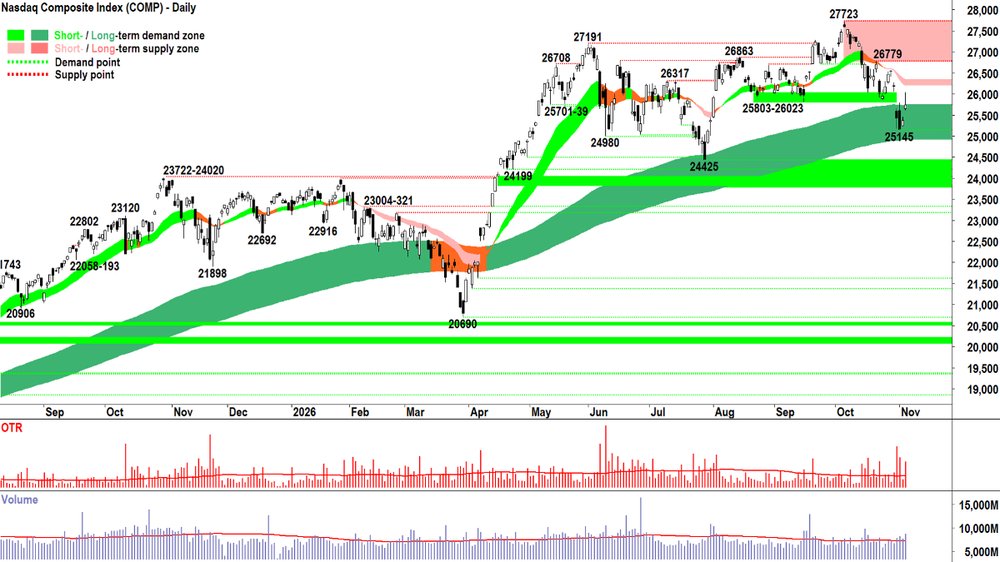
The Comp is a very different index. It is far growthier, far more beholden to the whims of the AI trade faithful / unfaithful depending on which way the wind is blowing!
It was also up on Weds, but its candle's close, with it's long upward pointing shadow flagging healthy STR activity — far from a convincing show.
It's tempting to go with more risk here. But I think all things considered, the balanced approach remains the right choice for me! ⚖️
(The other main point I made in the webinar yesterday was the crucial importance of the oil price on stocks... and there you go! 😉 Species ending event anyone!? 🦕🦖🌠)
View
I am 1/2RP on US stocks (RP = Risk Position – it reflects my personal allowable capital allocation limit for my investments in US stocks. So 1/2RP is 50%, 2/3RP is 67% and FRP is 100%).
Key Levels
The short term trend ribbon is the closest (dynamic) zone of supply (presently 26250–26382). The long term uptrend ribbon is the closest (dynamic) zone of demand (presently 25908-25732).
S&P/ASX 200 (XJO)
S&P/ASX 200 (XJO) chart
Analysis
"Crazy, stupid moves".
"Perfect sense".
Which of those two statements you believe is true likely depends on the composition of your portfolio. Own any of the mining stocks that popped 10%, 15% or in some cases more, today... and you'd think everything was right in the world again.
I can't let myself have an opinion either way. It just is. 🤷
I must go through my 3-A's process and deal with it. I.e., I must figure out who's in control of the price, and manage my risk accordingly.
But, can I say, in over 30 years of watching markets... my, was today was a doosy! 🤦
Boy that escalated quickly today!
I wish I could say the trends were kind today. Mostly, they weren't. Face ripping rallies in areas where the trends previously were down. Probably because shorts were caught off guard by the sheer totality of the Dem's success in the US mid-terms... and NAB's result ("news", remember?) sent a few of the other trends that were previously benefiting from mining's demise, the other way.
Double whammy 🥊🤕
But moves like today are exactly why my model has evolved to what it is. In choppy markets, trend followers get chopped up = REDUCE RISK.
So, I, we, live to fight another day. What's that day MOTN likely to deliver? Gains or losses? 🤔
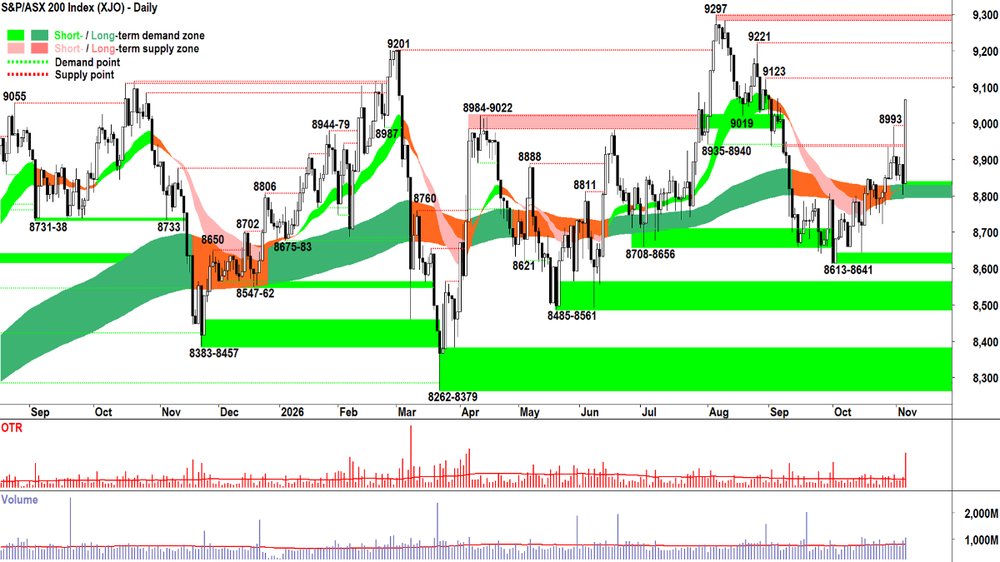
One cannot discount today's massive (I mean bloody massive!) white candle. Its high close. Its above average volume...
But to be fair, the only major surprise today is its severity. Because we had already moved from 1/3RP to 1/2RP on growing indications in the trends, price action, and candles — that the demand-side was increasing its control of the OTP.
"Thou shall not pass" + "Why won't you die?" kind of stuff. And as you've heard me say so many times here:
In my experience, if something that probably should go down can't go down... it will probably go up!
Let's run the checklist 📋:
ST Trend/ LT Trend: ⬆️/⬆️ ✅
Price action: Rising peaks and rising troughs (BTD + FOMO + HOFO) ✅
Candles: (After today) predominantly demand-side in nature ✅
POS: 8935-40 and 8993 BLITZED! ✅ However, likely still a major zone of supply really anywhere > 9123 ⚠️
Analysis suggests: ✅✅✅✅⚠️
Accept suggests: MOTN P ⬆️ with some caution required / watch for signals that the supply side remains vigilant between 9123-9297.
View
Act: I am increasing my RP cap to 2/3RP on Australian shares (i.e., 67% cash vs 33% invested, with some of the invested portion allocated to shorts). It may take some time to get there. No rush!
Key Levels
9123-9297 is the closest zone of supply. The short-long term trend ribbons are the closest zone of (dynamic) demand (presently 8795-8845).
(Glossary of acronyms! Old Tin Pot (OTP): S&P/ASX 200 | MOTN: More Often Than Not | FOMO: Fear Of Missing Out | HOFU: Holding On For Upside | BTD: Buy The Dip | NUTE: No Urgency To Enter | FOHO: Fear Of Holding On | STR: Sell The Rally | RP: Risk Position | FFS: Fund Flow Shenanigans!)
***CHARTWATCH LIVE — NEW VIDEO DROPPED!!! 📺***
ChartWatch LIVE Webinars – WEEKLY Wednesday's @ 12pm AEDT
Learn more about technical analysis and trend following through real case studies on ASX stocks. Australia's premier technical analyst, Carl Capolingua, shares his unique insights on stocks as requested by viewers. Ask about a company in your portfolio or anything related to trading and investing and get Carl's expert opinion.
Places are limited so >REGISTER NOW!<
Economy
TODAY
AUS October Consumer Spending:
Result: +0.6% m/m vs +0.2% m/m forecast and +0.0% m/m in September
Reader: Some of that +0.6% month-on-month gain is inflation... but we're all kinda responsible for poor old Michelle Bullock's worst nightmare! 🤣 Too much demand!!!
LATER THIS WEEK
WEDNESDAY
USA October ISM Service PMI (54.9 forecast, unchanged)
THURSDAY
UK Bank of England Official Rate (+0.25% p.a. forecast to 4.00% p.a.)
FRIDAY
21:30 USA October Non-Farm Payroll Data
Employment change: +63,000 forecast v s+29,000 in September
Average hourly earnings: +0.3% m/m forecast vs +0.1% m/m in September
Unemployment rate: +4.2% forecast, unchanged
Interesting Movers
Trading higher
- NEXTDC (NXT) $9.85+50.8%
Responded to reports that entities controlled by Goodman Group (GMG) and Digital Realty took a substantial shareholding. NXT management noted that the raiders have said they have 'no intention of submitting a control proposal or making a takeover bid... but reserve their right to do so'. NXT board has called the raid 'opportunistic'.
- Pantoro Gold (PNR) $3.27+18.5%
No news. Performance reflected general strength in the broader precious metals sector. PNR was one of many major gold producers that enjoyed massive gains today – many in excess of 10% 🚀
- Catalyst Metals (CYL) $4.13+18.3%
No news. Performance reflected general strength in the broader precious metals sector. Massive rotation back into mining stocks today as the oil price tumbled and many key commodity price contracts rose.
- Vulcan Energy Resources (VUL) $1.24+18.2%
No news. Performance reflected general strength in the broader materials sector.
- Neuren Pharmaceuticals (NEU) $23.24+17.5%
Announced September sales. Q3 2026 DAYBUE net sales of US$140 million, up 39% vs previous corresponding period ("pcp") driven by strong uptake of DAYBUE STIX. Q3 2026 royalty income of US$16.4 million, up 51% vs pcp. Management upgraded guidance for 2026 total income from trofinetide to US$91–93 million.
- Elevra Lithium (ELV) $3.57+17.4%
No news. Performance reflected general strength in the broader materials sector.
- Champion Iron (CIA) $2.07+17.3%
No news. Performance reflected general strength in the broader materials sector.
- REA Group (REA) $179.51+10.9%
Released a September quarter trading update. Q1 revenue $450 million, up 11% vs pcp. Residential revenue +10% vs pcp and earnings up 12%. Record engagement with active members up 9% and 5.3 million properties tracked.
- Fortescue (FMG) $15.42+8.7%
Announced that it had signed a US$1.5bn cross‑currency debt deal with Chinese investors (roughly 10 billion yuan maturing in six years), with an effective fixed annual interest rate ~3.9%. Proceeds will be used for general corporate purposes including repayment of existing US$2.8 billion debt.
- Breville Group (BRG) $32.47+5.7%
Released a September quarter trading update. Sales in the first quarter were in line with expectations. Management noted that premium consumers were continuing to spend and coffee remains a growth category.
- Harvey Norman Holdings (HVN) $4.47+3.4%
Announced that it has extended its on‑market share buyback for another year to Nov 23 next year. Management said that the company could buy up to 10% of stock and the buyback could cost as much as $583.3 million.
Trading Lower
- Eagers Automotive (APE) $16.61-13.2%
Released a September quarter trading update. Recent trading was impacted by industry‑wide headwinds and poor consumer sentiment, elevated interest rates, persistent inflationary pressures, and higher fuel prices. Management still expects the company will record revenue of $17.3 billion–$17.5 billion in 2026.
- BetaShares Crude Oil Index ETF-Currency Hedged (Synthetic) (OOO) $9.46-10.0%
No news. The oil price tumbled overnight as the breadth of the Democrats success in US mid-term elections became apparent. OOO is a crude oil ETF, if the price of oil falls – it must too! 💥
- Amcor Plc (AMC) $62.11-7.8%
Released its September quarter results. Net sales $6,129 million, up 7% vs pcp with Adjusted EBITDA $883 million (flat vs pcp). Adjusted EBIT margin at 11.2% was impacted by a 90‑bp dilution from passing through higher raw material costs. Quarterly dividend 66.0c vs 65.0c pcp. Management lowered outlook for Adjusted EPS to $1.70–1.80 from $1.80–1.90 due to timing of pass‑through of higher energy and distribution costs.
- Woodside Energy Group (WDS) $30.59-6.0%
Held its annual investor day today. Management flagged it will cut more than 500 jobs to reduce costs by about $570 million and lift returns. Today's decline likely linked to broader energy sector weakness after a sharp overnight fall in the oil price.
- Betashares Austalian Equities Strong Bear Hedge Fund (BBOZ) $20.30-5.9%
No news. Aussie stocks were on a tear today on the back of the Democrats success in US mid-term elections. A bear fund like this prospers when stock prices are falling, but when they're soaring – it must go the other way! 💥
- Santos (STO) $8.56-5.4%
No news. Performance reflected general weakness in the broader energy sector.
- National Australia Bank (NAB) $38.96-5.4%
Released its FY26 results. Cash earnings down 13.4% to $6.14 billion (around a 3.4% miss vs estimates). Underlying profit down 5.4% to $10.38 billion (~0.9% miss). Credit impairment charge up 86% to $1.55 billion (~13.5% miss) with $1.08 billion related to individual customers. Added $403 million to forward-looking provisions citing a more challenging environment. Bad debts and home-loan arrears rose. Final dividend 85c fully franked (FY 170c in line).
- Southern Cross Media Group (SXL) $0.49-3.9%
Released a September quarter update. Management flagged it will cut more than the $150 million in costs previously announced. The company is to be rebadged as the Seven Media Group.
- Light & Wonder Inc. (LNW) $122.34-2.1%
Released its September quarter results. Revenue fell 2% to US$824 million while earnings climbed 2%. Online casino segment revenue was up 13%, but gaming systems revenue fell 24%. Full‑year earnings outlook now towards the lower end of prior guidance due to softness in the free‑to‑play social casino market and deferred customer capital spending.
- Vicinity Centres (VCX) $2.46-1.0%
Released an update on the likely earnings impact from the collapse of David Jones. The company is exposed to four David Jones stores which contribute about $34 million (~2.4%) of portfolio gross rental income. Outstanding unpaid rent is ~ $2.2 million. There are no bank guarantees for the stores. Management said that the 'nature, timing and quantum of the financial impact cannot currently be determined.'
Broker Moves
Company | Broker | Action | Rating | Price Target |
|---|---|---|---|---|
AMCAmcor Plc | Macquarie | Retained | Outperform | $70.00 |
ARFArena REIT | UBS | Retained | Buy | $3.04(from $2.94) |
BWPBWP Trust | UBS | Retained | Neutral | $3.64(from $3.80) |
CHCCharter Hall Group | UBS | Retained | Buy | $23.75(from $24.00) |
CIPCenturia Industrial REIT | UBS | Downgraded | Neutral(from Buy) | $3.13(from $3.45) |
CLWCharter Hall Long Wale REIT | Citi | Retained | Buy | $4.00 |
| UBS | Retained | Sell | $3.50 | |
CNICenturia Capital Group | UBS | Retained | Buy | $1.72(from $1.80) |
COFCenturia Office REIT | UBS | Retained | Neutral | $0.87(from $0.88) |
COGCOG Financial Services | Ord Minnett | Retained | Buy | $2.32(from $2.20) |
CQRCharter Hall Retail REIT | UBS | Retained | Neutral | $3.90(from $4.20) |
CSLCSL | Morgans | Downgraded | Hold(from Buy) | $210.00(from $187.71) |
CYLCatalyst Metals | Morgans | Retained | Buy | $9.66(from $11.33) |
DNLDyno Nobel | UBS | Retained | Neutral | $4.15(from $3.75) |
DXSDexus | UBS | Retained | Neutral | $6.16(from $6.21) |
ELDElders | Macquarie | Retained | Outperform | $7.30(from $7.50) |
FLTFlight Centre Travel Group | UBS | Retained | Buy | $14.10 |
GLFGemlife Communities Group | UBS | Retained | Buy | $5.30(from $5.70) |
GMGGoodman Group | Bell Potter | Retained | Hold | $29.90(from $30.10) |
| Morgan Stanley | Retained | Overweight | $36.15 | |
| Morgans | Upgraded | Buy(from Accumulate) | $33.20 | |
| Ord Minnett | Retained | Hold | $25.90(from $27.65) | |
| UBS | Retained | Buy | $33.19(from $34.46) | |
GNCGraincorp | Macquarie | Retained | Neutral | $6.75(from $7.00) |
GPTGPT Group | UBS | Retained | Buy | $5.60 |
HDNHomeCo Daily Needs REIT | UBS | Retained | Buy | $1.30 |
HMCHMC Capital | UBS | Retained | Buy | $3.80 |
IAGInsurance Australia Group | Macquarie | Retained | Neutral | $8.20 |
KGLKGL Resources | Morgans | Retained | Speculative Buy | $0.46(from $0.30) |
LICLifestyle Communities | UBS | Retained | Neutral | $4.90(from $5.70) |
MGRMirvac Group | UBS | Retained | Neutral | $1.96(from $1.99) |
MPKMany Peaks Minerals | Canaccord Genuity | Retained | Speculative Buy | $1.90 |
NANNanosonics | Morgans | Retained | Accumulate | $3.50 |
NUFNufarm | Macquarie | Retained | Neutral | $2.90 |
NXTNEXTDC | Citi | Retained | Buy | $12.75 |
ORIOrica | UBS | Retained | Buy | $27.00 |
PDIPDI Gold | Ord Minnett | Retained | Buy | $6.25(from $6.20) |
QANQantas Airways | Macquarie | Retained | Outperform | $10.10(from $10.40) |
REAREA Group | Citi | Retained | Neutral | $165.00 |
RFFRural Funds Group | UBS | Downgraded | Neutral(from Buy) | $2.12(from $2.30) |
RGNRegion Group | UBS | Retained | Neutral | $2.35(from $2.45) |
RSGResolute Mining | Ord Minnett | Retained | Buy | $1.60 |
RXLRox Resources | Canaccord Genuity | Retained | Speculative Buy | $1.15 |
SCGScentre Group | UBS | Retained | Neutral | $3.90(from $3.85) |
SGPStockland | UBS | Retained | Buy | $4.86(from $5.01) |
SUNSuncorp Group | Macquarie | Retained | Outperform | $20.60 |
TCGTuraco Gold | Macquarie | Retained | Outperform | $1.00 |
TLXTelix Pharmaceuticals | Citi | Retained | Buy | $31.00 |
| UBS | Retained | Buy | $26.00 | |
TREToubani Resources Inc | Canaccord Genuity | Retained | Speculative Buy | $1.00 |
VCXVicinity Centres | UBS | Retained | Neutral | $2.65(from $2.70) |
VMMViridis Mining and Minerals | Canaccord Genuity | Retained | Speculative Buy | $6.50 |
WRKwrkr | Morgans | Retained | Buy | $0.11(from $0.12) |
WTMWaratah Minerals | Bell Potter | Retained | Speculative Buy | $1.45(from $1.25) |
XROXero | Citi | Retained | Buy | $91.55 |
Scans
Top Gainers
Code | Company | Last | % Chg |
|---|---|---|---|
| NXT | NEXTDC Ltd | $9.85 | +50.84% |
| SDV | Scidev Ltd | $0.17 | +36.00% |
| VMT | Vmoto Ltd | $0.12 | +33.33% |
| JLL | Jindalee Lithium Ltd | $0.40 | +31.15% |
| KEY | KEY Petroleum Ltd | $0.067 | +28.85% |
Top Fallers
Code | Company | Last | % Chg |
|---|---|---|---|
| DTZ | DOTZ Nano Ltd | $0.013 | -27.78% |
| ZGL | ZICOM Group Ltd | $0.12 | -20.00% |
| TER | Terracom Ltd | $0.025 | -19.36% |
| CP8 | Canadian Phosphate Ltd | $0.115 | -14.82% |
| CVC | CVC Ltd | $1.46 | -13.86% |
52 Week Highs
Code | Company | Last | % Chg |
|---|---|---|---|
| BPM | BPM Minerals Ltd | $0.38 | +18.75% |
| XYZ | Block, Inc | $124.88 | +7.37% |
| REH | Reece Ltd | $18.97 | +4.63% |
| DRUG | Betashares Global Healthcare Currency Hedged ETF | $10.04 | +4.48% |
| DAOR | Aoris Int Fund (Class D) (Hedged) Active ETF | $2.10 | +3.96% |
52 Week Lows
Code | Company | Last | % Chg |
|---|---|---|---|
| DTZ | DOTZ Nano Ltd | $0.013 | -27.78% |
| TER | Terracom Ltd | $0.025 | -19.36% |
| CVC | CVC Ltd | $1.46 | -13.86% |
| APE | Eagers Automotive Ltd | $16.61 | -13.22% |
| LRM | Lion Rock Minerals Ltd | $0.014 | -12.50% |
Near Highs
Code | Company | Last | % Chg |
|---|---|---|---|
| BEAR | Betashares Australian Equities Bear Complex ETF | $7.45 | +0.54% |
| RHC | Ramsay Health Care Ltd | $55.25 | +0.05% |
| OZBD | Betashares Australian Composite Bond ETF | $43.18 | +0.21% |
| AN3PI | Australia and New Zealand Banking Group Ltd | $102.87 | +0.21% |
| PCI | Perpetual Credit Income Trust | $1.08 | +0.47% |
Relative Strength Index (RSI) Oversold
Code | Company | Last | % Chg |
|---|---|---|---|
| JPEQ | Jpmorgan Nasdaq Equity Premium Income Complex ETF | $57.00 | -0.63% |
| FANG | Global X Fang+ ETF | $33.90 | +0.36% |
| ETPMPM | Global X Metal Securities Australia Ltd | $332.25 | +0.23% |
| RAC | Racura Oncology Ltd | $1.40 | -3.45% |
| AMP | AMP Ltd | $2.13 | 0.00% |