
A massive profit downgrade from Nick Scali (NCK) (-15.3%) sent shockwaves through the Consumer Discretionary sector, putting the Australian share market on the back foot from the open. It would have stayed there, as major resources and energy stocks slid on global economic growth concerns, if not for another stalwart performance from the big banks and consumer staples stocks.
Be sure to click/scroll through for the usual reporting of the major sector and stock-specific moves, the broker responses to them, as well as all the key economic data in tonight's Evening Wrap. Also, I have detailed technical analysis on the Nasdaq Composite and the S&P/ASX 200 in today's ChartWatch.
Let’s dive in!
Today in Review
Name | Value | % Chg |
|---|---|---|
Major Indices | ||
| ASX 200 | 8,793.2 | -0.43% |
| All Ords | 8,917.1 | -0.44% |
| Small Ords | 3,138.4 | -0.49% |
| All Tech | 2,835.9 | +0.92% |
| Emerging Companies | 2,729.5 | -1.23% |
Currency | ||
| AUD/USD | 0.7014 | -0.20% |
US Futures | ||
| S&P 500 | 7,737.75 | -0.80% |
| Dow Jones | 52,838.0 | -0.42% |
| Nasdaq | 29,535.75 | -1.57% |
Name | Value | % Chg |
|---|---|---|
Sector | ||
| Industrials | 8,186.6 | +0.90% |
| Real Estate | 3,260.8 | +0.76% |
| Communication Services | 1,580.7 | +0.52% |
| Financials | 9,512.0 | +0.44% |
| Consumer Staples | 13,877.3 | +0.36% |
| Health Care | 34,313.8 | +0.08% |
| Utilities | 10,720.9 | +0.05% |
| Information Technology | 1,615.2 | +0.01% |
| Consumer Discretionary | 3,677.7 | -1.72% |
| Materials | 22,198.8 | -1.96% |
| Energy | 10,948.6 | -2.42% |
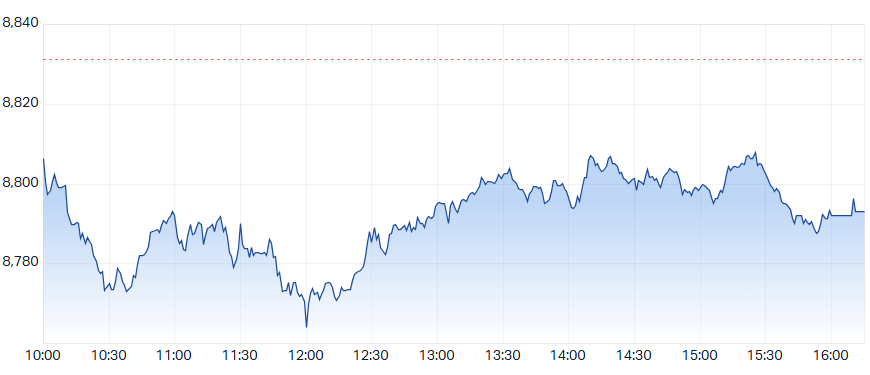
ASX 200 Intraday Chart
Markets
The S&P/ASX 200 (XJO) finished 38.1 points lower at 8,793.2, roughly mid-range, 0.33% from its session high and 0.43% from its low. Reflecting the neither-here-nor-there nature of today’s trade, in the broader-based S&P/ASX 300 (XKO) advancers and decliners were nearly dead-even at 139 to 140!
You've heard me use the idiom "Robbing Peter to pay Paul" here for, well, as long as you've been reading my Evening Wraps!
It turns out (after a little Googling) that its really an old proverb that dates back to the late 14th century, to works by English theologian, Catholic priest, and Oxford professor John Wycliffe in which he uses the Apostles Saint Peter and Saint Paul to comment on medieval shifts in church funds and assets.
That's the first thing you learned today. You're welcome. Because the next comment is something you already knew: The OTP is a Rob Peter to Pay Paul kind of market, and it's been like that since at least the 1300's! 😭
Here are the only two charts you need to know right now (um, two lots of two actually).
Exhibits A & B: S&P/ASX 200 Financials Sector Index (XFJ) daily & intraday charts
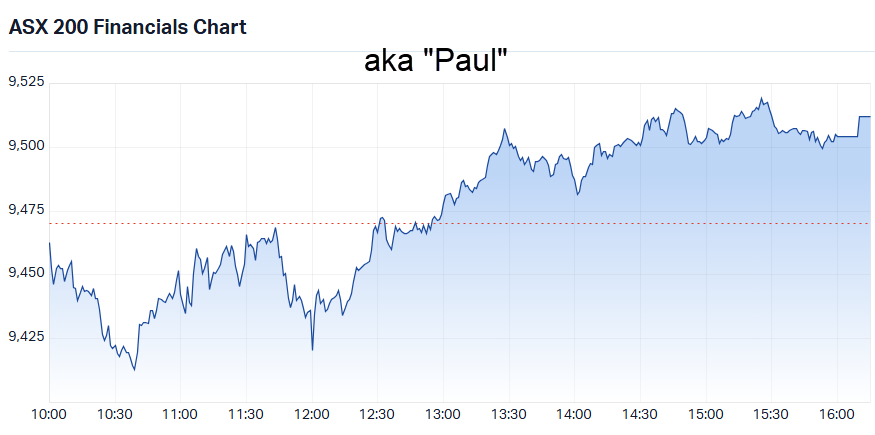
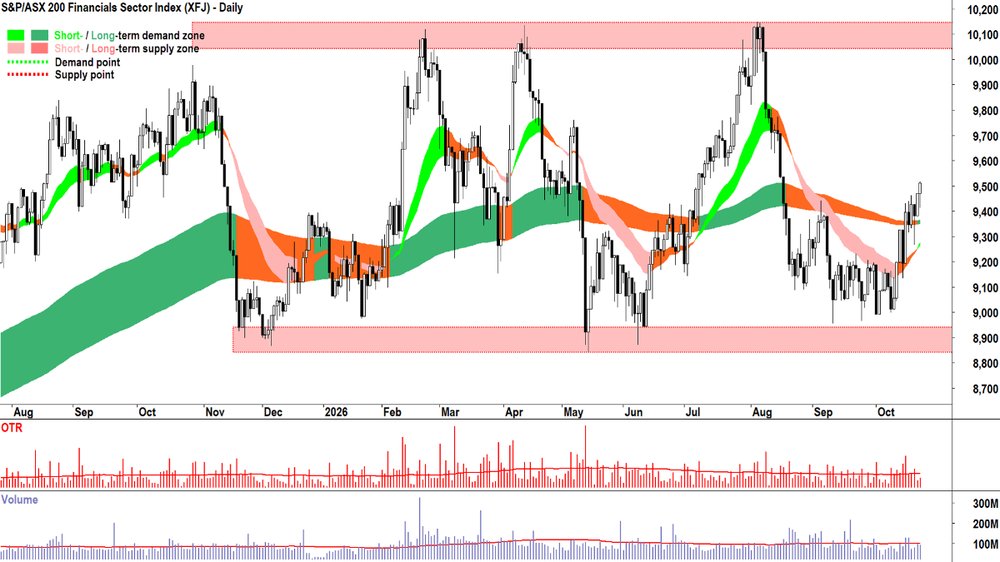
S&P-ASX 200 Financials Sector Index (XFJ) intraday chart (top), and daily chart (bottom)
Exhibits C & D: Materials Sector Index (XMJ) daily & intraday charts
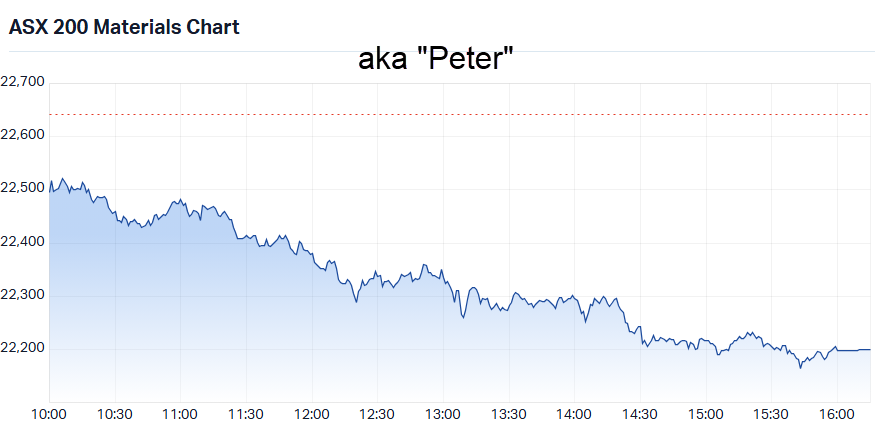
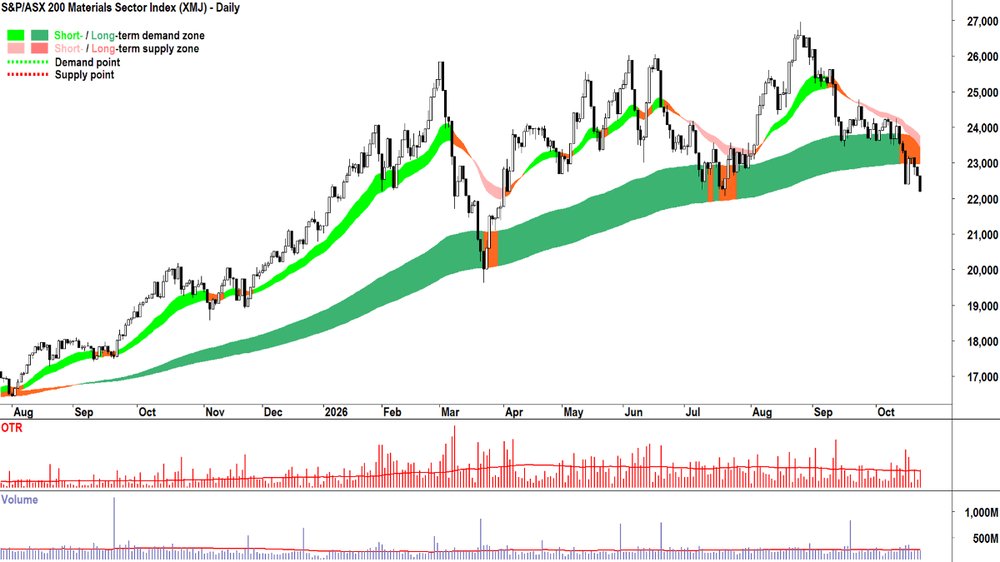
S&P-ASX 200 Materials Sector Index (XMJ) intraday chart (top), and daily chart (bottom)
It hasn't always been this way... because for much of the back-half of 2025-and that start of this year it was the exact opposite — mining stocks were Paul and the big banks were Peter.
And because they're roughly the same size in terms of market capitalisation — and because the OTP is a market capitalisation-weighted index — the net result of Peter down vs Paul up is, was, and probably forever shall be: roughly nil. 🤦
As for other stuff that happened today, I also note that another theme seemed to play out yet again. "Defence wins because capital still must be allocated in an uncertain investing environment". The reliable, recession-proof earnings streams of Consumer Staples (XSJ) (+0.4%), Health Care (XHJ) (+0.1%), and Utilities (XUJ) (+0.1%) joined Financials (XFJ) (+0.4%) in the winners column.
Apart from Materials (XMJ) (-2.0%), other growth sectors like Consumer Discretionary (XDJ) (-1.7%) were also hit today, this time on the back of Nick Scali (NCK) (-15.3%) warning FY27 profits will fall sharply due to "challenging" retail conditions.
Then you get stuff like Energy (XEJ) (-2.4%) as the worst performing sector today, even as brent crude oil is probing its highest close since the war with Iran began. There are some quarterly updates floating around (Woodside Energy (WDS) (-3.5%) yesterday and Santos (STO) (-1.3%) today) — but can I just say this is a rather tricky little market to navigate!
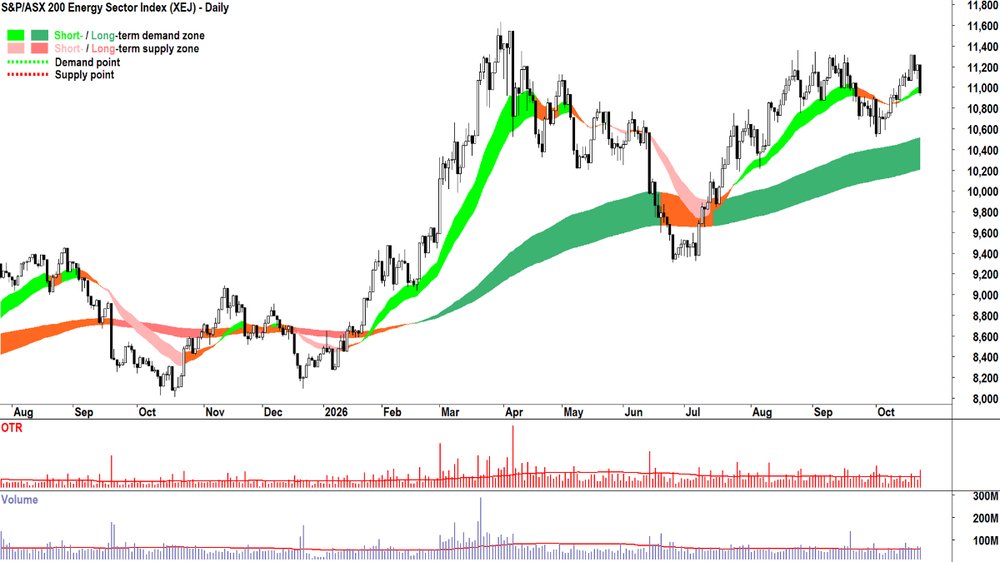
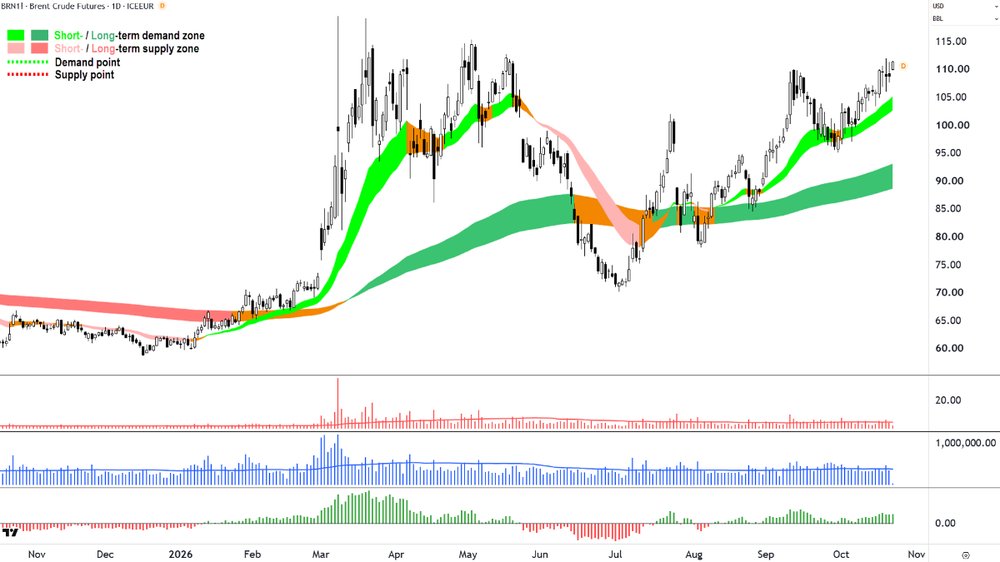
S&P-ASX 200 Energy Sector Index (XEJ) intraday chart (top) was looking the goods just three candles ago... Brent Crude Oil Futures (Front month, back-adjusted) ICE chart (bottom) still nudging cycle highs!
Today's best ASX Top 300 gainers
Company | Last Price | Change $ | Change % | 1mo % | 1yr % |
|---|---|---|---|---|---|
| Heartland Group Holdings (HGH) | $1.105 | +$0.08 | +7.8% | +8.3% | +17.6% |
| NEXTDC (NXT) | $5.75 | +$0.40 | +7.5% | -47.6% | -64.1% |
| Tuas (TUA) | $1.85 | +$0.11 | +6.3% | -19.9% | -72.7% |
| Smartgroup Corporation (SIQ) | $12.25 | +$0.63 | +5.4% | +5.1% | +48.8% |
| SiteMinder (SDR) | $2.82 | +$0.13 | +4.8% | +3.7% | -60.9% |
| Australian Agricultural Company (AAC) | $1.35 | +$0.06 | +4.7% | +3.1% | -4.9% |
| Pro Medicus (PME) | $193.42 | +$8.59 | +4.6% | +16.8% | -32.0% |
| Megaport (MP1) | $16.89 | +$0.71 | +4.4% | -10.4% | +16.2% |
| The Star Entertainment Group (SGR) | $0.125 | +$0.005 | +4.2% | -19.4% | +35.9% |
| Mercury NZ (MCY) | $5.58 | +$0.22 | +4.1% | +1.5% | -4.0% |
| IPH (IPH) | $3.64 | +$0.14 | +4.0% | +8.7% | +3.4% |
| Wagners Holding Company (WGN) | $4.81 | +$0.17 | +3.7% | +12.6% | +82.9% |
| Meridian Energy (MEZ) | $4.59 | +$0.16 | +3.6% | +2.7% | -13.2% |
| Digico Infrastructure REIT (DGT) | $2.00 | +$0.065 | +3.4% | -19.4% | -29.6% |
| Benz Mining Corp (BNZ) | $4.32 | +$0.14 | +3.3% | -12.0% | +168.3% |
| Brambles (BXB) | $21.23 | +$0.65 | +3.2% | +15.3% | -14.1% |
| McMillan Shakespeare (MMS) | $19.29 | +$0.59 | +3.2% | -1.7% | +10.5% |
| Wisetech Global (WTC) | $41.00 | +$1.23 | +3.1% | +29.1% | -51.4% |
| Macquarie Technology Group (MAQ) | $46.57 | +$1.37 | +3.0% | -10.2% | -29.2% |
| Ingenia Communities Group (INA) | $4.71 | +$0.13 | +2.8% | +8.3% | -16.9% |
Today's worst ASX Top 300 losers
Company | Last Price | Change $ | Change % | 1mo % | 1yr % |
|---|---|---|---|---|---|
| Nick Scali (NCK) | $12.03 | -$2.18 | -15.3% | -16.2% | -45.0% |
| Magellan Financial Group (MFG) | $7.70 | -$0.81 | -9.5% | -8.7% | -28.0% |
| Codan (CDA) | $56.53 | -$4.97 | -8.1% | +13.0% | +64.8% |
| MA Financial Group (MAF) | $4.43 | -$0.37 | -7.7% | -10.3% | -50.8% |
| Forrestania Resources (FRS) | $0.325 | -$0.025 | -7.1% | -1.5% | +44.4% |
| Telix Pharmaceuticals (TLX) | $13.66 | -$0.86 | -5.9% | -13.3% | -18.7% |
| Viva Energy Group (VEA) | $2.89 | -$0.15 | -4.9% | -9.1% | +66.1% |
| Fortescue (FMG) | $14.57 | -$0.69 | -4.5% | -12.9% | -28.4% |
| Metals X (MLX) | $1.62 | -$0.075 | -4.4% | -23.6% | +92.9% |
| Regis Resources (RRL) | $6.38 | -$0.29 | -4.3% | -17.8% | +6.7% |
| Southern Cross Electrical Engineering (SXE) | $3.79 | -$0.16 | -4.1% | -17.2% | +62.0% |
| Zimplats Holdings (ZIM) | $13.00 | -$0.53 | -3.9% | -15.0% | -30.7% |
| Capstone Copper Corp. (CSC) | $11.66 | -$0.47 | -3.9% | -19.9% | -4.8% |
| Guzman Y Gomez (GYG) | $25.50 | -$1.00 | -3.8% | 0.0% | +2.0% |
| NRW Holdings (NWH) | $6.32 | -$0.24 | -3.7% | -21.1% | +31.1% |
| Vault Minerals (VAU) | $5.57 | -$0.21 | -3.6% | -11.2% | +23.3% |
| Lycopodium (LYL) | $20.79 | -$0.78 | -3.6% | -10.3% | +69.0% |
| Woodside Energy Group (WDS) | $32.77 | -$1.19 | -3.5% | +1.0% | +41.4% |
| Navigator Global Investments (NGI) | $2.05 | -$0.07 | -3.3% | -14.6% | -6.5% |
| Genesis Minerals (GMD) | $6.68 | -$0.22 | -3.2% | -11.5% | +12.6% |
Chartwatch
Nasdaq Composite Index
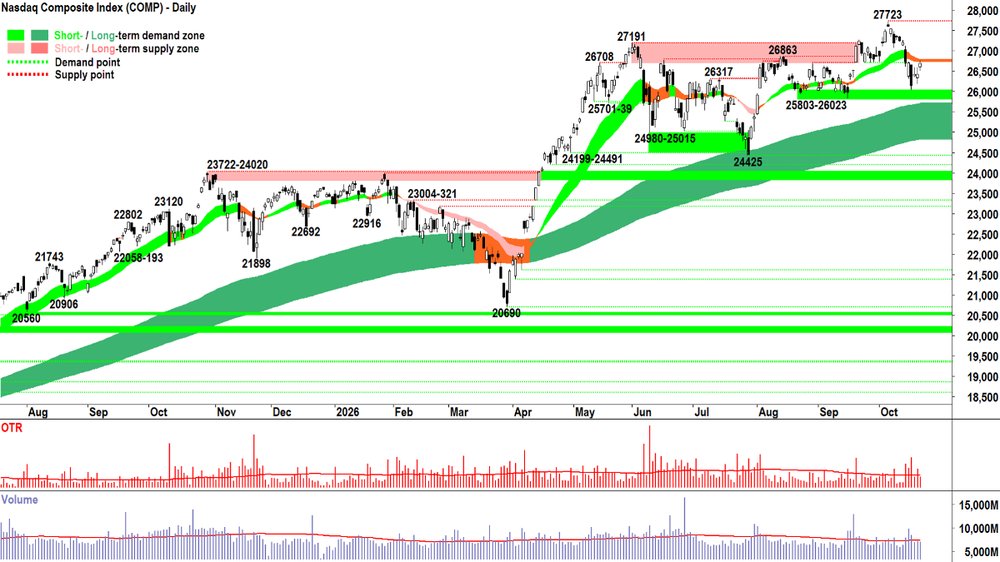
Nasdaq Composite Index chart
Analysis
A very decent performance from the Comp on Wednesday, closing back above Friday's wipeout major supply side candle.
"Major wipeout supply side candle"? ⚠️
Next three candles are white, recouping its loss...? 🤔
Yep, that's about par for the course on the Comp! 💪
But as typical as shrugging off a major sell signal might be for this almighty index, it remains a long way from "clear cut demand side control". For that, I'd still need to see:
Close back above the short term trend ribbon + short term trend ribbon rising / green + short term trend ribbon demonstrating that its acting as a zone of dynamic demand
Rising peaks and rising troughs (i.e., evidence of HOFU = rising peaks + BTD = rising troughs)
Predominance of demand side candles (i.e., pervasive programmed buy orders and intraday BTD & HOFU)
Clear cut demand side control = +RP. Makes sense, right? 🤔
But there's another item that I feel requires addressing THIS TIME...
Before I +RP, I'd also prefer some degree of confirmation that the RUT isn't about to fall off a cliff... which looking at the below chart... remains a distinct possibility!
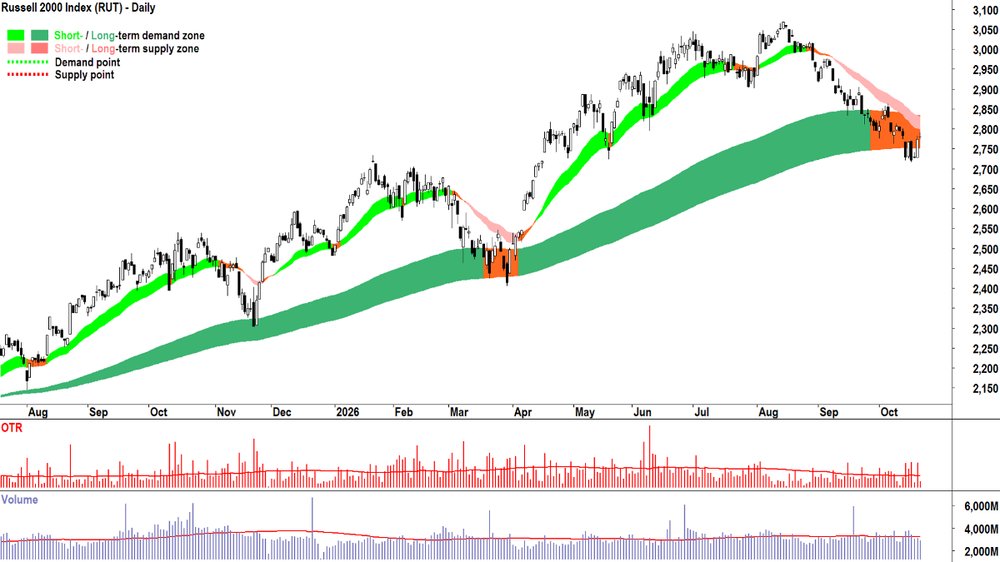
Russell 2000 chart
The RUT represents the heart of corporate America. It is the coalface of the US economy. And if we believe (well, I do!) that a country's stock market is a reflection of the health of its economy... then some caution here is likely required.
View
I am 1/2RP on US stocks (RP = Risk Position – it reflects my personal allowable capital allocation limit for my investments in US stocks. So 1/2RP is 50%, 2/3RP is 67% and FRP is 100%).
Key Levels
27723 is the closest key point of supply, but the short term trend ribbon will also likely act as a dynamic zone of supply (presently 26733-26808). 25803-910 as the closest key zone of demand.
S&P/ASX 200 (XJO)
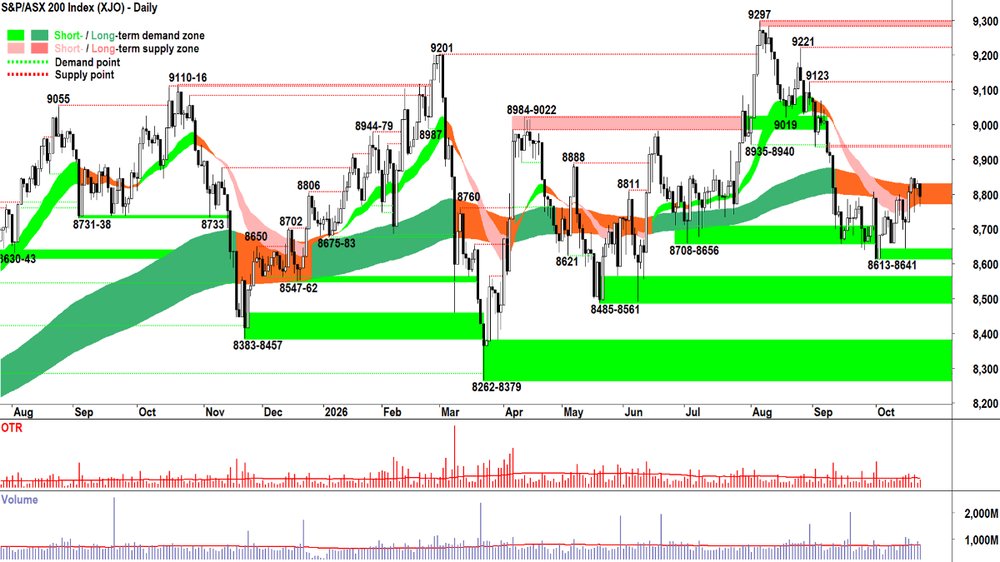
S&P/ASX 200 (XJO) chart
Analysis
Still treading water. But that's probably not a bad thing. We've had a few chances to sell off (and stay off) over the last several sessions — but the demand side has bought the dip to some degree each time.
= Today's session could have been better, but it also could have been worse. Given all the bad stuff going on in the world of financial markets (and I am seeing a truckload of "bad stuff" — you'll have to tune into Wednesday's webinar for my whip around the grounds to find out what! 📺) — I think not going down and staying down is a win.
Still, is just okay (um, mediocre?) enough to warrant adding risk? Half the market up while the other half is down? 🤔
Not for me, and I expect you want something more, too.
So, copy and paste from yesterday (i.e., still 100% relevant):
8935-8940 is the key level to the upside. Obviously the OTP must clear the trend ribbons first… But a few strong demand side candles between here and 8935-8940 should spark some FOMO and HOFU.
8613-8641 is the key demand zone. As long as it holds, bumping around the trend ribbons is probably our worst case scenario.
View
I am 1/3RP on Australian shares (i.e., 67% cash vs 33% invested, with some of the invested portion allocated to shorts).
Key Levels
8935-8940 is the closest zone of supply vs 8613-8641 is the critical zone of demand.
(Glossary of acronyms! Old Tin Pot (OTP): S&P/ASX 200 | MOTN: More Often Than Not | FOMO: Fear Of Missing Out | HOFU: Holding On For Upside | BTD: Buy The Dip | NUTE: No Urgency To Enter | FOHO: Fear Of Holding On | STR: Sell The Rally | RP: Risk Position | FFS: Fund Flow Shenanigans!)
ChartWatch LIVE Webinars – WEEKLY Wednesday's @ 12pm AEDT
Learn more about technical analysis and trend following through real case studies on ASX stocks. Australia's premier technical analyst, Carl Capolingua, shares his unique insights on stocks as requested by viewers. Ask about a company in your portfolio or anything related to trading and investing and get Carl's expert opinion.
Places are limited so >REGISTER NOW!<
Economy
TODAY
THURSDAY
No major economic announcements scheduled for Wednesday
LATER THIS WEEK
FRIDAY
09:00 AUS Flash October Purchasing Managers Index ("PMI")
Manufacturing: no forecast available vs 49.6 previous (revised up from 49.3)
Services: no forecast available vs 51.9 previous (revised up from 51.4)
SATURDAY
09:00 USA Flash October PMI's
Manufacturing: 55.5 forecast vs 55.9 previous (revised down from 57.0)
Services: 58.0 forecast vs 58.8 previous (revised up from 58.7)
Interesting Movers
Trading higher
- Corporate Travel Management (CTD) $3.82+16.1%
No news. Continued positive response to Tuesday's news that the IATA has released the $65 million security guarantee provided by CTM and restored the company’s previous settlement cycles (was up 23% Tuesday and 7.5% yesterday! 🚀).
- Bapcor (BAP) $0.88+13.6%
Issued a trading update & outlook at its AGM held today. Management reaffirmed the company's FY27 outlook. The Q1 turnaround initiatives are gaining traction — Total Trade parts sales +2.5% (like‑for‑like +1.6%), Networks sales +4.1%, Group like‑for‑like sales +0.5%. Gross margin percentage is improving and net debt is on track to fall by $19 million to $116 million.
- Garda Diversified Property Fund (GDF) $1.14+11.2%
Announced sale of its property portfolio — a Charter Hall-managed fund will acquire Garda’s seven remaining investment properties for $300 million. Combined with earlier sales of Heathwood and Pinkenba for $50.8m, gross sale proceeds of $350.8m will repay all existing debt and retain $176.6m cash. Surplus capital likely to be allocated to lending activities.
- AVITA Medical, Inc. (AVH) $4.36+9.3%
No news. Added to yesterday's 5.5% gain which followed the company's announcement of the timing of its September quarter results (November 6). AVH is a regular in the ChartWatch ASX Scans Uptrends List. 📈
- NEXTDC (NXT) $5.75+7.5%
No news. Rebounded from yesterday's 42% wipeout. Consider that 7% of the 58% remaining is a drop in the ocean compared to the 42% slashed off the original 100%! 🤓
- Healius (HLS) $0.41+5.1%
Issued a trading update at its AGM held today. Management reaffirmed FY2027 EBIT guidance. Pathology revenue Q1 FY2027 up 1.6% despite a 4.9% decrease in episode volumes, like‑for‑like episode volumes up 1.1%. Strong revenue growth in hospitals and higher‑value segments. Average fee up 6.0% vs labour costs down 1.4% and total costs down 0.5%. On completion of the sale of Agilex Biolabs, Healius will be in a net cash position.
- Brambles (BXB) $21.37+3.8%
Reaffirmed full-year guidance despite US pallet repair issues adding costs; generating strong free cash flow and on track for sales revenue growth of 2–4% and underlying profit growth of 2–6% (increased US repair capacity, added 40 repair benches).
Trading Lower
- Nick Scali (NCK) $12.03-15.3%
Shares plunged more than 16% after warning net profit for the six months to December will fall sharply due to challenging retail conditions; expects net profit of $28–32m (down from $41m) and written sale orders 15% below prior corresponding period.
- Orthocell (OCC) $0.53-12.5%
Reported September quarter activities. Revenue up 19% y/y to $3.6 million but down 7% on the June quarter. Normalised operating cash used was $3.9 million for the quarter vs $3.6 million in the June quarter. OCC is a regular in the ChartWatch ASX Scans Downtrends List. 📉
- Coronado Global Resources Inc (CRN) $0.16-11.1%
Reported September quarter activities. Sales up 2% q/q to 3.6Mt, but port congestion left ~630Kt stockpiled at port and delayed vessels tied to ~US$50M of revenue expected to be realised in Q4 2026. Revised 2026 guidance sees cut to saleable production to 14.0–14.5Mt (prev. 16–17Mt) and raised mining cash costs rising to $105–110/t (prev. $88–96/t).
- Magellan Financial Group (MFG) $7.70-9.5%
Issued a trading update at its AGM held today. Financial Markets revenue was materially lower in Q1; AUM down 8% to $38.0 billion (impacted by higher bond yields and outflows). Corporate finance activity remains strong, however, and integration with Barrenjoey on track and synergies upgraded from $6m to $15m pa, flowing through in FY28.
- Fortescue (FMG) $14.61-4.3%
Warned China’s negotiating tactics to drive down iron ore prices could affect operations after China Mineral Resources Group reportedly ordered mills to reject some Fortescue product; costs up on higher diesel and shipped about 4m tonnes more than it could sell; said operations may be affected if CMRG negotiations aren’t concluded by year-end.
- Mirvac Group (MGR) $1.78-2.2%
Said residential sales fell almost one-third in the Sept quarter (429 vs 619) as higher borrowing costs and tax changes hit activity; described FY27 residential operating environment as challenging with slowdown in sales and enquiries.
Broker Moves
Company | Broker | Action | Rating | Price Target |
|---|---|---|---|---|
29M29Metals | Canaccord Genuity | Retained | Buy | $0.40 |
| Morgans | Upgraded | Accumulate(from Hold) | $0.35 | |
ABBAussie Broadband | Citi | Retained | Neutral | $5.45 |
AISAeris Resources | Canaccord Genuity | Retained | Buy | $0.75 |
ALXAtlas Arteria | Morgans | Retained | Hold | $3.37(from $4.74) |
AMPAMP | Citi | Retained | Buy | $2.60 |
ARBARB Corporation | Citi | Retained | Neutral | $22.50 |
BGABega Cheese | Bell Potter | Retained | Buy | $8.05 |
BGLBellevue Gold | Ord Minnett | Retained | Buy | $2.00 |
BLXBeacon Lighting Group | Bell Potter | Retained | Buy | $2.20(from $2.35) |
BPTBeach Energy | Bell Potter | Retained | Hold | $1.00(from $0.95) |
| Macquarie | Retained | Neutral | $0.93 | |
BXBBrambles | Citi | Retained | Buy | $22.75 |
| Macquarie | Retained | Neutral | $19.00 | |
CBECobre | Canaccord Genuity | Retained | Buy | $0.50 |
CSLCSL | Macquarie | Retained | Neutral | $174.00 |
CTDCorporate Travel Management | Morgan Stanley | Retained | Equal Weight | $3.20(from $2.60) |
CUVClinuvel Pharmaceuticals | Morgans | Downgraded | Trim(from Hold) | $7.00(from $10.00) |
EBOEBOS Group | Morgans | Retained | Buy | $22.93 |
| Ord Minnett | Retained | Buy | $25.00(from $26.00) | |
FHEFrontier Energy | Bell Potter | Retained | Speculative Buy | $0.34(from $0.30) |
| Ord Minnett | Retained | Speculative Buy | $0.37(from $0.34) | |
GDGGeneration Development Group | Citi | Retained | Buy | $5.00 |
GMDGenesis Minerals | Citi | Retained | Buy | $8.90 |
GWAGWA Group | Macquarie | Retained | Neutral | $1.85(from $2.30) |
HUBHUB24 | Morgans | Upgraded | Buy(from Accumulate) | $86.00(from $92.00) |
KLSKelsian Group | Macquarie | Upgraded | Outperform(from Neutral) | $5.50(from $3.20) |
LNQLinQ Minerals | Bell Potter | Retained | Speculative Buy | $0.90 |
MAFMA Financial Group | Ord Minnett | Retained | Buy | $8.70(from $9.15) |
| UBS | Retained | Buy | $8.90 | |
MGRMirvac Group | Macquarie | Retained | Outperform | $2.20 |
MQGMacquarie Group | Morgan Stanley | Retained | Overweight | $273.00 |
NCKNick Scali | Citi | Downgraded | Sell(from Neutral) | $13.25(from $17.25) |
| Macquarie | Retained | Outperform | $15.20(from $17.70) | |
NICNickel Industries | Macquarie | Retained | Outperform | $1.20 |
NSTNorthern Star Resources | Canaccord Genuity | Retained | Hold | $26.20(from $25.85) |
| Jarden | Upgraded | Neutral(from Underweight) | $24.00(from $24.20) | |
| Macquarie | Retained | Neutral | $25.00 | |
| Morgans | Retained | Hold | $25.00 | |
| Ord Minnett | Retained | Accumulate | $29.30(from $29.10) | |
| UBS | Retained | Buy | $31.10(from $31.15) | |
NWLNetwealth Group | Citi | Retained | Buy | $24.50 |
NXTNEXTDC | Macquarie | Retained | Outperform | $12.90(from $19.70) |
| Morgans | Upgraded | Buy(from Hold) | $7.50(from $15.00) | |
| Ord Minnett | Retained | Buy | $12.00(from $22.50) | |
| UBS | Retained | Buy | $23.45 | |
ORIOrica | Macquarie | Retained | Outperform | $26.10(from $25.86) |
PPTPerpetual | Citi | Retained | Neutral | $16.80(from $17.50) |
RRLRegis Resources | Bell Potter | Retained | Buy | $9.00(from $9.35) |
SIGSigma Healthcare | Macquarie | Retained | Outperform | $3.10 |
| Morgans | Retained | Buy | $3.19 | |
| Ord Minnett | Retained | Buy | $3.20(from $3.40) | |
SKYSky Metals | Shaw and Partners | Initiated | Buy | $0.36 |
SSMService Stream | Ord Minnett | Retained | Buy | $2.87(from $2.93) |
STOSantos | Macquarie | Retained | Outperform | $9.55 |
TCLTransurban Group | Citi | Retained | Neutral | $14.70 |
| Morgan Stanley | Retained | Equal Weight | $13.88 | |
| Ord Minnett | Retained | Accumulate | $14.00(from $13.90) | |
| UBS | Retained | Neutral | $14.30(from $14.40) | |
TLXTelix Pharmaceuticals | UBS | Retained | Buy | $26.00 |
TPWTemple & Webster Group | Citi | Retained | Neutral | $4.35 |
VEEVeem | Ord Minnett | Retained | Accumulate | $0.85 |
VSLVulcan Steel | UBS | Retained | Buy | $6.40(from $7.00) |
WDSWoodside Energy Group | Citi | Retained | Neutral | $32.90 |
| Morgan Stanley | Retained | Equal Weight | $32.00 | |
| Ord Minnett | Retained | Hold | $29.75(from $29.25) | |
| UBS | Retained | Neutral | $31.30(from $31.10) | |
WGXWestgold Resources | Macquarie | Retained | Outperform | $6.80 |
| Ord Minnett | Upgraded | Buy(from Accumulate) | $7.40(from $7.50) | |
| UBS | Retained | Buy | $9.25 | |
XROXero | UBS | Retained | Buy | $106.00(from $121.00) |
Scans
Top Gainers
Code | Company | Last | % Chg |
|---|---|---|---|
| RGT | Argent Biopharma Ltd | $0.034 | +25.93% |
| EXR | Elixir Energy Ltd | $0.069 | +25.46% |
| RIE | Riedel Resources Ltd | $0.021 | +23.53% |
| RWL | Rubicon Water Ltd | $0.27 | +22.73% |
| CMD | Cassius Mining Ltd | $0.017 | +21.43% |
Top Fallers
Code | Company | Last | % Chg |
|---|---|---|---|
| PFT | Pure Foods Tasmania Ltd | $0.017 | -26.09% |
| BVR | Bellavista Resources Ltd | $0.225 | -22.41% |
| EGY | Energy Technologies Ltd | $0.036 | -21.74% |
| PMM | Pioneer Minerals Ltd | $0.225 | -19.64% |
| PL3 | Patagonia Lithium Ltd | $0.08 | -15.79% |
52 Week Highs
Code | Company | Last | % Chg |
|---|---|---|---|
| CTD | Corporate Travel Management Ltd | $3.82 | +16.11% |
| WZR | Wisr Ltd | $0.035 | +9.38% |
| AVH | Avita Medical Inc | $4.36 | +9.27% |
| DSM | Desert Minerals Ltd | $0.80 | +3.90% |
| PWER | First Sentier GLB Listed Infra FD HDGD Active ETF | $1.24 | +3.33% |
52 Week Lows
Code | Company | Last | % Chg |
|---|---|---|---|
| BVR | Bellavista Resources Ltd | $0.225 | -22.41% |
| NCK | Nick Scali Ltd | $12.03 | -15.34% |
| VBS | Vectus Biosystems Ltd | $0.09 | -14.29% |
| VNL | Vinyl Group Ltd | $0.03 | -14.29% |
| WMC | Wiluna Mining Corporation Ltd | $0.56 | -13.85% |
Near Highs
Code | Company | Last | % Chg |
|---|---|---|---|
| PCI | Perpetual Credit Income Trust | $1.075 | -0.46% |
| WVOL | iShares MSCI World Ex Aust Minimum Volatility ETF | $47.16 | +0.17% |
| IAGPF | Insurance Australia Group Ltd | $105.88 | +0.10% |
| GCI | Gryphon Capital Income Trust | $2.02 | +0.50% |
| VVLU | Vanguard Global Value Equity Active ETF | $81.33 | -1.00% |
Relative Strength Index (RSI) Oversold
Code | Company | Last | % Chg |
|---|---|---|---|
| RAC | Racura Oncology Ltd | $1.56 | 0.00% |
| FFM | Firefly Metals Ltd | $1.35 | +0.75% |
| CSC | Capstone Copper Corp | $11.66 | -3.88% |
| BRN | Brainchip Holdings Ltd | $0.11 | -4.35% |
| TLG | Talga Group Ltd | $0.205 | 0.00% |