
The ASX 200 finished fractionally higher as investors rotated out of defensives and back into beaten-down miners (albeit with little help from commodity prices!) Gold miners, rare earths and uranium stocks led, while property, banks and consumer discretionary stocks lagged.
Be sure to click/scroll through for the usual reporting of the major sector and stock-specific moves, the broker responses to them, as well as all the key economic data in tonight's Evening Wrap. Also, I have detailed technical analysis on the Nasdaq Composite and the S&P/ASX 200 in today's ChartWatch.
Let’s dive in!
Today in Review
Name | Value | % Chg |
|---|---|---|
Major Indices | ||
| ASX 200 | 9,029.7 | +0.10% |
| All Ords | 9,163.4 | +0.20% |
| Small Ords | 3,231.1 | +0.99% |
| All Tech | 3,026.8 | +0.47% |
| Emerging Companies | 2,805.4 | +2.34% |
Currency | ||
| AUD/USD | 0.689 | +0.35% |
US Futures | ||
| S&P 500 | 7,432.5 | +0.41% |
| Dow Jones | 51,740.0 | +0.69% |
| Nasdaq | 27,133.5 | +0.18% |
Name | Value | % Chg |
|---|---|---|
Sector | ||
| Materials | 23,254.8 | +2.88% |
| Information Technology | 1,799.2 | +0.88% |
| Energy | 10,308.0 | +0.72% |
| Consumer Staples | 13,797.0 | -0.12% |
| Utilities | 10,658.8 | -0.14% |
| Health Care | 35,092.2 | -0.47% |
| Industrials | 8,362.2 | -0.70% |
| Communication Services | 1,640.1 | -1.00% |
| Financials | 9,699.5 | -1.11% |
| Consumer Discretionary | 3,784.9 | -1.11% |
| Real Estate | 3,447.5 | -1.32% |
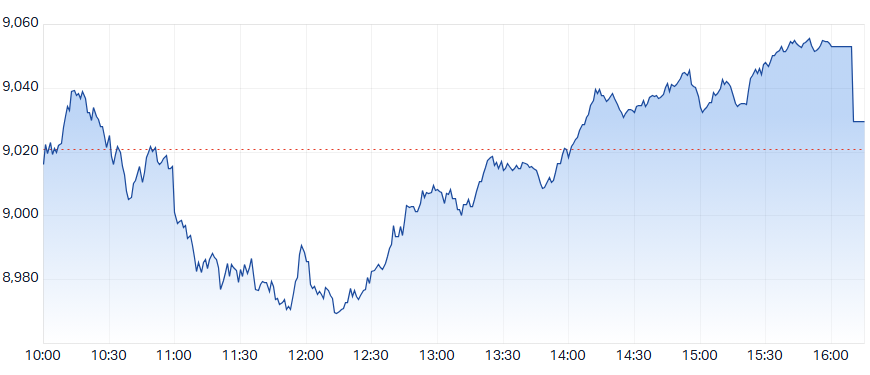
ASX 200 Intraday Chart
Markets
The S&P/ASX 200 (XJO) finished 8.9 points higher at 9,029.7, 0.7% from its session low and 0.3% from its high. In the broader-based S&P/ASX 300 (XKO) advancers snuck past decliners by a narrow 143 to 140.
The Gold Sub-Index (XGD) (+4.2%) was the standout today, and the one corner of mining where the commodity genuinely backed share price moves. COMEX gold futures rose 1.4% to US$4,413.0/oz and COMEX silver futures rose 1.6% to US$52.78/oz in Asian trade. Black Cat Syndicate (BC8) (+8.9%) and Catalyst Metals (CYL) (+8.8%) led the charge. Genesis Minerals (GMD) (+6.4%) and Ora Banda Mining (OBM) (+6.3%) also rallied.
Materials (XMJ) (+2.9%) was the engine room of a classic rob-Peter-to-pay-Paul session, as money pulled from banks and defensives flowed back into miners. A modest recovery in the AI trade on Wall Street on Friday revived stocks sold off last week on fears an AI infrastructure slowdown would hit copper. But investors must ask the awkward question: outside of gold, and a small gain in rare earths prices, commodities prices didn’t back today's move.
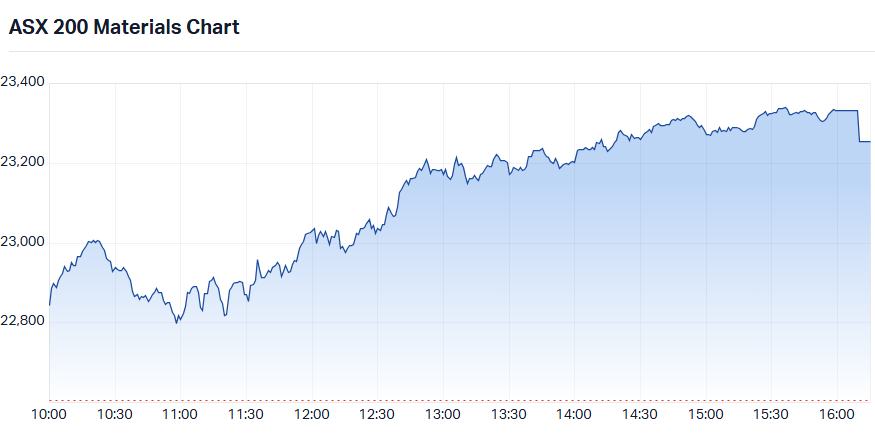
S&P/ASX 200 Materials Sector Index (XMJ) intraday chart
Base metals stocks were the clearest example. Aluminium, copper, tin and zinc all fell sharply on the London Metal Exchange on Friday, down 1.4%, 1.1%, 3.7% and 3% respectively, though COMEX copper futures rose 1.8% to US$6.35/lb in the Asian session. Sandfire Resources (SFR) (+5.7%) and IGO (IGO) (+4.8%) led. South32 (S32) (+3.4%) rallied.
The big diversified miners did the heavy lifting for the index, even with SGX iron ore futures barely moving, up 0.1% to US$92.75/t. BHP Group (BHP) (+2.7%) and Rio Tinto (RIO) (+1.6%) were likely helped by their copper exposure. Mineral Resources (MIN) (+4.8%) outpaced both.
Rare earths stocks also surged, with NdPr prices in China up just 0.3% to CNY 707,000/t, a gain that hardly explains the size of the moves in Lynas Rare Earths (LYC) (+6.8%) and Iluka Resources (ILU) (+4.6%).
Lithium stocks were the most glaring disconnect. GFEX lithium carbonate futures in China slumped 4.8% to CNY 88,400/t, yet investors piled into beaten-down energy transition plays regardless. Core Lithium (CXO) (+8.7%) and Elevra Lithium (ELV) (+7.2%) led. Liontown (LTR) (+4.7%) and Vulcan Energy Resources (VUL) (+2.7%) followed, while PLS Group (PLS) (+2.1%) also firmed.
Information Technology (XIJ) (+0.9%) took its lead from Friday’s rebound in the Nasdaq, as dip buyers returned to US tech. SiteMinder (SDR) (+4.4%) and Codan (CDA) (+2.9%) led, the latter after announcing the $244 million acquisition of US-based Eventide Communications. Catapult Sports (CAT) (+2.2%) and WiseTech Global (WTC) (+1.8%) also gained, while Megaport (MP1) (+1.6%) rounded out the winners.
Energy (XEJ) (+0.7%) also rose despite weaker commodity leads, with the gains concentrated in uranium and coal. Uranium stocks surged as investors hunted beaten-down AI and energy transition plays, likely tracking their US counterparts after the Sprott Uranium Miners ETF (URNM) rose 3% in New York on Friday. Paladin Energy (PDN) (+10.9%) and Boss Energy (BOE) (+10.7%) led. Deep Yellow (DYL) (+10.6%) and NexGen Energy (NXG) (+7.3%) followed, while Bannerman Energy (BMN) (+5.7%) also rallied. COMEX uranium futures were steady, down 0.1% to US$91.75/lb.
Coal stocks gained even as prices fell, with globalCoal Newcastle coal futures down 2.8% to US$142/t and SGX Australian premium coking coal futures down 1.1% to US$255/t. Yancoal Australia (YAL) (+2.7%) and Whitehaven Coal (WHC) (+2.3%) led. New Hope Corporation (NHC) (+1.9%) also rose.
Oil and gas stocks were mixed as ICE Brent crude futures fell 1.0% to US$97.38/bbl. Santos (STO) (+0.7%) led the majors, while Woodside Energy Group (WDS) (-0.1%) slipped.
A-REIT (XPJ) (-1.3%) was the worst-performing sector as higher bond yields, after a stronger-than-expected US non-farm payrolls report, weighed on rate-sensitive stocks. Property trusts are bond proxies, prized for steady income, so rising bond yields make them relatively less attractive. The selling also unwound some of last week’s rally on hopes Australian rates had peaked.
Lendlease Group (LLC) (-5.4%) was the heaviest drag after terminating its Milan project sale, forgoing $90 million in anticipated proceeds. Scentre Group (SCG) (-4.4%), a landlord to the collapsed David Jones, also slid. Stockland (SGP) (-3.5%) and GPT Group (GPT) (-3.5%) also fell sharply.
Consumer Discretionary (XDJ) (-1.1%) was also caught by higher bond yields. Cettire (CTT) (-7.9%) and Eagers Automotive (APE) (-5.0%) led the declines. Myer Holdings (MYR) (-4.0%) and Nick Scali (NCK) (-3.0%) also fell.
Financials (XFJ) (-1.1%) were hit by higher yields and a stumbling bank reporting season, with bad debts creeping higher. ANZ Group Holdings (ANZ) (-3.2%) was the heaviest drag despite a 23% jump in full-year net profit, and the pullback likely pushed capital out of banks and towards resources. National Australia Bank (NAB) (-1.4%), which disappointed last week, also fell after appointing a new chairman.
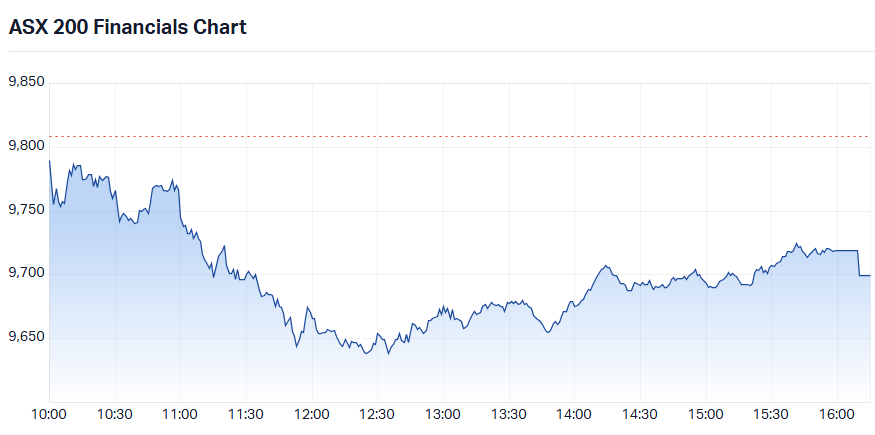
S&P/ASX 200 Financials Sector Index (XFJ) intraday chart
The regional lenders fared worse, with Bendigo and Adelaide Bank (BEN) (-2.1%) and Bank of Queensland (BOQ) (-1.7%) lower. Insurer QBE Insurance Group (QBE) (-1.6%) also retreated.
Communication Services (XTJ) (-1.0%) lacked support in the risk-on environment, with utility-like telcos reversing some of their recent strength. Superloop (SLC) (-2.5%) and Chorus (CNU) (-2.2%) led the declines. TPG Telecom (TPG) (-1.5%) and Telstra Group (TLS) (-1.0%) also slipped.
Health Care (XHJ) (-0.5%) pulled back from recent highs as defensives fell out of favour. Cochlear (COH) (-2.2%) was the biggest drag. Sonic Healthcare (SHL) (-1.4%) and ResMed (RMD) (-1.4%) also fell. CSL (CSL) (-0.6%) edged lower.
Today's best ASX Top 300 gainers
Company | Last Price | Change $ | Change % | 1mo % | 1yr % |
|---|---|---|---|---|---|
| Silex Systems (SLX) | $3.33 | +$0.36 | +12.1% | -21.5% | -61.6% |
| Paladin Energy (PDN) | $8.27 | +$0.81 | +10.9% | -5.1% | +6.4% |
| Brightstar Resources (BTR) | $0.68 | +$0.065 | +10.6% | +5.4% | +54.5% |
| Benz Mining Corp (BNZ) | $4.52 | +$0.42 | +10.2% | -0.9% | +206.4% |
| The Star Entertainment Group (SGR) | $0.17 | +$0.015 | +9.7% | +36.0% | +100.0% |
| EQ Resources (EQR) | $0.305 | +$0.025 | +8.9% | -9.0% | +626.2% |
| Catalyst Metals (CYL) | $4.44 | +$0.36 | +8.8% | -18.8% | -36.8% |
| Sunrise Energy Metals (SRL) | $12.59 | +$1.01 | +8.7% | -34.7% | +184.2% |
| Core Lithium (CXO) | $0.25 | +$0.02 | +8.7% | -5.7% | +72.4% |
| Minerals 260 (MI6) | $0.81 | +$0.06 | +8.0% | -3.0% | +170.0% |
| FireFly Metals (FFM) | $1.425 | +$0.105 | +8.0% | -12.0% | -9.9% |
| NexGen Energy (Canada) (NXG) | $12.23 | +$0.83 | +7.3% | -4.2% | -3.5% |
| Alkane Resources (ALK) | $1.85 | +$0.125 | +7.2% | +2.5% | +83.2% |
| Pantoro Gold (PNR) | $3.28 | +$0.22 | +7.2% | +10.1% | -32.4% |
| James Hardie Industries Plc (JHX) | $41.89 | +$2.69 | +6.9% | +19.7% | +60.4% |
| Lynas Rare Earths (LYC) | $13.15 | +$0.84 | +6.8% | +6.0% | -2.7% |
| Electro Optic Systems Holdings (EOS) | $7.48 | +$0.46 | +6.6% | -29.3% | +47.8% |
| Genesis Minerals (GMD) | $7.49 | +$0.45 | +6.4% | +5.6% | +27.4% |
| Ora Banda Mining (OBM) | $1.53 | +$0.09 | +6.3% | +7.7% | +34.8% |
| PDI Gold (PDI) | $4.77 | +$0.27 | +6.0% | +6.7% | +80.0% |
Today's worst ASX Top 300 losers
Company | Last Price | Change $ | Change % | 1mo % | 1yr % |
|---|---|---|---|---|---|
| Ventia Services Group (VNT) | $4.80 | -$0.93 | -16.2% | -20.5% | -16.1% |
| Dyno Nobel (DNL) | $3.40 | -$0.42 | -11.0% | -15.8% | +5.9% |
| LendLease Group (LLC) | $2.44 | -$0.14 | -5.4% | -3.2% | -55.2% |
| Eagers Automotive (APE) | $15.41 | -$0.81 | -5.0% | -13.3% | -51.0% |
| Scentre Group (SCG) | $3.45 | -$0.16 | -4.4% | +0.3% | -16.1% |
| Ricegrowers (SGLLV) | $14.63 | -$0.59 | -3.9% | +14.7% | -4.4% |
| Gemlife Communities Group (GLF) | $3.86 | -$0.14 | -3.5% | -13.3% | -26.5% |
| Stockland (SGP) | $4.44 | -$0.16 | -3.5% | +4.7% | -29.0% |
| GPT Group (GPT) | $5.00 | -$0.18 | -3.5% | +11.1% | -9.1% |
| ANZ Group Holdings (ANZ) | $39.05 | -$1.29 | -3.2% | +4.5% | +6.1% |
| Nick Scali (NCK) | $13.78 | -$0.42 | -3.0% | -2.3% | -42.8% |
| Mirvac Group (MGR) | $1.905 | -$0.055 | -2.8% | +5.0% | -16.8% |
| Judo Capital Holdings (JDO) | $0.91 | -$0.025 | -2.7% | +3.4% | -45.2% |
| Helia Group (HLI) | $4.87 | -$0.13 | -2.6% | -6.0% | -8.6% |
| Superloop (SLC) | $2.75 | -$0.07 | -2.5% | +10.0% | -7.7% |
| Liberty Financial Group (LFG) | $3.27 | -$0.08 | -2.4% | +3.8% | -18.7% |
| Downer EDI (DOW) | $6.94 | -$0.16 | -2.3% | +1.0% | -10.5% |
| Chorus (CNU) | $6.52 | -$0.15 | -2.2% | -3.5% | -20.6% |
| Cochlear (COH) | $152.00 | -$3.47 | -2.2% | +17.8% | -46.6% |
| Storage King Group (SKG) | $1.13 | -$0.025 | -2.2% | +5.6% | -19.3% |
Chartwatch
Nasdaq Composite Index
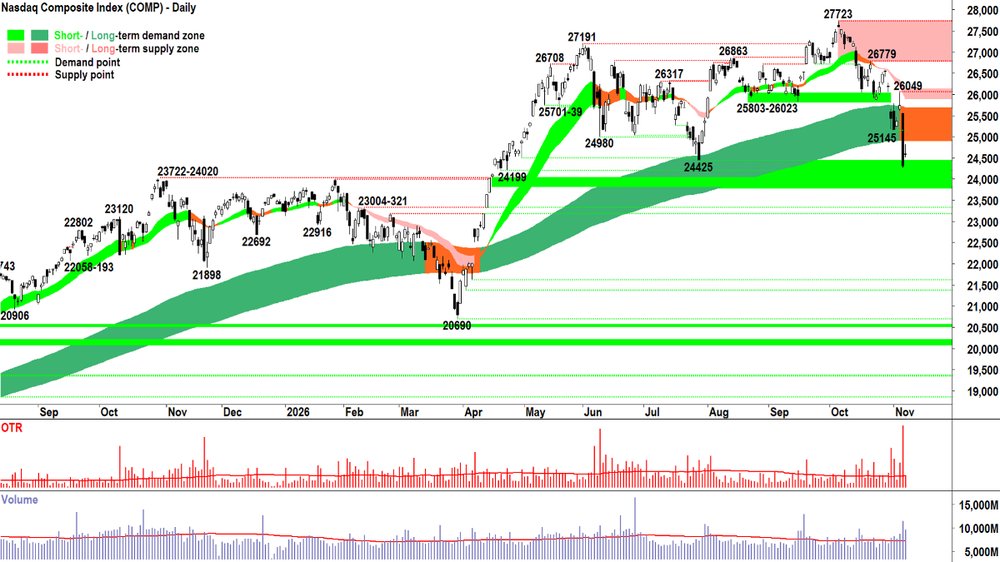
Nasdaq Composite Index chart
Analysis
Media: "US stocks rallied, ASX set to rise Monday".
Technical analyst: "Dead cat bounce in US stocks. OTP unlikely to shoot the lights out come Monday!".
Sure, the Comp was up on Friday, but look at that candle. 🕯️🧐
Upward pointing shadow + Substantial volume.
The buy-the-dippers came in on Friday morning...
And then they copped it.
There was a wall of latent supply waiting in the system to meet them. And by the end of the session, that wall of supply overwhelmed the size and motivation of the demand and pushed price back down again.
= STR = ⚠️
Why does a wall of latent supply exist in the demand-supply environment at higher prices? 🤔
Beats me! 🤷
How the hell should I know! I can't go out and interview every stockholder and ask them why they want to STR. And does it really matter why?
I mean who cares. They just are.
And, ladies and gentlemen, when you finally concede that you'll never know... and that you don't need to know... and when you totally succumb to the belief that D vs S = P is ALL YOU NEED TO KNOW... then investing becomes far easier. 🧘
You'll tell yourself a great deal of:
Who cares why, IT JUST IS... and there ain't anything I can do about it!
And you'll just get on with the business of accepting the present state of D vs S = P and just manage your risk accordingly.
No need to re-do Friday's Analysis checklist — it hasn't changed following Friday's candle — one bit. (Reminder: ⚠️⚠️⚠️⚠️⚠️⚠️)
So our Accept remains: MOTN P ⬇️
View
Which means our Act is simple. Well, mine is, anyway, because you can do whatever you want! I'm at 1/3RP on US stocks (RP = Risk Position – it reflects my personal allowable capital allocation limit for my investments in US stocks. So 1/2RP is 50%, 2/3RP is 67% and FRP is 100%).
Key Levels
The long term trend ribbon is the closest (dynamic) zone of supply (presently 24907-25697) but 26049 is likely the critical go-no-go for the current short term downtrend. There appears to be a substantial zone of potential latent demand between 25900-26134.
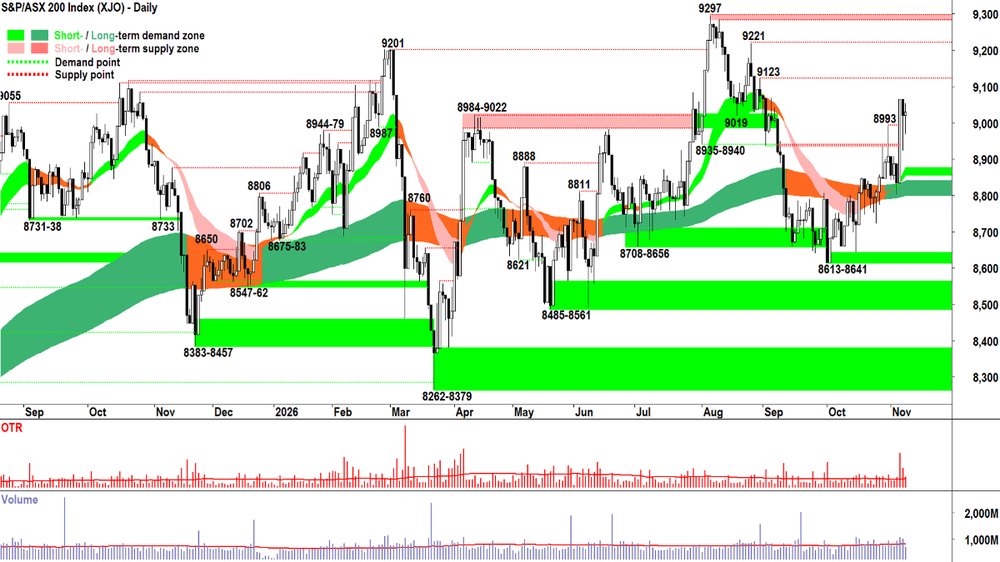
S&P/ASX 200 (XJO)
S&P/ASX 200 (XJO) chart
Analysis
Ironically, the mainstream media ended up being right: The ASX 200 did rise today.
Eventually.
But only after the customary pervasive BTD that we've been observing here for several weeks kicked into gear (Gandalf: You shall not pass! & Austin Powers: Why won't you die! stuff... 😉).
A decent downward pointing shadow on today's candle smacks of BTD. Add:
The short term trend is up ✅
The long term trend is up ✅
The price action is rising peaks and rising troughs ✅
Candles are predominantly demand side in nature ✅
= No change to our current view that the demand-side is in control of the OTP's price.
Does this mean a FRP (full risk position)? 🤔
Nope. Because ultimately, the chart above is a herd of zebras... or trading ranges within trading ranges within... if you will...
You get my drift.
9123 is the next big upside challenge. Then 9221. Then the ATH of 9297.
We can dream! 🙏
Yes, a positive RP skew — but FRP? Not for me, not yet...
View
I am at 2/3RP on Australian shares (i.e., 67% invested vs 33% cash, with some of the invested portion allocated to shorts). Still transitioning from 1/2RP... it may take some time to get there. No rush!
Key Levels
9123-9297 is the closest zone of supply. The short-long term trend ribbons are the closest zone of (dynamic) demand (presently 8899-8876).
(Glossary of acronyms! Old Tin Pot (OTP): S&P/ASX 200 | MOTN: More Often Than Not | FOMO: Fear Of Missing Out | HOFU: Holding On For Upside | BTD: Buy The Dip | NUTE: No Urgency To Enter | FOHO: Fear Of Holding On | STR: Sell The Rally | RP: Risk Position | FFS: Fund Flow Shenanigans!)
***CHARTWATCH LIVE — LITHIUM & COPPER ON ALERT! 🚨📺***
ChartWatch LIVE Webinars – WEEKLY Wednesday's @ 12pm AEDT
Learn more about technical analysis and trend following through real case studies on ASX stocks. Australia's premier technical analyst, Carl Capolingua, shares his unique insights on stocks as requested by viewers. Ask about a company in your portfolio or anything related to trading and investing and get Carl's expert opinion.
Places are limited so >REGISTER NOW!<
Economy
TODAY
CHN October Consumer Price Index (CPI) & Producer Price Index (PPI)
CPI: +0.7% p.a. vs +0.8% p.a. forecast and +0.9% p.a. in September
PPI: +5.7% p.a. vs +5.3% p.a. forecast and +5.0% p.a. in September
Reader: CPI cooler (consistent with weak consumer spending, slowing Chinese economy), but PPI substantially hotter (consistent with pressure on business profits... high energy prices / commodity prices... and most importantly the rule of thumb is: China's producer inflation is exported to the rest of the world... ⚠️)
LATER THIS WEEK
TUESDAY
10:30 AUS Westpac Consumer Sentiment
11:30 AUS NAB Business Confidence
WEDNESDAY
00:30 USA October Core CPI (+0.2% m/m forecast vs +0.3% m/m in September)
THURSDAY
00:00 USA All Day — markets closed for Veterans Day
FRIDAY
02:30 AUS CB Leading Index m/m
05:01 USA 30-year bond auction
SATURDAY
00:30 USA October Core PPI (+0.3% m/m forecast vs +0.7% m/m in September)
Interesting Movers
Trading higher
- Actinogen Medical (ACW) $0.05+17.1%
No news. 🤔 Big candle, big volume, major reversal of recent short term downtrend.
- Andean Silver (ASL) $1.65+16.2%
Reported drilling results from the company's Cerro Bayo project in Chile. Highlight results included:1.7m @ 1,269g/t AgEq (489g/t Ag & 9.4g/t Au) and 1.6m @ 211g/t AgEq (82g/t Ag & 1.6g/t Au). Management said that a broad infill drilling campaign to support conversion and studies was ongoing.
- Great Boulder Resources (GBR) $0.07+14.8%
Reported drilling results from the company's Peak Hill project in WA. Highlight results included: 8m @ 39.9g/t Au from 58m and 4m @ 39.3g/t Au from 30m. Management said that drilling is continuing.
- DUG Technology (DUG) $1.66+14.1%
Announced a software and HPC infrastructure award worth US$33.7 million with a National Oil Company over four years (commencing Nov 2026), ~US$8.4 million per year. Management said that hosted HPC infrastructure is installed and operational.
- Broken Hill Mines (BHM) $0.47+13.3%
Reported drilling results from the company's Rasp Mine (Centenary target) in NSW. Highlight results included: 25.8m @ 11.7% ZnEq, 323g/t AgEq and 17.8m @ 10.1% ZnEq, 280g/t AgEq. Management aims to expedite further drilling in FY27.
- Unico Silver (USL) $0.61+13.0%
No news. Performance reflected general strength in the broader precious metals sector. Gold and silver prices traded higher in Asia today, benchmark silver futures by over 2%.
- Silex Systems (SLX) $3.32+11.8%
No news. Performance reflected general strength in the broader uranium sector. Note, Sprott Uranium Miners ETF (URNM) was 3% higher in New York on Friday (commodity price futures flat).
- Metro Mining (MMI) $0.90+11.1%
Provided an operational update for its Bauxite Hills Mine in Queensland. 752 thousand Wet Metric Tonnes (WMT) of bauxite were shipped in October 2026.
- Codan (CDA) $55.98+2.7%
Announced the acquisition of recording and analytics provider Eventide Communications for US$244 million. The acquisition will add recording, reporting and operational insights to the company's Zetron command-and-control ecosystem. The deal will be funded with cash, partial drawdown of debt facilities, and issuing $11 million in CDA shares to Eventide’s managing director on a deferred basis.
Trading Lower
- Ventia Services Group (VNT) $4.80-16.2%
Issued trading update. Management reaffirmed full‑year underlying profit growth of 7–10% and unveiled a $60 million annual cost‑reduction program to offset a softer second half. Also warned of project deferrals pulling H2 revenue below prior corresponding period and the company will absorb ~ $30m in one‑off implementation and discontinued project costs.
- Dyno Nobel (DNL) $3.40-11.0%
Released its FY26 results. $66 million NPAT vs prior year's $53 million loss. Cash profit was down 22% to $331 million, however, and EBITDA excl. items was down 23% to $778 million. Operating profit fell 29% to $504 million. The DNL board declared a final dividend of 5¢ franked at 50%. Management provided FY27 EBIT guidance $515–$555 million.
- LendLease Group (LLC) $2.44-5.4%
Announced the sale of development rights in Milan’s Milano Santa Giulia project to a Bizzi & Partners‑backed consortium has been terminated. This means LLC will not receive the expected ~ $90 million cash proceeds and may need to fund ~ $160 million in project obligations if an alternative buyer not is finalised by year‑end. Management said that it's pursuing alternative transactions.
- Scentre Group (SCG) $3.45-4.4%
No news. Performance reflected general weakness in the broader real estate sector. Bond yields edged higher on Friday in the US on stronger than expected US employment data. Local benchmark bond yields also higher. Real Estate is seen as a bond proxy sector... means higher yields makes RE sector returns look less attractive.
- ANZ Group Holdings (ANZ) $38.84-3.7%
Reported its FY26 results. Full‑year cash profit $7.59 billion (up 31% vs pcp). The company had reduced staff by 3,500 and cut overall costs by 7%. Net interest margin was flat at 1.53%. The ANZ board declared final dividend of 83¢, unchanged). Management said that core priorities moving forward included integrating Suncorp assets and improving digital front‑end.
Broker Moves
Company | Broker | Action | Rating | Price Target |
|---|---|---|---|---|
AGLAGL Energy | Morgan Stanley | Retained | Underweight | $8.28 |
ANNAnsell | Citi | Retained | Sell | $39.50 |
ANZANZ Group Holdings | Citi | Retained | Buy | $41.00 |
| UBS | Retained | Neutral | $39.00 | |
APEEagers Automotive | UBS | Retained | Neutral | $17.65(from $22.30) |
APZAspen Group | Bell Potter | Retained | Buy | $6.15 |
ARBARB Corporation | Citi | Retained | Neutral | $22.50 |
BHPBHP Group | Morgan Stanley | Retained | Overweight | $68.00 |
| UBS | Retained | Neutral | $62.00 | |
BMCBMC Minerals . | Morgans | Retained | Speculative Buy | $5.49(from $5.70) |
BOEBoss Energy | Morgan Stanley | Retained | Equal Weight | $1.40 |
BRGBreville Group | Citi | Retained | Buy | $40.80 |
CCPCredit Corp Group | Macquarie | Retained | Neutral | $14.74 |
CIPCenturia Industrial REIT | Bell Potter | Retained | Hold | $3.10 |
CNICenturia Capital Group | Bell Potter | Retained | Hold | $1.20 |
COFCenturia Office REIT | Bell Potter | Retained | Sell | $0.85 |
COHCochlear | Macquarie | Retained | Neutral | $124.00 |
CTDCorporate Travel Management | UBS | Upgraded | Buy(from Neutral) | $4.20(from $16.70) |
CWPCedar Woods Properties | Bell Potter | Retained | Buy | $9.60 |
DGTDigico Infrastructure REIT | Bell Potter | Retained | Buy | $3.15 |
DNLDyno Nobel | Citi | Retained | Buy | $4.55 |
DRRDeterra Royalties | Morgan Stanley | Retained | Equal Weight | $3.95 |
DXCDexus Convenience Retail REIT | Bell Potter | Retained | Buy | $3.15 |
DXIDexus Industria REIT | Bell Potter | Retained | Buy | $2.65 |
FFMFireFly Metals | Canaccord Genuity | Retained | Speculative Buy | $3.60 |
FMGFortescue | Morgan Stanley | Retained | Underweight | $13.20 |
G6MGroup 6 Metals | Canaccord Genuity | Retained | Buy | $4.60(from $4.70) |
GBRGreat Boulder Resources | Canaccord Genuity | Retained | Speculative Buy | $0.20 |
GDIGDI Property Group | Bell Potter | Retained | Buy | $0.75 |
GG8Gorilla Gold Mines | Canaccord Genuity | Retained | Speculative Buy | $1.00 |
GLFGemlife Communities Group | Bell Potter | Retained | Hold | $4.90 |
GMGGoodman Group | Bell Potter | Retained | Hold | $30.10 |
HCWHealthCo Healthcare and Wellness REIT | Bell Potter | Retained | Buy | $0.90 |
HDNHomeCo Daily Needs REIT | Bell Potter | Retained | Buy | $1.25 |
HMCHMC Capital | Bell Potter | Retained | Buy | $4.25 |
IGOIGO | Morgan Stanley | Retained | Equal Weight | $6.40 |
ILUIluka Resources | Morgan Stanley | Retained | Overweight | $7.05 |
INAIngenia Communities Group | Citi | Retained | Neutral | $5.50 |
JHXJames Hardie Industries Plc | Citi | Retained | Neutral | $42.50 |
| Morgans | Retained | Accumulate | $45.75(from $43.00) | |
| Ord Minnett | Retained | Accumulate | $43.00(from $41.00) | |
| UBS | Retained | Neutral | $44.00(from $45.00) | |
JINJumbo Interactive | Morgan Stanley | Retained | Equal Weight | $8.30 |
LAULindsay Australia | Morgans | Retained | Accumulate | $0.80 |
| Ord Minnett | Retained | Buy | $1.01(from $1.04) | |
LICLifestyle Communities | Bell Potter | Retained | Hold | $4.30 |
LYCLynas Rare Earths | Morgan Stanley | Retained | Overweight | $14.65 |
MP1Megaport | Citi | Retained | Buy | $28.85 |
MQGMacquarie Group | Citi | Retained | Neutral | $245.00(from $240.00) |
| Morgans | Retained | Hold | $257.65(from $255.80) | |
| Ord Minnett | Retained | Accumulate | $255.00 | |
MYXMayne Pharma Group | Ord Minnett | Retained | Speculative Buy | $4.20 |
NABNational Australia Bank | Macquarie | Retained | Neutral | $37.00(from $38.00) |
NECNine Entertainment Co. Holdings | UBS | Retained | Neutral | $0.83(from $0.79) |
NSTNorthern Star Resources | Citi | Retained | Neutral | $27.10 |
| UBS | Retained | Buy | $31.10 | |
NWSNews Corporation | Ord Minnett | Retained | Buy | $60.00 |
NXTNEXTDC | Citi | Retained | Buy | $15.00(from $12.75) |
ORGOrigin Energy | Morgan Stanley | Retained | Underweight | $10.42 |
PLSPLS Group | Morgan Stanley | Retained | Equal Weight | $3.85 |
QANQantas Airways | Morgans | Downgraded | Hold(from Accumulate) | $9.60(from $10.60) |
| Ord Minnett | Retained | Buy | $10.60(from $10.90) | |
| UBS | Retained | Buy | $11.40 | |
REAREA Group | Ord Minnett | Retained | Buy | $225.00 |
RGNRegion Group | Bell Potter | Retained | Hold | $2.35 |
RHCRamsay Health Care | Morgan Stanley | Retained | Underweight | $41.90 |
RIORio Tinto | Morgan Stanley | Retained | Underweight | $146.00 |
SCGScentre Group | Morgan Stanley | Downgraded | Equal Weight(from Overweight) | $4.00(from $4.44) |
SDRSiteMinder | Morgan Stanley | Retained | Overweight | $5.80 |
SFRSandfire Resources | Morgan Stanley | Retained | Underweight | $20.35 |
SKGStorage King Group | Bell Potter | Retained | Sell | $1.05 |
SUMSummit Minerals | Bell Potter | Retained | Buy | $11.45 |
VGNVirgin Australia Holdings | Citi | Retained | Buy | $3.20 |
WBCWestpac Banking Corporation | Morgan Stanley | Retained | Underweight | $31.00(from $30.00) |
WDSWoodside Energy Group | UBS | Retained | Neutral | $32.30(from $31.30) |
WESWesfarmers | Morgan Stanley | Retained | Equal Weight | $70.50 |
WHCWhitehaven Coal | Morgan Stanley | Retained | Overweight | $8.95 |
ZIPZip Co | Citi | Retained | Buy | $2.70 |
Scans
Top Gainers
Code | Company | Last | % Chg |
|---|---|---|---|
| HYTDC | Hyterra Ltd | $0.07 | +40.00% |
| OLY | Olympio Metals Ltd | $0.024 | +26.32% |
| CYP | Cynata Therapeutics Ltd | $0.015 | +25.00% |
| IMM | Immutep Ltd | $0.026 | +23.81% |
| T3D | 333D Ltd | $0.032 | +23.08% |
Top Fallers
Code | Company | Last | % Chg |
|---|---|---|---|
| QUE | Queste Communications Ltd | $0.02 | -28.57% |
| OAK | Oakridge International Ltd | $0.061 | -23.75% |
| GHY | Gold Hydrogen Ltd | $0.335 | -22.09% |
| TSR | Turnstone Resources Ltd | $0.018 | -21.74% |
| VNT | Ventia Services Group Ltd | $4.80 | -16.23% |
52 Week Highs
Code | Company | Last | % Chg |
|---|---|---|---|
| HYTDC | Hyterra Ltd | $0.07 | +40.00% |
| AMX | Aerometrex Ltd | $0.37 | +10.45% |
| AVH | Avita Medical Inc | $4.89 | +7.47% |
| WZR | Wisr Ltd | $0.039 | +5.41% |
| EMB | Embelton Ltd | $12.30 | +4.24% |
52 Week Lows
Code | Company | Last | % Chg |
|---|---|---|---|
| QUE | Queste Communications Ltd | $0.02 | -28.57% |
| VNT | Ventia Services Group Ltd | $4.80 | -16.23% |
| 5GG | Pentanet Ltd | $0.011 | -15.39% |
| BUX | Buxton Resources Ltd | $0.017 | -15.00% |
| ADR | Adherium Ltd | $0.052 | -14.75% |
Near Highs
Code | Company | Last | % Chg |
|---|---|---|---|
| RHC | Ramsay Health Care Ltd | $55.49 | -0.47% |
| OZBD | Betashares Australian Composite Bond ETF | $43.36 | -0.05% |
| AN3PI | Australia and New Zealand Banking Group Ltd | $102.76 | 0.00% |
| PCI | Perpetual Credit Income Trust | $1.065 | -1.39% |
| WVOL | iShares MSCI World Ex Aust Minimum Volatility ETF | $47.69 | +0.34% |
Relative Strength Index (RSI) Oversold
Code | Company | Last | % Chg |
|---|---|---|---|
| FGSE | Franklin Global Systematic Equity FD - Active ETF | $3.59 | 0.00% |
| SMHG | Vaneck Global Semiconductor ETF | $17.15 | +1.30% |
| SEMI | Global X Semiconductor ETF | $29.16 | +0.41% |
| JPHQ | Jpmorgan Nasdaq EQTY Prem Inc (Hedged) Complex ETF | $51.41 | -1.14% |
| ALD | Ampol Ltd | $35.95 | -0.22% |