
News | Market Wraps
Evening Wrap: ASX 200 gains as trade wars fire up metals and uranium stocks, tech gets wrecked on US stocks fall
The S&P/ASX 200 closed 15.0 points higher, up 0.18%.

Mentioned
The S&P/ASX 200 closed 15.0 points higher, up 0.18%.
There are tentative signs that global geopolitical tensions are spilling into a possible impending trade war. There were some beneficiaries today, however, including aluminium, copper, and in particular, uranium stocks.
A pullback in high flying US tech shares on Friday triggered a similar pullback in the local Information Technology sector, but sector losses were compounded by a sharp fall in Life 360 (360) shares after news broke its co-founder and CEO had sold a large parcel of shares in the company.
Click/scroll through for the usual reporting of the major sector and stock-specific moves, the broker responses to them, as well as all of the key upcoming economic data in tonight's Evening Wrap.
Also, I have detailed technical analysis on the NASDAQ Composite, the Russell 2000 and Uranium in today's ChartWatch.
Let's dive in!
Today in Review
Mon 18 Nov 24, 5:29pm (AEST)
Name | Value | % Chg |
|---|---|---|
Major Indices | ||
| ASX 200 | 8,300.2 | +0.18% |
| All Ords | 8,554.4 | +0.18% |
| Small Ords | 3,132.6 | +0.31% |
| All Tech | 3,794.5 | -0.70% |
| Emerging Companies | 2,258.3 | +0.33% |
Currency | ||
| AUD/USD | 0.6463 | +0.01% |
US Futures | ||
| S&P 500 | 5,912.5 | +0.27% |
| Dow Jones | 43,582.0 | +0.03% |
| Nasdaq | 20,636.0 | +0.69% |
Name | Value | % Chg |
|---|---|---|
Sector | ||
| Consumer Staples | 11,532.0 | +1.95% |
| Utilities | 8,872.5 | +1.82% |
| Energy | 8,637.1 | +1.47% |
| Materials | 16,698.5 | +1.15% |
| Consumer Discretionary | 3,884.3 | +0.25% |
| Industrials | 7,568.5 | +0.13% |
| Communication Services | 1,668.7 | -0.05% |
| Real Estate | 3,958.1 | -0.17% |
| Financials | 8,874.5 | -0.27% |
| Information Technology | 2,840.7 | -0.79% |
| Health Care | 43,515.8 | -0.88% |
Markets

ASX 200 Session Chart
The S&P/ASX 200 (XJO) finished 15.0 points higher at 8,300.2, 0.68% from its session low and just 0.21% from its high. In the broader-based S&P/ASX 300 (XKO), advancers beat decliners by a very tidy 183 to 97.
Two fortuitous and timely global trade / geopolitical news items on Friday helped the Resources (XJR) (+1.4%) sector to a solid gain today.
Assisting base metals stocks was the announcement by China's Ministry of Finance late-afternoon on Friday local time that it would be scrapping the export tax rebate on semi-finished ("semis") aluminium and copper products. The move aims to retain more of these materials within China, and could be seen as somewhat of a protectionist measure ahead of President-elect Trump's impending tariffs.
Base metals prices, particularly aluminium and copper, got a boost from the news on the London Metals Exchange (LME) on Friday.
Company | Last Price | Change $ | Change % | 1mo % | 1yr % |
|---|---|---|---|---|---|
Aluminium - LME Official Cash | $2641.00 | +$151.50 | +6.1% | +4.6% | +20.4% |
Copper - LME Official Cash | $9055.00 | +$287 | +3.3% | -3.5% | +12.1% |
Iron Ore China 62pct Fe Spot | $101.63 | -$0.59 | -0.6% | -3.5% | -20.6% |
Nickel - LME Official Cash | $15500.00 | +$165 | +1.1% | -6.8% | -8.9% |
Lead - LME Official Cash | $1936.00 | -$1 | -0.1% | -5.0% | -10.4% |
Tin - LME Official Cash | $29175.00 | +$150 | +0.5% | -6.8% | +18.6% |
Zinc - LME Official Cash | $3006.00 | +$103 | +3.5% | -0.1% | +18.4% |
GFEX Lithium Carbonate Futures Jan-25 | $80400 | +$1100 | +1.4% | +12.7% | -37.8% |
Lithium Hydroxide Battery Grade RMB/mt | $67195 | $0 | 0% | -1.1% | -58.6% |
Spodumene Concentrate Index ($US-mt) | $800 | -$6 | -0.8% | +5.8% | -61.4% |
Silver/U.S. Dollar Spot | $30.24 | -$0.27 | -0.9% | -4.6% | +24.4% |
Gold/U.S. Dollar Spot | $2562.26 | -$5.89 | -0.2% | -4.8% | +28.0% |
Commodities moves Friday and today for GFEX lithium carbonate futures
And so too did local base metals stocks. A modest rebound in the iron ore price in Singapore today also helped the Resources sector more broadly by stacking index points in major constituents BHP Group (ASX: BHP) (+0.7%), Fortescue (ASX: FMG) (+1.2%), Rio Tinto (ASX: RIO) (+2.2%), and Mineral Resources (ASX: MIN) (+5.8%).
Purely coincidentally on Friday, Russia announced it would be imposing restrictions on exports of enriched uranium to the USA. This move was far less ambiguous – with the Russians making it clear it was in retaliation to Washington's ban on imports of Russian uranium ore back in May.
I put to you these last two moves will not be the last protectionist / retaliatory trade-related tweaks made by major global economies you'' read about in this Evening Wrap over the next 12 months.
Company | Last Price | Change $ | Change % | 1mo % | 1yr % |
|---|---|---|---|---|---|
Silex Systems (SLX) | $5.85 | +$0.69 | +13.4% | +15.6% | +63.4% |
Boss Energy (BOE) | $3.07 | +$0.21 | +7.3% | -13.3% | -30.2% |
Deep Yellow (DYL) | $1.220 | +$0.08 | +7.0% | -17.8% | +5.6% |
South32 (S32) | $3.77 | +$0.22 | +6.2% | +1.9% | +16.7% |
Mineral Resources (MIN) | $35.46 | +$1.93 | +5.8% | -22.7% | -43.5% |
Paladin Energy (PDN) | $7.69 | +$0.4 | +5.5% | -38.4% | -21.1% |
Bannerman Energy (BMN) | $2.80 | +$0.14 | +5.3% | -15.9% | +11.1% |
WA1 Resources (WA1) | $14.53 | +$0.61 | +4.4% | +7.6% | +46.0% |
Vulcan Energy Resources (VUL) | $6.48 | +$0.26 | +4.2% | +36.7% | +151.2% |
Firefly Metals (FFM) | $1.050 | +$0.04 | +4.0% | -1.4% | +125.8% |
Coronado Global Resources (CRN) | $0.980 | +$0.035 | +3.7% | -10.5% | -38.8% |
Catalyst Metals (CYL) | $2.74 | +$0.09 | +3.4% | -18.5% | +238.3% |
Stanmore Resources (SMR) | $3.16 | +$0.09 | +2.9% | +9.3% | -15.0% |
Nickel Industries (NIC) | $0.930 | +$0.025 | +2.8% | +0.5% | +15.5% |
Nexgen Energy (NXG) | $11.89 | +$0.31 | +2.7% | +1.2% | +24.5% |
Emerald Resources (EMR) | $3.55 | +$0.09 | +2.6% | -15.5% | +42.0% |
Evolution Mining (EVN) | $4.74 | +$0.12 | +2.6% | -6.0% | +30.9% |
Chalice Mining (CHN) | $1.420 | +$0.035 | +2.5% | -16.5% | -9.6% |
Northern Star Resources (NST) | $16.25 | +$0.4 | +2.5% | -4.9% | +37.6% |
Bellevue Gold (BGL) | $1.265 | +$0.03 | +2.4% | -14.2% | -9.0% |
Mining sector winners today including several uranium stocks...
The only two sectors that did it tough today were the high-PE sectors of Information Technology (XIJ) (-0.79%) and Health Care (XHJ) (-0.88%). This was mostly in response to similar moves in their US tech and biotech counterparts in the US on Friday (see NASDAQ technical analysis in ChartWatch below).
In stock-specific news, Life 360 (ASX: 360) (-6.7%) shares tumbled after news broke its co-founder and CEO Chris Hulls had sold a parcel of shares representing around 1.2% of the outstanding float in the company. Mr Hulls put the sale down to a desire to "diversify" his financial holdings.
Company | Last Price | Change $ | Change % | 1mo % | 1yr % |
|---|---|---|---|---|---|
Clarity Pharmaceuticals (CU6) | $6.04 | -$1.1 | -15.4% | -10.9% | +450.8% |
Appen (APX) | $2.56 | -$0.19 | -6.9% | +24.9% | +199.4% |
Life360 (360) | $21.22 | -$1.53 | -6.7% | -1.9% | +152.9% |
Neuren Pharmaceuticals (NEU) | $15.63 | -$1.08 | -6.5% | +19.0% | +22.6% |
Objective Corporation (OCL) | $16.95 | -$0.95 | -5.3% | +11.9% | +41.3% |
Brainchip (BRN) | $0.255 | -$0.01 | -3.8% | +8.5% | +30.8% |
Sigma Healthcare (SIG) | $2.32 | -$0.07 | -2.9% | +24.1% | +243.7% |
Dicker Data (DDR) | $8.66 | -$0.19 | -2.1% | -5.0% | -24.0% |
Macquarie Technology Group (MAQ) | $89.06 | -$1.54 | -1.7% | +8.0% | +41.4% |
Audinate Group (AD8) | $8.82 | -$0.15 | -1.7% | -8.5% | -37.7% |
CSL (CSL) | $272.45 | -$4.56 | -1.6% | -9.4% | +4.6% |
Botanix Pharmaceuticals (BOT) | $0.315 | -$0.005 | -1.6% | -8.7% | +117.2% |
Siteminder (SDR) | $6.63 | -$0.1 | -1.5% | -0.9% | +36.4% |
Polynovo (PNV) | $2.01 | -$0.03 | -1.5% | -13.4% | +41.5% |
Xero (XRO) | $170.55 | -$2.06 | -1.2% | +15.5% | +67.3% |
Opthea (OPT) | $0.650 | -$0.005 | -0.8% | -27.4% | +117.1% |
Nextdc (NXT) | $16.52 | -$0.12 | -0.7% | -4.1% | +33.3% |
Pro Medicus (PME) | $208.52 | -$1.34 | -0.6% | +8.1% | +138.9% |
Cochlear (COH) | $293.12 | -$1.82 | -0.6% | +3.4% | +13.7% |
Technology One (TNE) | $26.76 | -$0.16 | -0.6% | +10.8% | +64.7% |
Tech and Health Care (bio tech) sector losers today...
ChartWatch
NASDAQ Composite Index

Baulked at 20k... (click here for full size image)

The last time we covered the Comp was in ChartWatch in the Evening Wrap on 6 November and the last time we covered the RUT was in ChartWatch in the Evening Wrap on 18 October.
It worth just checking up on the two most important US stock indices in this post-Trump-win era.
Both represent the most risk-on end of the US stocks spectrum. In the case of the RUT, it’s the most likely to succeed in a Make America Great Again next four years.
But, looking at last week’s performance, it appears both are struggling to hold their Trump Trade gains as the initial euphoria (and index points) have been snuffed out by clear messaging from the US Federal Reserve Chairman Jerome Powell that he is in no rush to cut official interest rates.
The first of his two shots across the stock market’s rocket emoji bow occurred in the presser following 8 November’s FOMC meeting – two days after markets had realised the Trump + Red Sweep US election outcome was a reality.
The next occurred a week later, i.e., Friday just gone, as Powell took part in a Dallas Fed talkfest. On both occasions, he made it clear the Fed would only cut US rates if absolutely necessary, and that the US economy wasn’t doing too bad at all.

US 10-Year T-Bond yield (click here for full size image)

This “no landing-no cuts” scenario is being baked into markets in the form of higher risk-free market yields, and last week – in the form of lower stock prices. The Comp appears to have baulked at the 20k milestone, and the RUT just short of breaching its all-time high set over 3-years ago now at 2459.
As for the trends, the chart above of the Comp and below of the RUT, show an abrupt about face to retest the dynamic demand of the respective short term uptrend ribbons.

Russell 2000 Index (RUT) (click here for full size image)

The turnaround in the RUT is more severe in terms of the magnitude of the decline, and the candles that caused it.
In both cases, a quick and strong demand-side response is required this week – potentially even as soon as tonight’s candle. That’ short term uptrend ribbon must hold, and it must hold well to prove to both sides of the market the demand-side remains very much in control of price.
As always, watch for long white-bodied candles and or downward pointing shadows as the fingerprints of excess demand. The opposite, that is, long black-bodied candles and or upward pointing shadows would signal the demand-side is sitting out / not feeling any urgency to commit funds – it also suggests the supply-side is fighting with its continuing sense of urgency.
For the Comp, a close below the short term uptrend ribbon at 18553 would likely seal the deal for a probing of static demand at 17767-18083. For the RUT, a close below 2260 would likely seal the deal for a probing of 2170-2195.
In both cases, long term uptrends remain very much intact.
Uranium Futures (Front month, back-adjusted) COMEX
%20COMEX%20Chart%2015%20November%202024.png)
A fortunate set of circumstances... (click here for full size image)
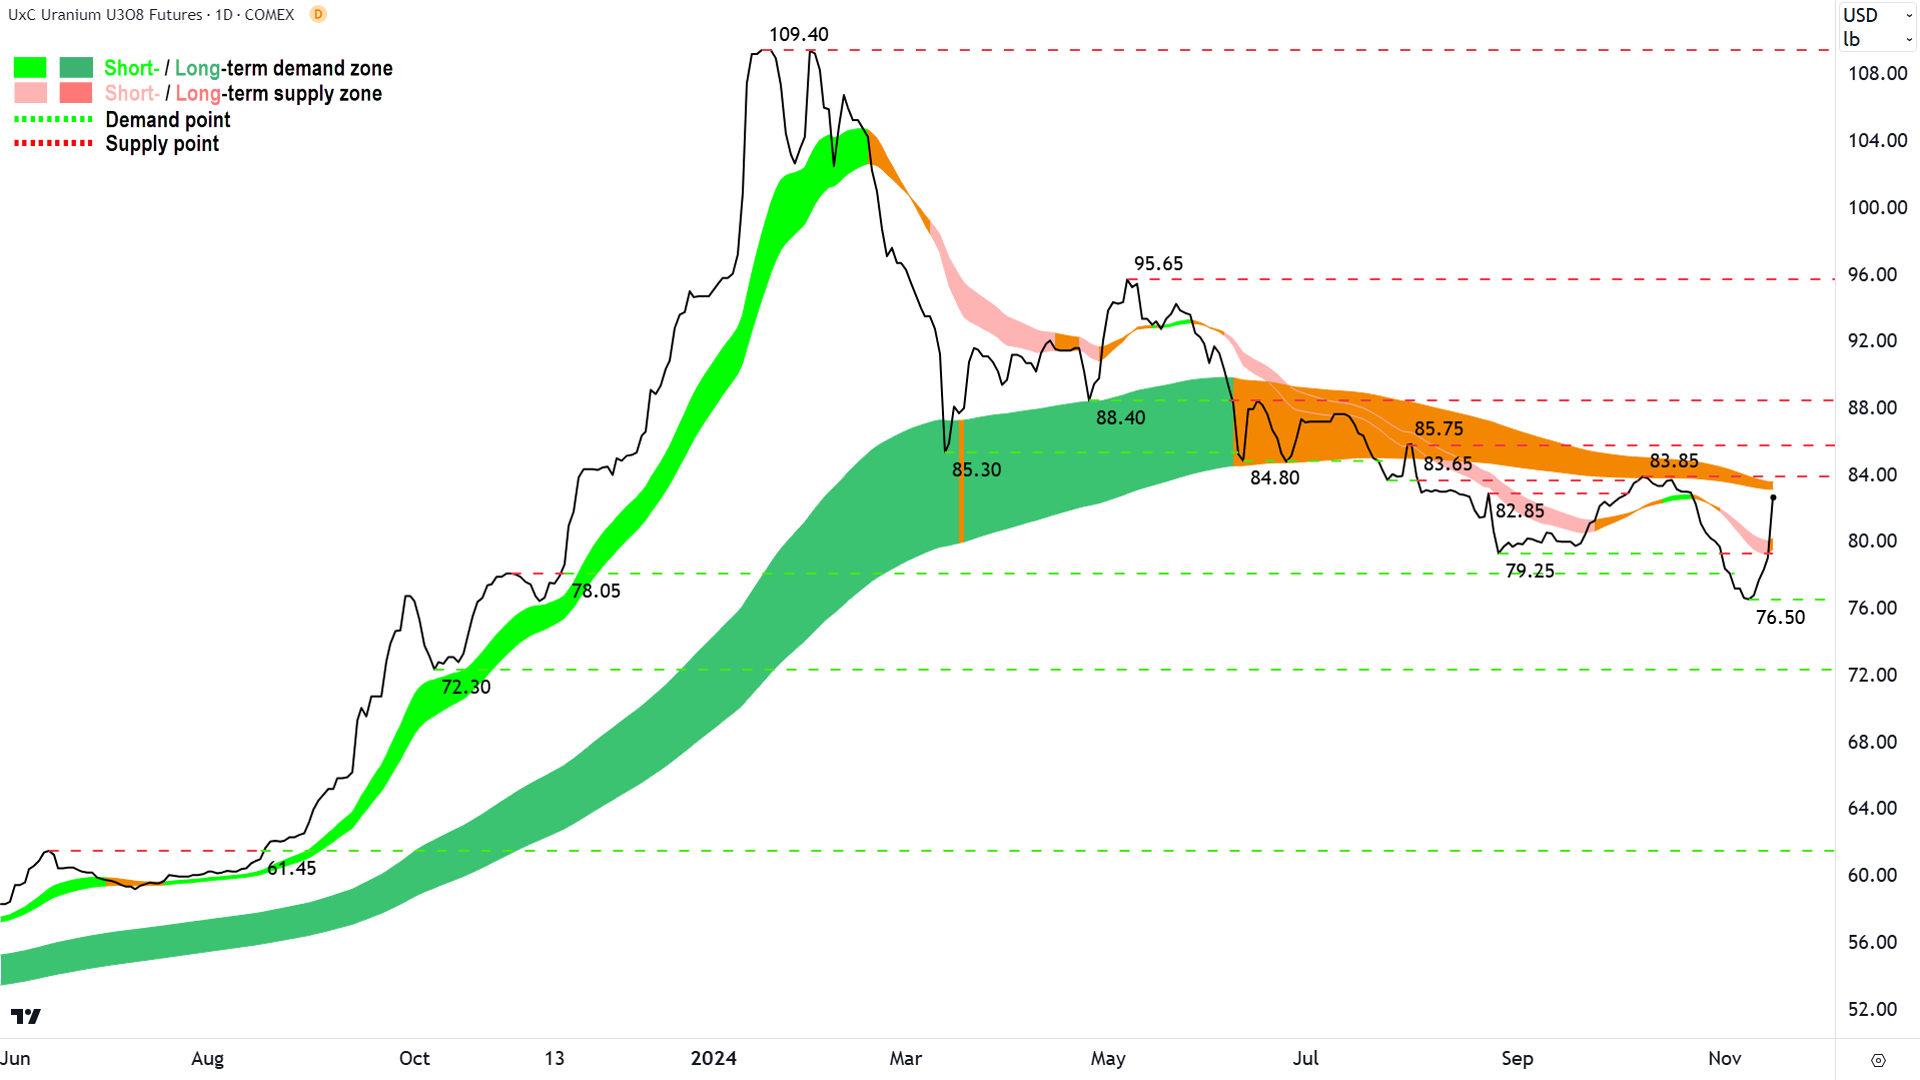
The last time we covered the uranium chart was in ChartWatch in the Evening Wrap on 4 November.
In that update, I reiterated my call that the long term trend in uranium had transitioned to down.
My Rule: When the price closes below the long term trend ribbon after a long uptrend, and then the long term trend ribbon begins to act as an area of dynamic supply – the long term trend has transitioned to down.
The uranium price did drop another few percent following that update, but then two major bullish fundamental surprise factors kicked in. The first is the aforementioned Trump + Red Sweep US election outcome. “We’re going to build more nuclear reactors than ever, maybe even more than that…” or something along those lines President-elect Trump said in a speech post-election. Then, Friday, Russia said it intends to temporarily limit the export of enriched uranium to the USA.
The details of Russia’s latest sanction attempt are sketchy, and does contain some waivers in certain circumstances out to 2027, but it was enough to trigger a nice pop in the chart above.
That pop closed the front-month uranium price back above the 78-05-79.25 static supply zone, and towards what I see as the even more critical 83.85-85.75 static supply zone.
It also took out the dynamic supply I’d ordinarily expect at the short term downtrend ribbon.
83.85-85.75 is going to be even more influential given it’s where the dynamic supply of the long term trend ribbon is also lurking.
My gut says it’s now put up or shut up for uranium. If it can get above 85.75 in emphatic style – that is with a steep angle of ascent (no candles here!) and potentially at some stage also with a resumption of rising troughs / rising peaks – then there’s a strong chance of flipping the long term trend again.
That’s a big “IF”.
Here’s another: IF instead the long term trend ribbon / 83.85-85.75 proves to be a wall of supply as I expect, and we see a sharp reversal there, it would be “stick with Plan A sort of stuff”: i.e., the long term trend has transitioned to down…the balance of probability lies with lower prices ahead.
Economy
Today
There weren't any major data releases in our time zone today
Later this week
Tuesday
02:00 USA NAHB Housing Market Index October (42 forecast vs 43 in September)
11:30 AUS RBA November Monetary Policy Meeting Minutes
Wednesday
00:30 USA Building Permits October (1.44 million forecast vs 1.43 million in September) & Housing Starts October (1.34 million forecast vs 1.35 million in September)
02:00 CHN 1-year Loan Prime Rate (forecast steady at 3.1%) & 5-year Loan Prime Rate (forecast steady at 3.6%)
18:00 UK Core Consumer Price Index October (CPI) (+3.1% p.a. forecast vs 3.2% p.a. in September)
Thursday
19:00 AUS RBA Governor Michelle Bullock speaks
Friday
09:00 AUS Flash Manufacturing Purchasing Managers Index (PMI) October (was 47.3 in September) & Flash Services PMI October (was 51.0 in September)
19:15 EUR Various countries Flash Manufacturing & Services PMIs October (Germany: Manufacturing forecast 43.1 vs 43.0 in September & Services 51.8 forecast vs 51.6 in September; Eurozone: Manufacturing forecast no change at 46.0 & Services forecast no change at 51.6)
Saturday
01:45 US Flash Manufacturing Purchasing Managers Index (PMI) October (was 47.3 in September) & Flash Services PMI October (was 51.0 in September)
Latest News
Interesting Movers
Trading higher
+13.4% Silex Systems (SLX) - Russia ban of enriched uranium to the USA, rise is consistent with prevailing short and long term uptrends (a recent regular in ChartWatch ASX Daily Scans Uptrends list) 🔎📈
+10.7% Weebit Nano (WBT) - No news since 14 Nov Weebit Nano completes A$50 million underwritten Placement, also consider company can't explain recent price strength in N, certainly a fortuitous appreciation ahead of a placement! Short term trend now well and truly up 🔎📈
+9.3% Lotus Resources (LOT) - Ditto got a boost from Russia uranium news Friday evening…also incredibly fortuitous timing here considering still-prevailing short and long term downtrends!
+8.6% Sayona Mining (SYA) - No news, lithium prices net up for week last week and edging higher in China again today…possibly boosting sentiment in the ASX lithium sector more broadly
+7.6% Southern Cross Electrical Engineering (SXE) - No news, very much Resources sector oriented, so the broad bounce in beaten down mining stocks likely helping produce a similar bounce here…
+7.3% Boss Energy (BOE) - No news, ditto beneficiary of Russia uranium news, ditto very lucky timing given dangerously weak technicals!
+7.0% Deep Yellow (DYL) - No news, ditto ASX uranium
+6.6% Kingsgate Consolidated (KCN) - No news since 12 Nov Chatree Gold Mine Ramp Up Update, broadly higher ASX gold sector today on modest improvement in the gold price
+6.4% Alcoa Corporation (AAI) - No company-specific news, but China scrapped export tax credit for certain semi-finished aluminium products, China is a major exporter of these products, so likely to limit supply and support aluminium price (aluminium price spiked over 6% on the LME on Friday).
+6.2% South32 (S32) - No news, but ditto winner from China scrapping export tax credit on aluminium/copper semis
+5.8% Mineral Resources (MIN) - No news, general ASX Resources sector strength as well as Singapore iron ore futures are up approx. 1.8% today
+5.5% Paladin Energy (PDN) - Becoming a substantial holder (UBS) and ditto ASX uranium
+5.5% Wildcat Resources (WC8) - No news, ditto ASX lithium
+5.3% Bannerman Energy (BMN) - No news, ditto ASX uranium
Trading lower
-15.4% Clarity Pharmaceuticals (CU6) - Head-to-head IIT with SAR-bisPSMA
-6.9% Appen (APX) - No news, broad ASX tech sector weakness today as US counterparts were hit hard on Friday night…
-6.7% Life360 (360) - CEO Securities Sale, ditto tough day for ASX tech
-6.5% Neuren Pharmaceuticals (NEU) - No news, biotech also had a tough day
-6.5% Peninsula Energy (PEN) - Continued negative response to Friday's Peninsula Energy/Lance Project Update, fall is consistent with prevailing short and long term downtrends (a recent regular in ChartWatch ASX Daily Scans Downtrends list) 🔎📈
-5.6% Resolute Mining (RSG) - Update in Relation to Negotiations with Malian Government, fall is consistent with prevailing short and long term downtrends (a recent regular in ChartWatch ASX Daily Scans Downtrends list) 🔎📈
-5.3% Objective Corporation (OCL) - No news, ditto tough day for ASX tech
-4.0% Cettire (CTT) - No news, fall is consistent with prevailing short and long term downtrends (a regular in ChartWatch ASX Daily Scans Downtrends list) 🔎📈
-3.8% Lovisa (LOV) - No company-specific news, downgraded to SELL from NEUTRAL at Citi and price target cut to $25.95 from $32.16, fall is consistent with prevailing short and long term downtrends (a recent regular in ChartWatch ASX Daily Scans Downtrends list) 🔎📈
Broker Notes
Australian Agricultural Company (AAC)
Retained at buy at Bell Potter; Price Target: $1.95 from $2.00
Alfabs Australia (AAL)
Initiated at buy at Bell Potter; Price Target: $0.40
Auckland International Airport (AIA)
Initiated at neutral at E&P; Price Target: $6.55
Aristocrat Leisure (ALL)
Retained at add at Morgans; Price Target: $73.00 from $67.00
ANZ Group (ANZ)
Retained at sell at Citi; Price Target: $25.25
Retained at underperform at Macquarie; Price Target: $26.50
Retained at underweight at Morgan Stanley; Price Target: $27.80
Aspen Group (APZ)
Retained at buy at Bell Potter; Price Target: $2.75 from $2.50
Autosports Group (ASG)
Downgraded to neutral from buy at UBS; Price Target: $2.20 from $2.90
Bendigo and Adelaide Bank (BEN)
Retained at equal-weight at Morgan Stanley; Price Target: $12.00
Bank of Queensland (BOQ)
Retained at underweight at Morgan Stanley; Price Target: $6.10
Commonwealth Bank of Australia (CBA)
Retained at sell at Citi; Price Target: $91.50
Retained at underperform at Macquarie; Price Target: $97.00
Retained at underweight at Morgan Stanley; Price Target: $113.50
Camplify (CHL)
Retained at add at Morgans; Price Target: $2.10 from $2.55
Capricorn Metals (CMM)
Retained at outperform at Macquarie; Price Target: $6.90 from $7.00
Computershare (CPU)
Downgraded to accumulate from buy at Ord Minnett; Price Target: $31.75 from $30.50
Capstone Copper Corp. (CSC)
Initiated at buy at Ord Minnett; Price Target: $13.00
Cettire (CTT)
Initiated at sell at Citi; Price Target: $1.30
Elders (ELD)
Retained at buy at Citi; Price Target: $9.75
Envirosuite (EVS)
Retained at hold at Bell Potter; Price Target: $0.06 from $0.05
Findi (FND)
Retained at buy at Ord Minnett; Price Target: $8.72 from $7.52
Fleetpartners Group (FPR)
Retained at buy at Citi; Price Target: $4.10
Graincorp (GNC)
Retained at hold at Morgans; Price Target: $8.81 from $9.45
Healius (HLS)
Retained at sell at Citi; Price Target: $1.50
Downgraded to underweight from neutral at Jarden; Price Target: $1.25 from $1.67
Retained at hold at Jefferies; Price Target: $1.45 from $1.75
Retained at neutral at JP Morgan; Price Target: $1.20 from $1.65
Retained at neutral at Macquarie; Price Target: $1.35 from $1.60
Retained at sell at Ord Minnett; Price Target: $1.30 from $1.37
Retained at sector perform at RBC Capital Markets; Price Target: $1.75 from $2.05
Insurance Australia Group (IAG)
Retained at buy at Bank of America; Price Target: $9.20
Iluka Resources (ILU)
Retained at outperform at Macquarie; Price Target: $7.10
Immutep (IMM)
Retained at buy at Bell Potter; Price Target: $0.70
Ingenia Communities Group (INA)
Retained at buy at Citi; Price Target: $6.15
IPH (IPH)
Retained at outperform at Macquarie; Price Target: $7.11 from $7.31
Judo Capital (JDO)
Retained at overweight at Morgan Stanley; Price Target: $1.75
Lendlease Group (LLC)
Retained at buy at Citi; Price Target: $8.00
Lovisa (LOV)
Downgraded to sell from neutral at Citi; Price Target: $25.95 from $32.16
Retained at outperform at Macquarie; Price Target: $34.10 from $35.10
Lynas Rare Earths (LYC)
Retained at neutral at Macquarie; Price Target: $7.30 from $7.50
Meteoric Resources (MEI)
Retained at outperform at Macquarie; Price Target: $0.36
Macquarie Group (MQG)
Retained at hold at Morgans; Price Target: $217.21 from $192.10
National Australia Bank (NAB)
Retained at sell at Citi; Price Target: $26.50
Retained at underperform at Macquarie; Price Target: $32.50
Retained at overweight at Morgan Stanley; Price Target: $38.40
Nufarm (NUF)
Retained at sell at Citi; Price Target: $3.75 from $3.65
Neurizon Therapeutics (NUZ)
Retained at buy at Morgans; Price Target: $0.42
Peninsula Energy (PEN)
Retained at buy at Canaccord Genuity; Price Target: $0.16 from $0.20
Retained at buy at Shaw and Partners; Price Target: $0.24 from $0.26
Pro Medicus (PME)
Upgraded to overweight from marketweight at Wilsons; Price Target: $255.00 from $145.00
QBE Insurance Group (QBE)
Retained at underperform at Bank of America; Price Target: $18.90
Retained at overweight at Morgan Stanley; Price Target: $19.30
Santana Minerals (SMI)
Retained at buy at Bell Potter; Price Target: $1.07 from $0.98
Retained at buy at Canaccord Genuity; Price Target: $1.22 from $1.16
Retained at buy at Shaw and Partners; Price Target: $1.14 from $0.93
Smart Parking (SPZ)
Retained at buy at Shaw and Partners; Price Target: $1.10 from $0.70
Suncorp Group (SUN)
Retained at buy at Bank of America; Price Target: $22.80
Seven Group (SVW)
Retained at outperform at Macquarie; Price Target: $50.90 from $47.80
Telix Pharmaceuticals (TLX)
Initiated at buy at UBS; Price Target: $21.00
Westpac Banking Corporation (WBC)
Retained at sell at Citi; Price Target: $26.25
Retained at underperform at Macquarie; Price Target: $26.50
Retained at equal-weight at Morgan Stanley; Price Target: $30.00
Xero (XRO)
Retained at hold at Morgans; Price Target: $188.00 from $140.00
Scans
Top Gainers
Code | Company | Last | % Chg |
|---|---|---|---|
| NVQ | Noviqtech Ltd | $0.088 | +57.14% |
| PLN | Pioneer Lithium Ltd | $0.15 | +36.36% |
| PSL | Paterson Resources Ltd | $0.015 | +36.36% |
| RFT | Rectifier Technologies Ltd | $0.012 | +33.33% |
| MGU | Magnum Mining and Exploration Ltd | $0.013 | +30.00% |
Top Fallers
Code | Company | Last | % Chg |
|---|---|---|---|
| LAT | Latitude 66 Ltd | $0.063 | -30.00% |
| UCM | Uscom Ltd | $0.033 | -26.67% |
| CAG | Cape Range Ltd | $0.11 | -24.14% |
| NYM | Narryer Metals Ltd | $0.02 | -23.08% |
| NTL | New Talisman Gold Mines Ltd | $0.015 | -21.05% |
52 Week Highs
Code | Company | Last | % Chg |
|---|---|---|---|
| NVQ | Noviqtech Ltd | $0.088 | +57.14% |
| MXO | Motio Ltd | $0.038 | +18.75% |
| EQR | EQ Resources Ltd | $0.053 | +15.22% |
| SGI | Stealth Group Holdings Ltd | $0.395 | +11.27% |
| AHF | Australian Dairy Nutritionals Ltd | $0.026 | +8.33% |
52 Week Lows
Code | Company | Last | % Chg |
|---|---|---|---|
| NYM | Narryer Metals Ltd | $0.02 | -23.08% |
| PFE | Pantera Minerals Ltd | $0.022 | -18.52% |
| MOV | Move Logistics Group Ltd | $0.14 | -12.50% |
| RCR | Rincon Resources Ltd | $0.014 | -12.50% |
| INF | Infinity Lithium Corporation Ltd | $0.031 | -11.43% |
Near Highs
Code | Company | Last | % Chg |
|---|---|---|---|
| PCI | Perpetual Credit Income Trust | $1.155 | -0.43% |
| WVOL | Ishares MSCI World Ex Aust Minimum Volatility ETF | $41.42 | -0.91% |
| GCI | Gryphon Capital Income Trust | $2.05 | +0.99% |
| VVLU | Vanguard Global Value Equity Active ETF | $74.11 | 0.00% |
| IHD | Ishares S&P/ASX DIV Opportunities Esg Screened ETF | $14.52 | +0.69% |
Relative Strength Index (RSI) Oversold
Code | Company | Last | % Chg |
|---|---|---|---|
| WLE | Wam Leaders Ltd | $1.26 | -6.32% |
| RSG | Resolute Mining Ltd | $0.38 | -5.59% |
| SMP | Smartpay Holdings Ltd | $0.58 | +1.75% |
| DUG | DUG Technology Ltd | $1.66 | -5.41% |
| EGL | Environmental Group Ltd (the) | $0.265 | -1.85% |
