News | Market Wraps
Evening Wrap: ASX 200 gains as coal stocks pop on strong NHC result, copper miners rally, NAB and MQG hit hard
The S&P/ASX 200 closed 6.3 points higher, up 0.08%.

The S&P/ASX 200 closed 6.3 points higher, up 0.08%.
Coal stocks popped on a well received half-year results release from New Hope Corporation (NHC) (+8.9%) and uranium stocks notched a bit of an inexplicable rally, but uranium bulls no doubt aren't complaining.
Elsewhere copper stocks continued their recent run of form on a continued resurgence in the copper price.
Losers? Big banks like National Australia Bank (NAB) (-2.0%) and Macquarie Group (MQG) (-2.3%)...Again. 😭
Click/scroll through for the usual reporting of the major sector and stock-specific moves, the broker responses to them, as well as all the key upcoming economic data in tonight's Evening Wrap.
Also, I have detailed technical analysis on the NASDAQ Composite, S&P/ASX 200, Copper and Silver in today's ChartWatch.
Let's dive in!
Today in Review
Tue 18 Mar 25, 5:01pm (AEST)
Name | Value | % Chg |
|---|---|---|
Major Indices | ||
| ASX 200 | 7,860.4 | +0.08% |
| All Ords | 8,089.9 | +0.10% |
| Small Ords | 3,054.4 | +0.79% |
| All Tech | 3,475.2 | +0.19% |
| Emerging Companies | 2,229.8 | +0.24% |
Currency | ||
| AUD/USD | 0.6373 | -0.18% |
US Futures | ||
| S&P 500 | 5,661.0 | -0.34% |
| Dow Jones | 41,780.0 | -0.25% |
| Nasdaq | 19,738.75 | -0.47% |
Name | Value | % Chg |
|---|---|---|
Sector | ||
| Utilities | 9,232.3 | +1.71% |
| Real Estate | 3,615.2 | +0.71% |
| Energy | 7,927.5 | +0.59% |
| Materials | 16,724.5 | +0.30% |
| Communication Services | 1,632.9 | +0.26% |
| Information Technology | 2,349.5 | +0.12% |
| Industrials | 7,712.8 | +0.11% |
| Health Care | 40,817.9 | +0.03% |
| Consumer Staples | 11,387.2 | -0.01% |
| Financials | 8,078.0 | -0.17% |
| Consumer Discretionary | 3,753.3 | -0.58% |
Markets

ASX 200 Session Chart
The S&P/ASX 200 (XJO) finished 6.3 points higher at 7,860.4, 0.80% from its session high and just 0.13% from its low. Despite the wall of selling that met stocks in the benchmark index from the open, in the broader-based S&P/ASX 300 (XKO), advancers beat decliners by a solid 183 to 82.
Aussie stocks faded fast after promising start – such is the nature of supply-side markets. Demand is tentative, and when it does decide to dip a toe in the water and trigger a little rally...the supply-side sharks dash in to bite it off 🦈!
Fortunately today, the sharks only took the toe. The damage was limited to the upward pointing shadow in today's candle and did not extend into falls. Still, today's price action is symptomatic of a nervous market that is transitioning from risk-on and FOMO to risk-off and and cashing out for riskless options. More on this and on the ASX 200 technicals in ChartWatch, below.
It wasn't all doom and gloom, though. I note the solid market breadth (better than 2:1 up vs down in the ASX 300), and that 8 of the 11 major sectors managed to finish with a gain. Additionally, the 3 losers are each consistent with recent thematics discussed here several times over the last few weeks of this correction: the rotation from high-PE momentum into low-PE value more broadly, and to a lesser extent – on up days – from defensives to cyclicals.
So, in keeping, we saw Consumer Discretionary (XDJ) (-0.58%) and Financials (XFJ) (-0.17%) (high-PE), and Consumer Staples (XSJ) (-0.01%) (defensive), continue to struggle today. Interestingly, high-PE Information Technology (XIJ) (+0.12%), managed to buck the trend (only just!).
In banks, the intraday charts for National Australia Bank (ASX: NAB) (-2.0%), Commonwealth Bank of Australia (ASX: CBA) (-0.31%), and Macquarie Group (ASX: MQG) (-2.3%) were particularly telling – and no doubt much of the damage (and the long upward pointing shadow on today’s candle) can be attributed to the sell the rally activities in these three:


The sell the rally theme was most pronounced in these big banks (intraday charts)
Those charts must flip upside down to indicate the rotation is over…and likely…all is good with the ASX 200 again…
Winners? Again, cyclicals/low-PE, plus gold, and a few interest rate sensitives (risk-free yields fell overnight):
Utilities (XUJ) (+1.7%) (interest rate sensitive / bond proxy)
Gold (XGD) sub-index (+0.95%) (interest rate sensitive / flight to safety asset – and another record high gold price overnight)
Real Estate Investment Trusts (XPJ) (+0.71%) (interest rate sensitive / bond proxy)
Energy (XEJ) (+0.60%) (cylclical/low-PE, coal stocks popped on a well received half-year results release from New Hope Corporation (ASX: NHC) (+8.9%) and uranium stocks notched a bit of an inexplicable rally here!)
Resources (XJR) (+0.32%) (cylclical/low-PE, copper stocks continued to rally - more on copper technicals in ChartWatch below)
I'm curious to see how long the rallies in the XEJ and XJR can maintain. Sure, they're a low-PE place to store cash that's mandated for the market no matter what (big super funds have no choice but to keep investing – even if the market is crashing/about to crash) – but at some stage the reality of a global growth slowdown is going to bite them again 🦈.
The interest rate sensitives, similarly, are a curious lot. If bond yields tank again, it will be because global growth is in the toilet – and that's rarely good for any stocks.
So, where does one hide in the ASX? 🤔
It's the question I'm sure many big fund managers are asking right now, and for many, that answer is not to hide in the ASX at all – but instead to hide in cash and bonds. That is, for those who are not mandated to continue investing in the ASX no matter what! Interesting times in which we live!
ChartWatch
NASDAQ Composite Index

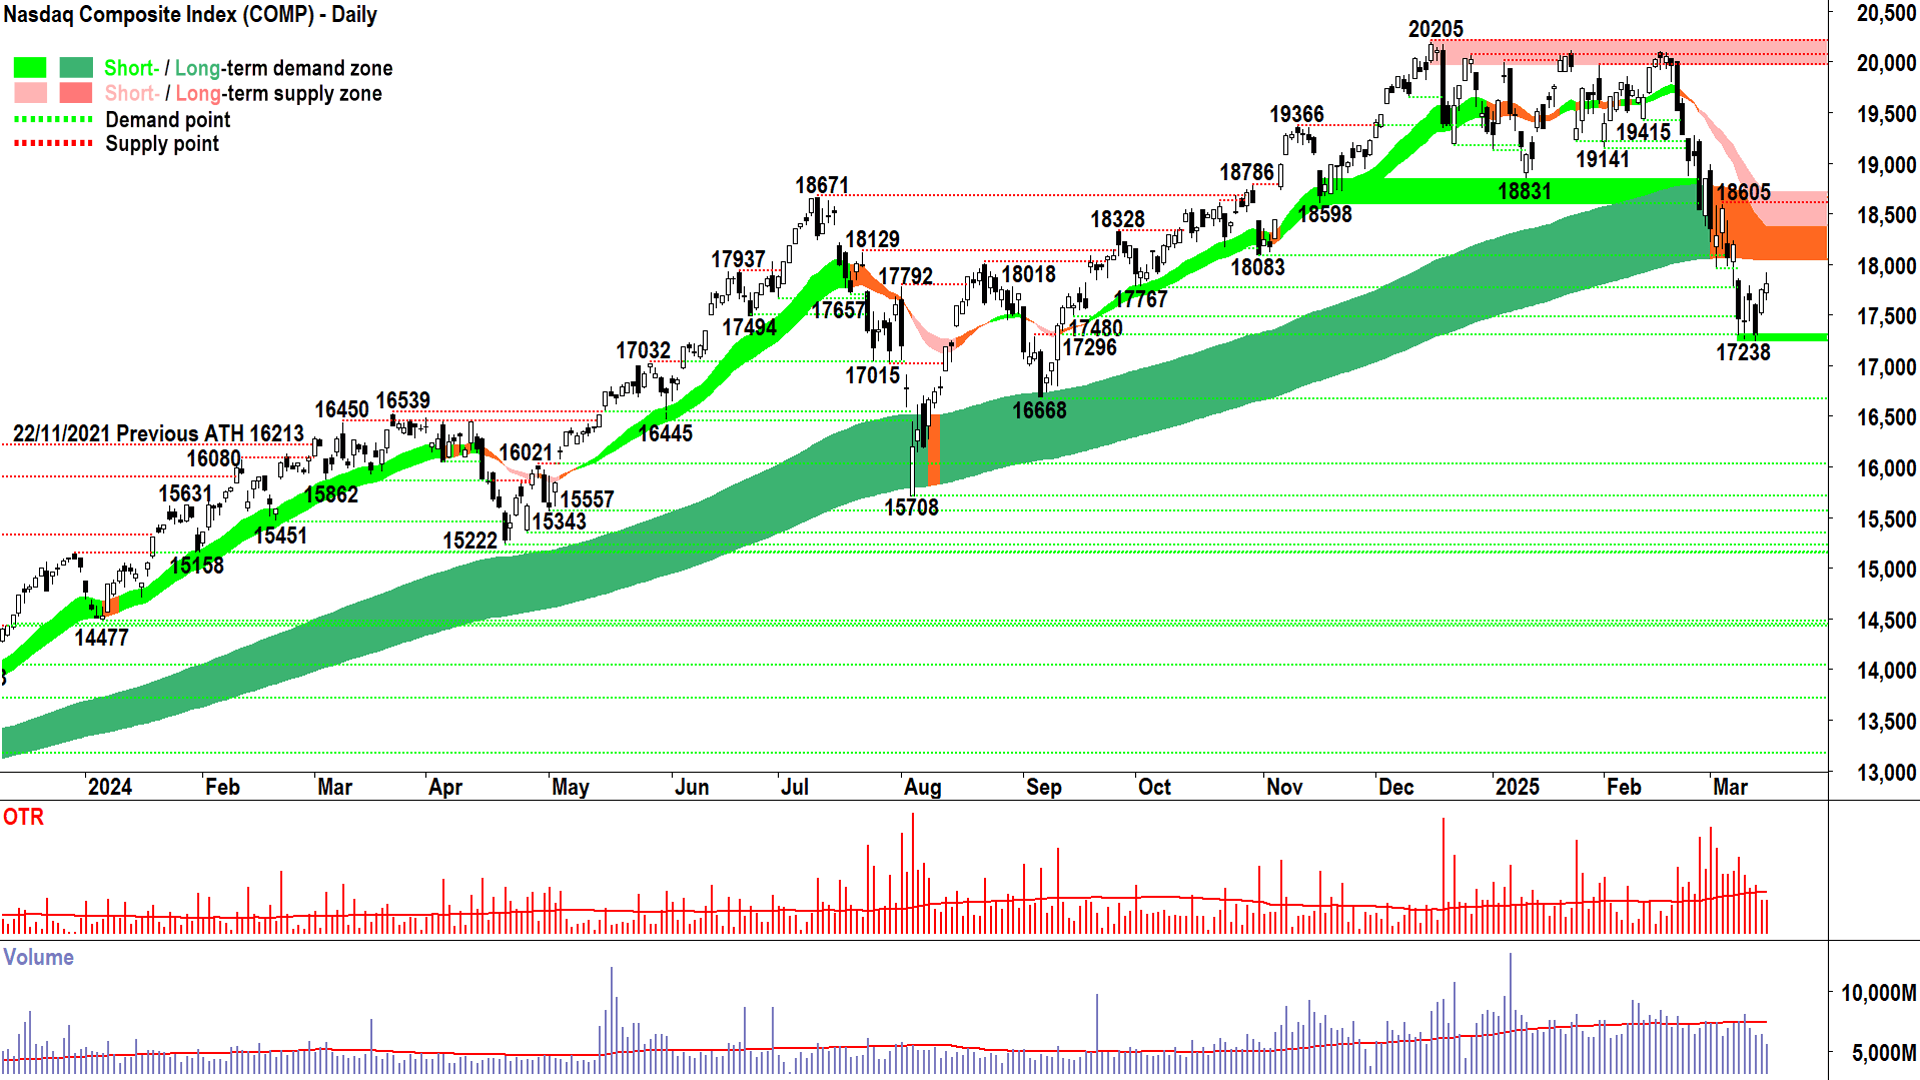
Supply continues to target rallies...demand lacks commitment (click here for full size image)
The upward pointing shadow of last night’s candle, plus its diminutive size overall, suggests there remains in the system substantial supply ready to work into rallies, and a general lack of commitment from the demand-side, respectively.
No changes to prior analysis:
The short term trend is down, the price action is falling peaks and falling troughs (i.e., supply reinforcement and demand removal), and there is a predominance of supply-side candles (i.e., black-bodied and or upward pointing shadows) = Short term supply-side control.
The long term trend has neutralised, the price is below the long term trend ribbon = Long term equilibrium
The short and long term ribbons combine to create a critical zone of dynamic supply = The price will likely be repelled lower from this zone (18040-18700).
Short term supply-side control remains intact until a close above 18040-18700, or if earlier, the price action can revert to strongly rising peaks and rising troughs (i.e., supply removal and demand reinforcement), and a clear predominance of demand-side candles (i.e., white-bodied and or downward pointing shadows).
A close below the 17238 point of demand continues the short term downtrend, and should a peak be formed at or below the long term trend ribbon – it will confirm the transition to a long term downtrend.
S&P/ASX 200 (XJO)
%20chart%2018%20March%202025.png)
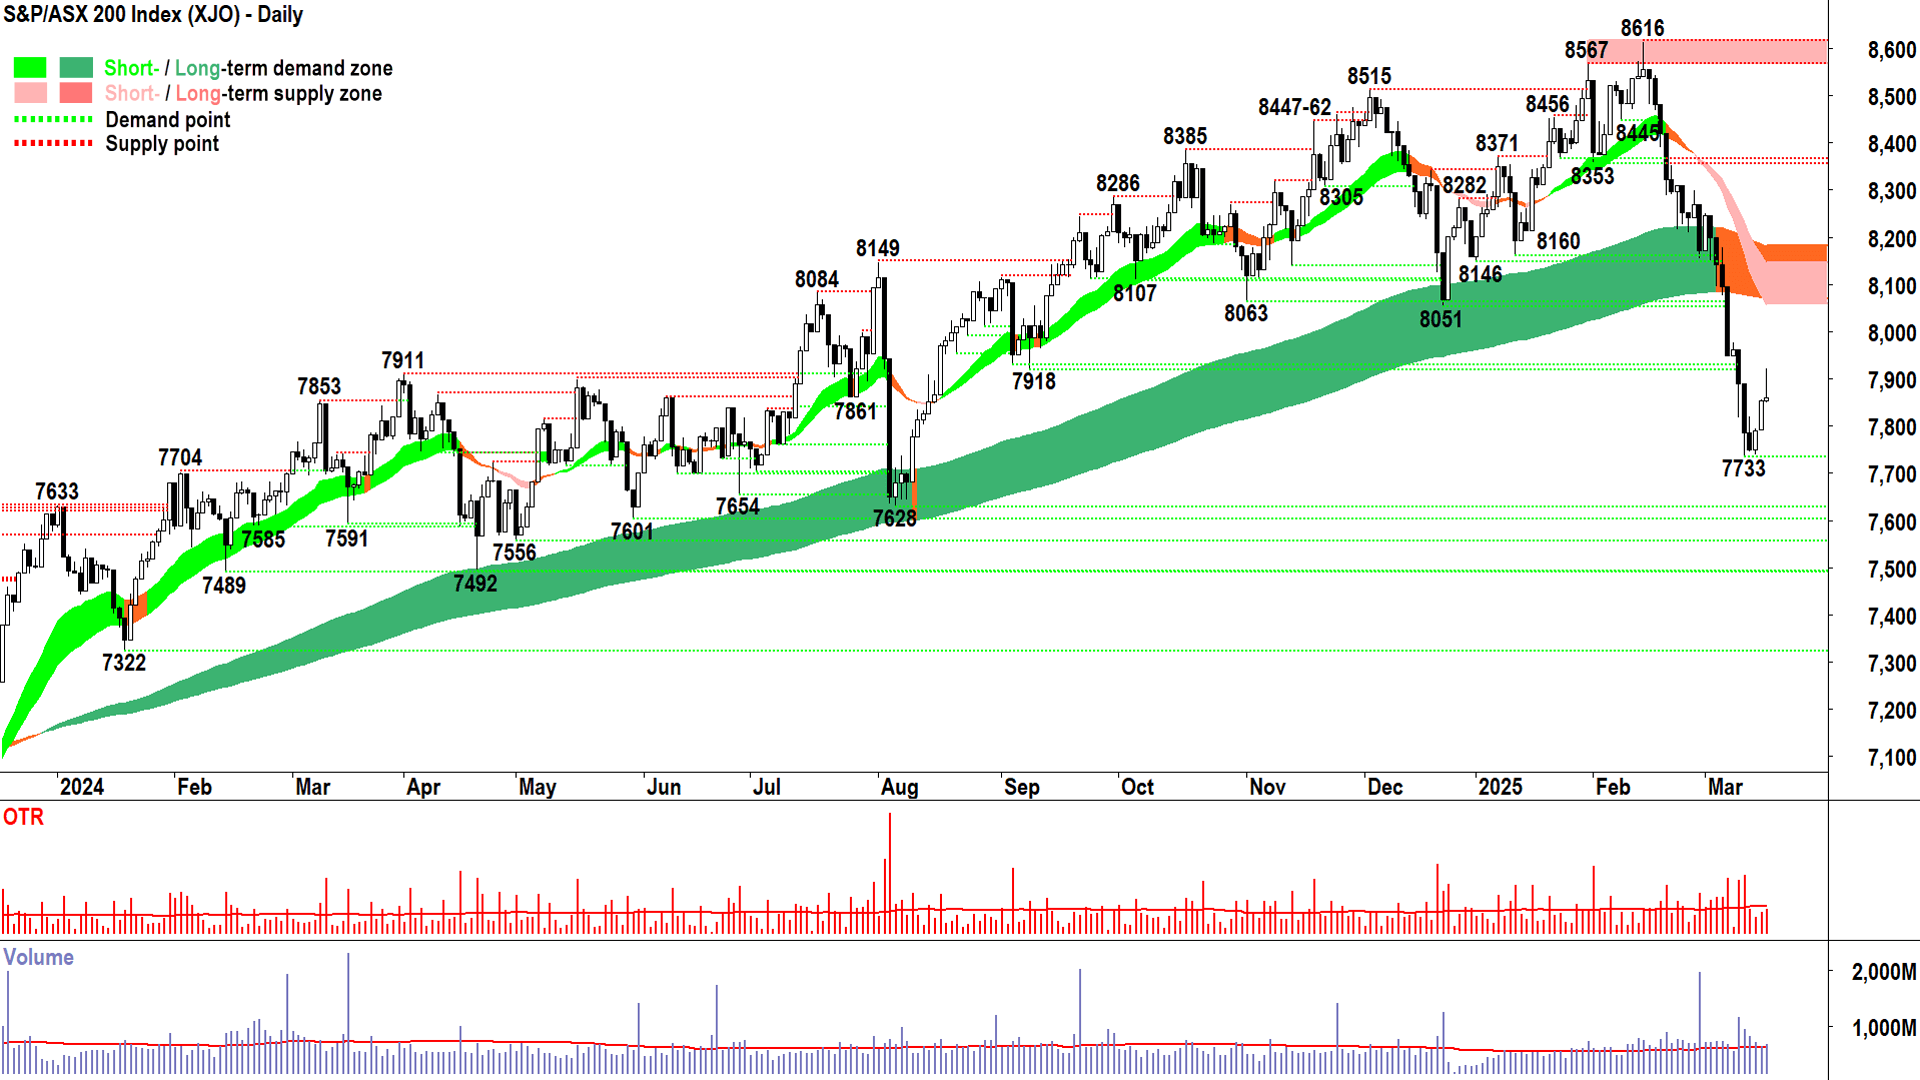
And that's what latent supply looks like in terms of price action! (click here for full size image)
This is the first time the short term trend ribbon has dipped below the long term trend ribbon since 22 September 2023. That time, there was another 200 points of falls in the offing – but then after that – the major 6751 October swing low that started this most recent phase of the bull market.
In last Thursday’s Evening Wrap, I noted that “repetition is the mother of all learning”. So let me repeat what I wrote on that day about the significance of upward pointing shadows. Don’t want to read it, smarty pants? Know everything there is to know about price action? 🤔 Well, then skip the next few paragraphs! ⏭️
"Today’s price action tells us exactly why upward pointing shadows are so important in our technical analysis – and why they are so foreboding in terms of signalling excess supply lurking in the system – ready to beat down any fledgling price rally.
If want to sell, and you have plenty to sell, you least want to do this when prices are cascading on thin volumes. Sometimes you may have no choice (that’s when prices will really be in free-fall), but you’d rather sell into the opposite of this, i.e., rising prices and solid volumes.
This is the whole premise behind sell the rally. Big funds who have plenty of stock to offload prefer to do this as speculative buying is coming in (perhaps because the Comp finally bounced last night) and or shorts are covering some back (for the same reason, or because they’re just taking some risk off the table – remember short covering is part of demand).
That buying creates a white bodied candle on the open. This buying is met by the latent supply that is targeting higher prices and liquidity – then it is overwhelmed (because the buying is not coming from anyone important) – and as prices fall back it creates the upward pointing shadow on the session’s candle. (If the price subsequently should close below its open it will also create a black body on the candle).
I like to say that a candle’s shadow points to excess demand / latent demand or excess supply / latent supply:
Downward pointing shadows point to where excess demand / latent demand was lurking in the system, waiting to buy the dip, eventually overwhelming prevailing supply and pushing the price back up after the early sell off.
Upward pointing shadows point to where excess supply / latent supply was lurking in the system, waiting to sell the dip, eventually overwhelming prevailing demand and pushing the price back down after the early pop up.
Today it was the latter.
And that means we’re in a market where the big money views price rises as an opportunity to get out at better prices and liquidity. It’s the opposite of what we’d expect in a healthy demand-side market."
⏭️ Today’s price action was perfectly consistent with the trend change that has befallen the Aussie stock market. Buy the dip has turned into sell the rally. Getting risk into the market due to FOMO has been replaced by transforming risk to risk-free (cash and risk free bonds – bonds initially sold off this morning, only to come storming back as the stock market faltered – coincidence? 🤔).
How long will it last? Again, not Nostradamus. Sorry. It will last as long as it lasts. ⌛
But you can rest assured that trends, price action, and candles will all swing back to demonstrating demand-side control at some point…we just have to wait patiently with reduced risk in the system until then.
High Grade Copper Futures (Front month, back-adjusted) COMEX
%20COMEX%20chart%2018%20March%202025.png)
Nothing interesting to see here...which is a good thing! (click here for full size image)
The last time we covered High Grade Copper was in ChartWatch in the Evening Wrap on 12 March.
In that update, given the strong demand-side technicals in the Copper chart, I could not “see any reason why Copper can't take another run at 4.8875-4.906, nor really can I see any reason why it can't get through this time.”
Such is the nature of breaks of major zones of supply – it can take time and several attempts to dislodge the latent supply there.
But, when we hit a supply zone with strong trends, price action, and candles – really then there’s no reason why the present time won’t be successful.
The other thing about supply zones, is that once you break through them, they often then begin to act as zones of demand. So, there’s every chance that 4.8775-4.906 now begins to act as a zone of demand. I prefer to widen this to 4.851-4.906, however, as the previous point of supply at 4.851 will likely also have a say in proceedings.
The next key point of supply is 5.0845, and there’s nothing in the trends, price action, or candles that suggests the Copper price can’t get there. Should it do so – watch the candles to determine the probability of quickly dispensing with 5.0845 (i.e., demand-side candles) or of spend at least some time there (i.e., supply-side candles).
It's interesting that in Copper and Gold, we have in ChartWatch, found two very strong and consistent trends amongst the broader chaos. It goes to show that even in the most volatile markets – and with the noise in the media that inevitably goes with it – there are typically great trends for technical analysts to identify and take advantage of.
How long will this strong trend in copper last for? I have no clue – I can't tell the future! 🔮 What I can say, is that you and I will see the signs in the price action that the supply-side is moving in to take control of the copper price when it occurs. We will concern ourselves with it then!
Silver Futures (Front month, back-adjusted) COMEX
%20COMEX%20chart%2018%20March%202025.png)
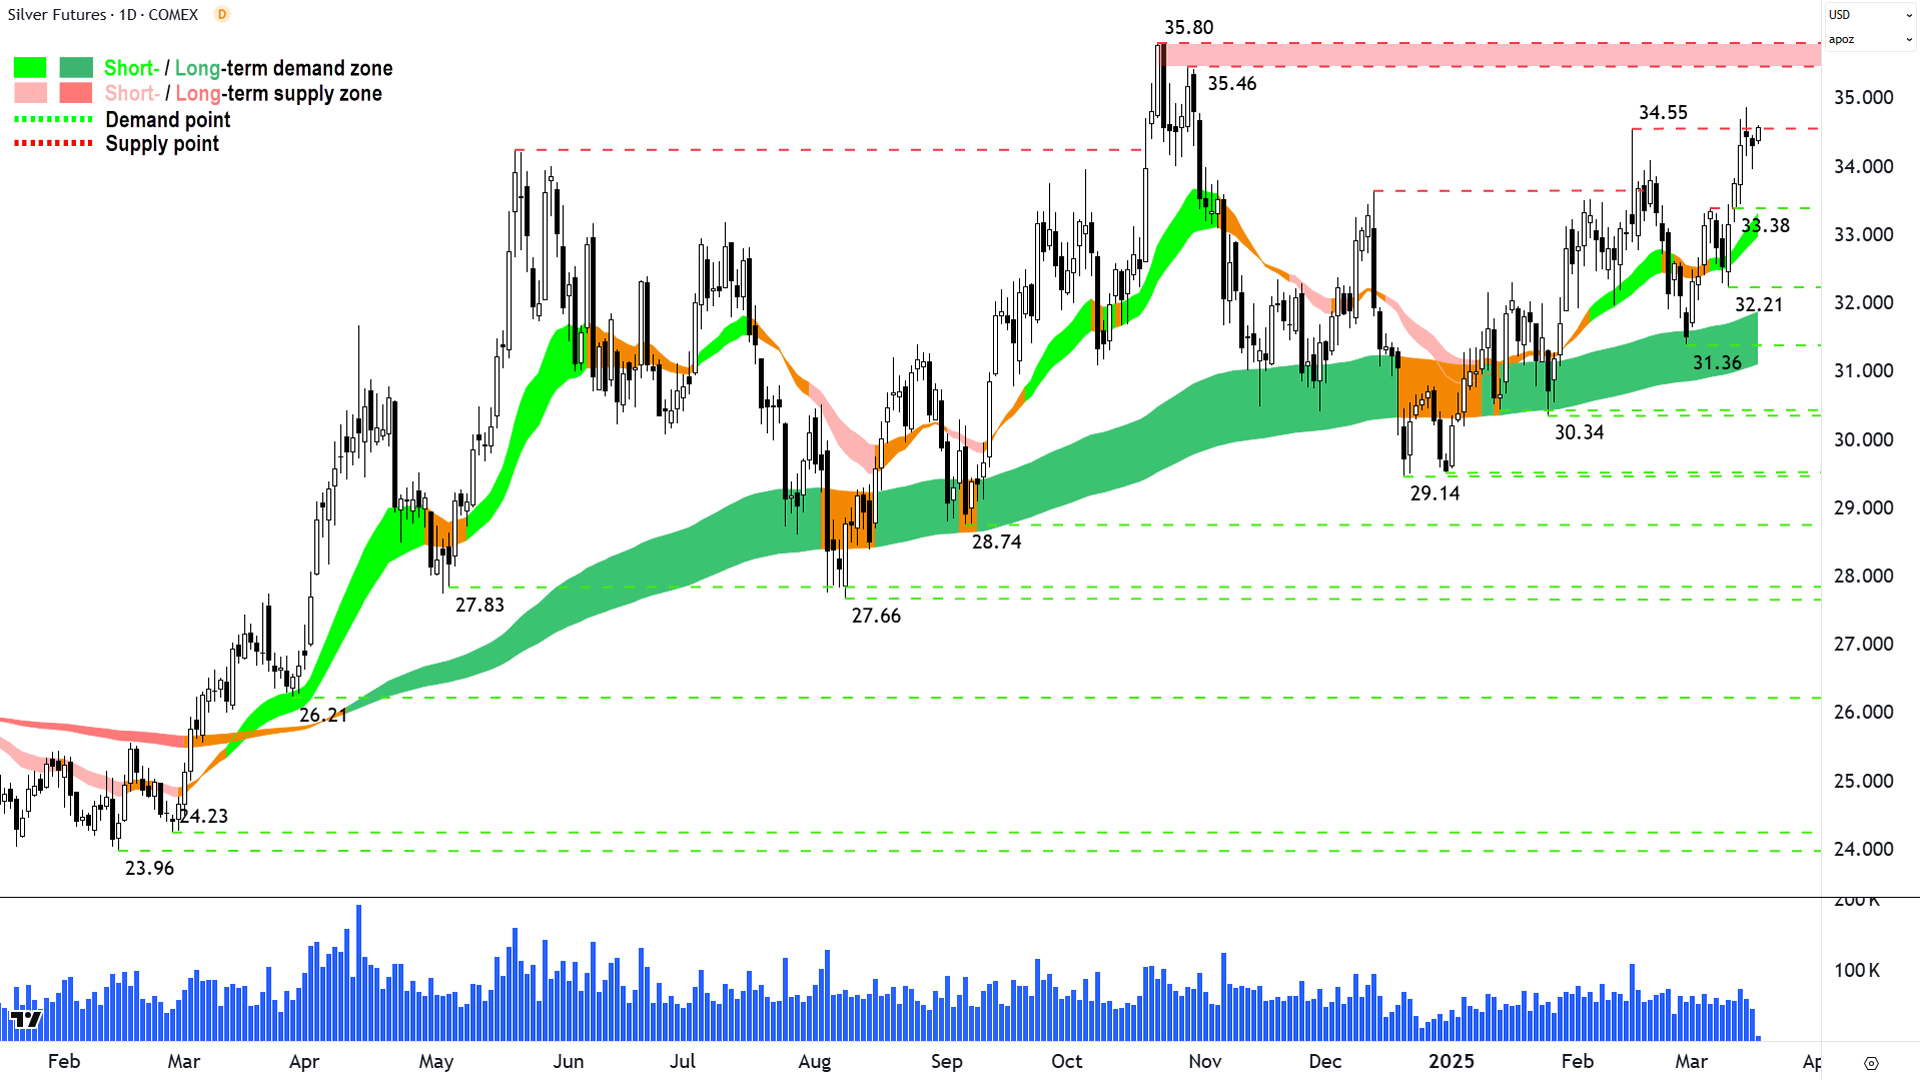
Silver, still second to gold 🥈❌🥇! (click here for full size image)
It’s been a great deal of time since we last covered silver in ChartWatch (in the Evening Wrap on 5 February).
In that update, I noted that “silver 'aint no gold! 🥈” – that whilst the silver short and long term uptrends were progressing steadily, it was not exhibiting the same consensus among market participants that gold was at the time.
Consensus is the holy grail of trend following. This is because consensus breads the strongest and most sustainable trends.
We want to be trading in the direction that’s consistent the actions of the vast majority of market participants (i.e., creating excess demand = up or excess supply = down). This is the path of least resistance for the price.
The opposite of consensus, confusion, it breeds volatility. It is difficult to trust such a trend, and therefore I tend to avoid low consensus trends.
There's also apathy – and this is more associated with equilibrium or sideways movement. Unless you know how to trade options (sell time), there’s little for the trend follower to do in these markets.
For silver, there are growing signs the views among market participants are growing more aligned – that a greater number of them are moving to the demand-side, while fewer are remaining on the supply-side.
This is evident in strong price action (sharp angle of attack on most recent rising peaks and rising troughs), and a return to a predominance of demand-side candles. The 34.55 point of supply is being tested, and there appears to be little in the way of supply-side response there so far.
So, like I said for copper and many times here in ChartWatch in similar circumstances, there’s nothing in the above technicals to suggest that Silver cannot break through 34.55 and continue in trend.
The next critical point of supply – likely to be a monster in terms of the resistance it could provide against the prevailing short and long term uptrends – is 34.56-35.80.
Obviously, we’ll be watching candles and price action there closely.
Until then, demand is at the short term uptrend ribbon (dynamic), and then at 33.38 (static). The short term uptrend in silver remains intact as long as the price does not close below these levels.
Economy
Today
There weren't any major data releases in our time zone today
Later this week
Tuesday
20:30 USA Housing Data February
Building Permits: 1.45 million forecast vs 1.47 million in January
Housing Starts: 1.38 million forecast vs 1.37 million in January
Wednesday
Tentative JPN BOJ Policy Rate, Monetary Policy Statement, Press Conference (no change <0.50% forecast)
Thursday
02:00 USA Federal Reserve Funds Rate, FOMC Statement of Economic Projections
No change at 4.25%-4.50% forecast
02:00 USA Federal Reserve Press Conference
08:30 AUS Employment Change February (+31,400 forecast vs +44,000 in January)
Unemployment Rate: 4.1% forecast, unchanged from January
22:00 USA Existing Home Sales February (3.94 million forecast vs 4.08 million in January)
Friday
No major economic data releases are scheduled for this day
Latest News
Interesting Movers
Trading higher
+11.4% Arafura Rare Earths (ARU) - No news, rise is consistent with prevailing short term uptrend and long term trend is transitioning from down to up (I regret not running it in ChartWatch this morning! 🤦) 🔎📈
+10.6% Clarity Pharmaceuticals (CU6) - No news, Initiated at buy at Ord Minnett with a price target of $8.70, bounced in the wake of the recent sharp selloff.
+8.9% New Hope Corporation (NHC) - Half Year Results Presentation and Notification of buy-back, bounced in the wake of the recent sharp selloff.
+8.3% Ausquest (AQD) - No news, general strength across the broader Copper-Gold sector today, rise is consistent with prevailing short and long term uptrends, added to ChartWatch ASX Scans Uptrends list yesterday 🔎📈
+7.6% Austal (ASB) - Share Purchase Plan - Letter to eligible Shareholders, rise is consistent with prevailing short and long term uptrends 🔎📈
+6.2% Bannerman Energy (BMN) - No news, general strength across the broader Uranium sector today, moves in sector are consistent with NYSE listed Global X Uranium ETF (NYSE: URA) +3.1% overnight, however, this move has not been accompanied by a similar move in the uranium futures price.
+6.1% 29METALS (29M) - No news, general strength across the broader Copper sector today, bounced in the wake of the recent sharp selloff.
+5.6% Capstone Copper Corp. (CSC) - No news, general strength across the broader Copper sector today.
+5.5% Orthocell (OCC) - Regulatory approval to commence Striate sales in Singapore, rise is consistent with prevailing long term uptrend 🔎📈
+5.4% Firefly Metals (FFM) - No news, general strength across the broader Copper sector today.
+5.2% EBR Systems (EBR) - No news, rise is consistent with prevailing short and long term uptrends, a regular in ChartWatch ASX Scans Uptrends list 🔎📈
+5.1% Liontown Resources (LTR) - No news since 14-Mar Half year results presentation, battery metals stocks generally extended yesterday's rally (that rally was sparked by UBS's double upgrade from sell to buy for Mineral Resources (MIN)).
+5.0% Bigtincan (BTH) - No Adjustment to Consideration Under the Vector Transaction.
+4.8% EML Payments (EML) - No news, rise is consistent with prevailing short term uptrend and long term trend is transitioning from down to up, a recent regular in ChartWatch ASX Scans Uptrends list 🔎📈
+4.5% Megaport (MP1) - No news, rise is consistent with prevailing short term uptrend and long term trend is transitioning from down to up 🔎📈
+4.1% Larvotto Resources (LRV) - Purchase of Echidna Gully and Proposed issue of securities, rise is consistent with prevailing short and long term uptrends, a regular in ChartWatch ASX Scans Uptrends list 🔎📈
+4.1% Challenger (CGF) - Interim 2025 Dividend Reinvestment Plan neutralisation.
Trading lower
-5.4% Antipa Minerals (AZY) - No news, pulled back in the wake of recent sharp rally.
-5.3% Audinate Group (AD8) - No news since 17-Mar Becoming a substantial holder (State Street is often involved in securities borrowing arrangements that may be associated with short settling), fall is consistent with prevailing short and long term downtrends, one of the most Featured (highest conviction) stocks in ChartWatch ASX Scans Downtrends list 🔎📉
-4.9% Gold Road Resources (GOR) - March 2025 Quarter Production Update.
-4.7% Botanix Pharmaceuticals (BOT) - No news 🤔.
-4.5% Zip Co. (ZIP) - No news, fall is consistent with prevailing short term downtrend and long term trend is transitioning from up to down, a recent regular in ChartWatch ASX Scans Downtrends list 🔎📉
-3.7% Appen (APX) - No news, fall is consistent with prevailing short term downtrend and long term trend is transitioning from up to down, a recent regular in ChartWatch ASX Scans Downtrends list 🔎📉
-3.6% The A2 Milk Company (A2M) - No news, pulled back in the wake of recent sharp rally.
-3.0% Nuix (NXL) - Change of Director's Interest Notice (on market purchase of 70,000 shares for a total consideration of $238,499 clearly didn't help!), fall is consistent with prevailing short term downtrend and long term trend is transitioning from up to down, a recent regular in ChartWatch ASX Scans Downtrends list 🔎📉
-2.9% Coronado Global Resources (CRN) - No news, fall is consistent with prevailing short and long term downtrends, one of the most Featured (highest conviction) stocks in ChartWatch ASX Scans Downtrends list 🔎📉
Broker Moves
The A2 Milk Company (A2M)
Retained at outperform at Macquarie; Price Target: $7.85
Aussie Broadband (ABB)
Retained at neutral at Goldman Sachs; Price Target: $3.90
AMP (AMP)
Retained at neutral at Citi; Price Target: $1.600
Aspen Group (APZ)
Retained at buy at Bell Potter; Price Target: $3.05
Austal (ASB)
Retained at outperform at Macquarie; Price Target: $4.75
ASX (ASX)
Retained at neutral at Citi; Price Target: $68.50
AUB Group (AUB)
Retained at outperform at Macquarie; Price Target: $35.45
Avjennings (AVJ)
Retained at buy at Bell Potter; Price Target: $0.700
Breville Group (BRG)
Retained at outperform at Macquarie; Price Target: $41.10
Challenger (CGF)
Retained at buy at Citi; Price Target: $6.70
Centuria Industrial Reit (CIP)
Retained at buy at Bell Potter; Price Target: $3.35
Centuria Capital Group (CNI)
Retained at sell at Bell Potter; Price Target: $1.700
Centuria Office Reit (COF)
Retained at hold at Bell Potter; Price Target: $1.200
Coles Group (COL)
Retained at buy at Citi; Price Target: $21.00
Retained at outperform at Macquarie; Price Target: $22.00
Computershare (CPU)
Retained at neutral at Citi; Price Target: $40.90
Centaurus Metals (CTM)
Retained at buy at Canaccord Genuity; Price Target: $0.800
Clarity Pharmaceuticals (CU6)
Initiated at buy at Ord Minnett; Price Target: $8.70
Cedar Woods Properties (CWP)
Retained at buy at Bell Potter; Price Target: $7.20
Deterra Royalties (DRR)
Retained at buy at Ord Minnett; Price Target: $4.30 from $4.40
Dexus Convenience Retail Reit (DXC)
Retained at buy at Bell Potter; Price Target: $3.30
Dexus Industria Reit (DXI)
Retained at hold at Bell Potter; Price Target: $2.90
Endeavour Group (EDV)
Retained at neutral at Citi; Price Target: $4.50
Downgraded to neutral from buy at Goldman Sachs; Price Target: $4.50 from $5.10
GDI Property Group (GDI)
Retained at buy at Bell Potter; Price Target: $0.800
G8 Education (GEM)
Retained at outperform at Macquarie; Price Target: $1.600
Gold Road Resources (GOR)
Retained at sector perform at RBC Capital Markets; Price Target: $2.40
GQG Partners (GQG)
Retained at outperform at Macquarie; Price Target: $3.00
Healthco Healthcare and Wellness Reit (HCW)
Retained at buy at Bell Potter; Price Target: $1.300
Homeco Daily Needs Reit (HDN)
Retained at hold at Bell Potter; Price Target: $1.350
HMC Capital (HMC)
Retained at buy at Bell Potter; Price Target: $12.90
Insurance Australia Group (IAG)
Retained at buy at Citi; Price Target: $9.05
Retained at outperform at Macquarie; Price Target: $8.50
Integral Diagnostics (IDX)
Retained at outperform at Macquarie; Price Target: $3.20
IGO (IGO)
Retained at underweight at Morgan Stanley; Price Target: $3.85
IPH (IPH)
Retained at outperform at Macquarie; Price Target: $6.75
JB HI-FI (JBH)
Retained at outperform at Macquarie; Price Target: $111.00
Lifestyle Communities (LIC)
Retained at hold at Bell Potter; Price Target: $8.55
Lovisa (LOV)
Retained at outperform at Macquarie; Price Target: $33.40
Megaport (MP1)
Retained at outperform at Macquarie; Price Target: $14.30
Navigator Global Investments (NGI)
Retained at outperform at Macquarie; Price Target: $2.37 from $2.29
Nick Scali (NCK)
Retained at outperform at Macquarie; Price Target: $19.90
Perpetual (PPT)
Retained at buy at Citi; Price Target: $24.80
Pinnacle Investment Management Group (PNI)
Retained at outperform at Macquarie; Price Target: $27.37
Pilbara Minerals (PLS)
Retained at overweight at Morgan Stanley; Price Target: $2.75
Premier Investments (PMV)
Retained at buy at Bell Potter; Price Target: $30.00 from $34.00
QBE Insurance Group (QBE)
Retained at buy at Citi; Price Target: $23.30
Qualitas (QAL)
Retained at outperform at Macquarie; Price Target: $3.10
Ramelius Resources (RMS)
Upgraded to buy from hold at Argonaut Securities; Price Target: $3.00 from $2.60
Smartpay (SMP)
Upgraded to buy from hold at Bell Potter; Price Target: $1.330 from $0.680
Suncorp Group (SUN)
Retained at neutral at Citi; Price Target: $20.00
Telstra Group (TLS)
Retained at buy at Goldman Sachs; Price Target: $4.50
Temple & Webster Group (TPW)
Retained at outperform at Macquarie; Price Target: $17.60
Tesoro Gold (TSO)
Initiated at buy at Morgans; Price Target: $0.110
Tyro Payments (TYR)
Retained at buy at Shaw and Partners; Price Target: $1.600
Universal Store (UNI)
Retained at outperform at Macquarie; Price Target: $9.80
Ventia Services Group (VNT)
Retained at outperform at Macquarie; Price Target: $4.50
Woolworths Group (WOW)
Retained at neutral at Citi; Price Target: $33.00
Upgraded to outperform from neutral at Macquarie; Price Target: $30.80
Scans
Top Gainers
Code | Company | Last | % Chg |
|---|---|---|---|
| RLT | Renergen Ltd | $0.73 | +32.73% |
| WTM | Waratah Minerals Ltd | $0.19 | +31.03% |
| NIM | Nimy Resources Ltd | $0.056 | +30.23% |
| TKM | Trek Metals Ltd | $0.033 | +22.22% |
| TSO | Tesoro Gold Ltd | $0.033 | +22.22% |
Top Fallers
Code | Company | Last | % Chg |
|---|---|---|---|
| TRI | Trivarx Ltd | $0.014 | -17.65% |
| CND | Condor Energy Ltd | $0.019 | -17.39% |
| SNS | Sensen Networks Ltd | $0.019 | -17.39% |
| HOR | Horseshoe Metals Ltd | $0.015 | -16.67% |
| NFL | Norfolk Metals Ltd | $0.115 | -14.82% |
52 Week Highs
Code | Company | Last | % Chg |
|---|---|---|---|
| EGR | Ecograf Ltd | $0.19 | +18.75% |
| NC6 | Nanollose Ltd | $0.043 | +13.16% |
| ERM | Emmerson Resources Ltd | $0.13 | +8.33% |
| EQS | Equity Story Group Ltd | $0.035 | +6.06% |
| WAF | West African Resources Ltd | $2.32 | +3.57% |
52 Week Lows
Code | Company | Last | % Chg |
|---|---|---|---|
| TRI | Trivarx Ltd | $0.014 | -17.65% |
| PNN | Power Minerals Ltd | $0.07 | -13.58% |
| CHR | Charger Metals NL | $0.04 | -13.04% |
| TM1 | Terra Metals Ltd | $0.019 | -9.52% |
| AGY | Argosy Minerals Ltd | $0.022 | -8.33% |
Near Highs
Code | Company | Last | % Chg |
|---|---|---|---|
| GLDN | Ishares Physical Gold ETF | $37.72 | +0.29% |
| GXLD | Global X Gold Bullion ETF | $47.15 | +0.15% |
| ASIA | Betashares Asia Technology Tigers ETF | $11.30 | +0.71% |
| AIZ | Air New Zealand Ltd | $0.56 | -0.89% |
| INCM | Betashares Global Income Leaders ETF | $19.44 | +0.41% |
Relative Strength Index (RSI) Oversold
Code | Company | Last | % Chg |
|---|---|---|---|
| EGH | Eureka Group Holdings Ltd | $0.52 | 0.00% |
| XYZ | Block, Inc | $92.10 | +2.54% |
| JPEQ | JPM US100Q EQ Prem Inc Active ETF (Managed Fund) | $59.00 | +0.84% |
| PGC | Paragon Care Ltd | $0.385 | -1.28% |
| NWL | Netwealth Group Ltd | $26.69 | +1.02% |
