News | Market Wraps
Evening Wrap: ASX 200 firms on CBA bounce as lithium and uranium shares tumble
The S&P/ASX 200 closed 30.8 points higher, up 0.36%.

Mentioned
The S&P/ASX 200 closed 30.8 points higher, up 0.36%.
Europe is a lovely place. Amazing food, fine art and culture, breathtaking landscapes. I can attest to each of these attributes having just returned from my European sojourn!
It's also the catalyst for today's modest gain on the benchmark ASX 200. More specifically, the trade deal the EU just inked with the Trump administration, thus removing yet another area uncertainty for markets.
Markets hate uncertainty / love certainty, of course – so risk assets like stocks usually get a leg up under such circumstances. Today, the sectors that saw their legs raised the most were largely defensive and consumer related plays like Telecommunications (+1.1%), Financials (+0.9%), Healthcare (+0.83%) and Consumer Discretionary (+0.77%).
It wasn't all trade related plain sailing, though. Major Resources (-1.3%) and Energy (-1.4%) stocks were lower today, and some very sharply so, as the prices of iron ore, lithium, and uranium each traded similarly sharply lower overnight/today. Lithium deserves special mention – as it has just closed limit down in China 💥.
To make sense of all the above, I have detailed technical analysis on the Nasdaq Composite and S&P/ASX 200 in today's ChartWatch.
Be sure to click/scroll through for the usual reporting of the major sector and stock-specific moves, the broker responses to them, as well as all the key economic data in tonight's Evening Wrap.
Let's dive in!
Today in Review
Mon 28 Jul 25, 4:56pm (AEST)
Name | Value | % Chg |
|---|---|---|
Major Indices | ||
| ASX 200 | 8,697.7 | +0.35% |
| All Ords | 8,963.5 | +0.33% |
| Small Ords | 3,345.3 | -0.30% |
| All Tech | 4,232.5 | +1.00% |
| Emerging Companies | 2,412.3 | -0.61% |
Currency | ||
| AUD/USD | 0.655 | -0.25% |
US Futures | ||
| S&P 500 | 6,453.25 | +0.44% |
| Dow Jones | 45,252.0 | +0.37% |
| Nasdaq | 23,566.75 | +0.62% |
Name | Value | % Chg |
|---|---|---|
Sector | ||
| Communication Services | 1,879.0 | +1.06% |
| Financials | 9,278.3 | +0.89% |
| Health Care | 45,263.4 | +0.83% |
| Industrials | 8,393.5 | +0.79% |
| Consumer Discretionary | 4,170.8 | +0.77% |
| Real Estate | 3,979.6 | +0.67% |
| Information Technology | 3,010.6 | +0.61% |
| Consumer Staples | 12,023.8 | +0.48% |
| Utilities | 9,692.2 | -0.80% |
| Materials | 16,961.9 | -1.03% |
| Energy | 9,165.3 | -1.42% |
Markets
%20intraday%20chart%2028%20Jul%202025.png)
ASX 200 Session Chart
The S&P/ASX 200 (XJO) finished 30.8 points higher at 8,697.7, 0.35% from its session low and just 0.08% from its high. In the broader-based S&P/ASX 300 (XKO) advancers beat decliners by 176 to 105.
There’s plenty of catching up for me to do over the next few days, as whilst the benchmark ASX 200 has largely continued on its merry way since our last chat – there has been a modest changing of the guard with respect to sector leadership.
Ironically, it was my last update on 27 June in which I discussed what turned out to be very the start of this rotation – away from the rampaging banks and into beaten down resources and energy plays (the vertical blue line in the charts below is my last update!).
%20chart%2028%20Jul%202025.png)
ASX 200 Financial Sector Index (XFJ)
%20chart%2028%20Jul%202025.png)
ASX 200 Resources Sector Index (XJR)
Today’s trade shifted back the opposite direction – as is the Tin Pot's want to do. It's just how we operate: Rarely does everything on the ASX go up at the same time! Net-net is perhaps what that matters the most – and the net today was a gain (I note the market breadth was half decent).
Resources (XJR) (-1.3%) and Energy (XEJ) (-1.4%) were always going to tough it out today given lower uranium, crude oil, natural gas overnight, and lower iron ore and lithium prices and today. Lithium is perhaps the most interesting, given the benchmark September contract closed limit down on China’s GFEX exchange.

September 2025 Lithium Carbonate intraday chart, GFEX
I’m still compiling data for the last month on my manually updated daily chart for this contract, so I’ll update it in ChartWatch tomorrow. My first pass suggests today’s volatility could cause some problems for what appeared prior to be a promising reversal in the lithium price.
%20COMEX%20chart%2025%20Jul%202025.png)
Uranium Futures (Front month, back-adjusted) COMEX
Uranium’s woes were partly to do with a continued pullback in spot prices, but likely far more to do with the bad news released today by major sector constituent Boss Energy (BOE) (-44%). It nearly halved in value on bad news it would likely see a blowout in costs and lower production at its flagship Honeymoon Project – with this news coming just days after CEO Duncan Craib announced his departure from the company.
%20chart%2028%20Jul%202025.png)
Boss Energy (BOE)
The rest was largely ebb and flow…and ChartWatch returns today to help make sense of the bigger picture for Aussie shares. Perhaps the key takeaway point for today is this: Despite cash flowing out of Resources and Energy, the big fund managers saw fit to keep that cash in the local market somewhere else.
(P.S. I was blissfully ignorant of the goings on in markets over the last 4 weeks... so give me a chance to review and make sense of it all, and I'll provide detailed analysis and insights here and in ChartWatch of the next few days!)
ChartWatch
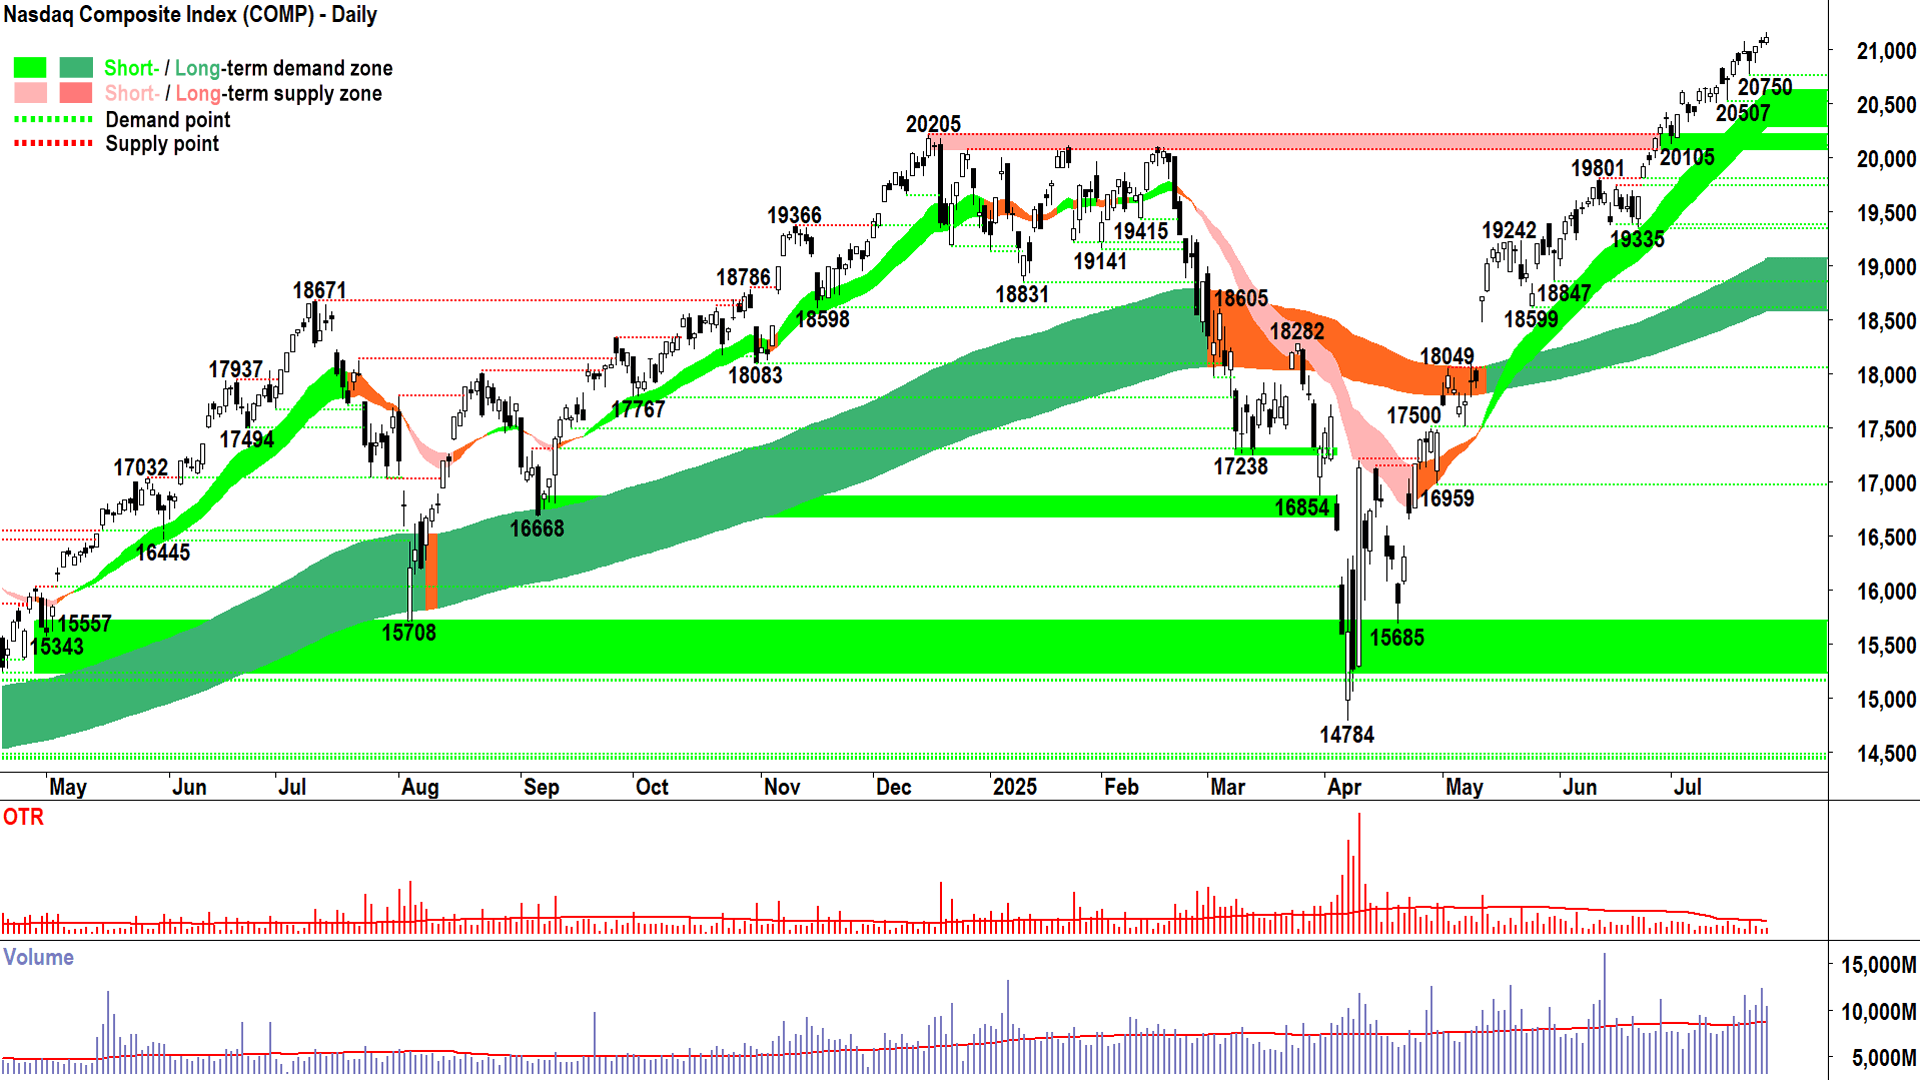
NASDAQ Composite Index

A+ (click here for full size image)
The last time I covered the Comp was all the way back on Friday 27 July… it feels like a very long time ago indeed… but really, very little has changed in terms of the short and long term trends.
More specifically, very little has changed in terms of the imbalance between demand and supply for US shares.
This imbalance – as evidenced by the steadily rising price since my last update – indicates an environment of excess demand.
D > S = P ⬆️
The demand side is throwing more cash at the supply side than the supply side has shares to offer them – and therefore the demand side must pay higher and higher prices to entice supply and get their fill.
The demand side clearly then believes that stocks are a sound investment. So too does the supply side, or they wouldn’t withholding supply so tightly.
Consensus. Consensus breeds imbalance between demand and supply (whereas indecision breeds stagnation).
If the consensus is that stocks are a sound investment right now – then who are we to argue? 🤔
It can be that simple if you let it be.
Or you can confound and confuddle it with questions of overvaluation, of threats to economic growth and stability, and of just about anything else the naysayers will shout from their soap boxes as to why stock prices are too high.
Hey – eventually, the naysayers will probably be right – sometime between now and the very, very distant future.
In the meantime, we can waste our bandwidth on their white noise or just follow the trend.
And eventually, we’ll be wrong – sometime between now and the very, very distant future!
But you cannot be right in the market all the time. And that’s okay with me. When you can accept the fact that you’ll be wrong at times, making decisions becomes a great deal easier.
So, what I said back on 27 July remains just as valid now:
Bet with the trend. Manage risk. Accept the outcome. Aim to win the war and concede minor skirmishes.
As for the Comp chart:
ST & LT trends = ⬆️/⬆️
Price action = Rising Peaks & Rising Troughs 📈
Candles = Predominantly demand-side (i.e., white-bodied and or downward pointing shadows)
= ✅✅✅
= Demand-side control
= Greater probability (but never certainty) that P continues to ⬆️
Demand:
Static: 20750, 20507, but more critically the old supply zone of 20070-20205
Dynamic: ST trend ribbon @ 20280-20610 | LT trend ribbon @ 18580-19060
Supply:
N/a - there are zero points of supply on the above chart!!!
View: ST trend remains intact until the price closes below the short term uptrend ribbon, or we see lower peaks or some very serious supply-side candles (i.e., long black-bodied and or long upward pointing shadows)
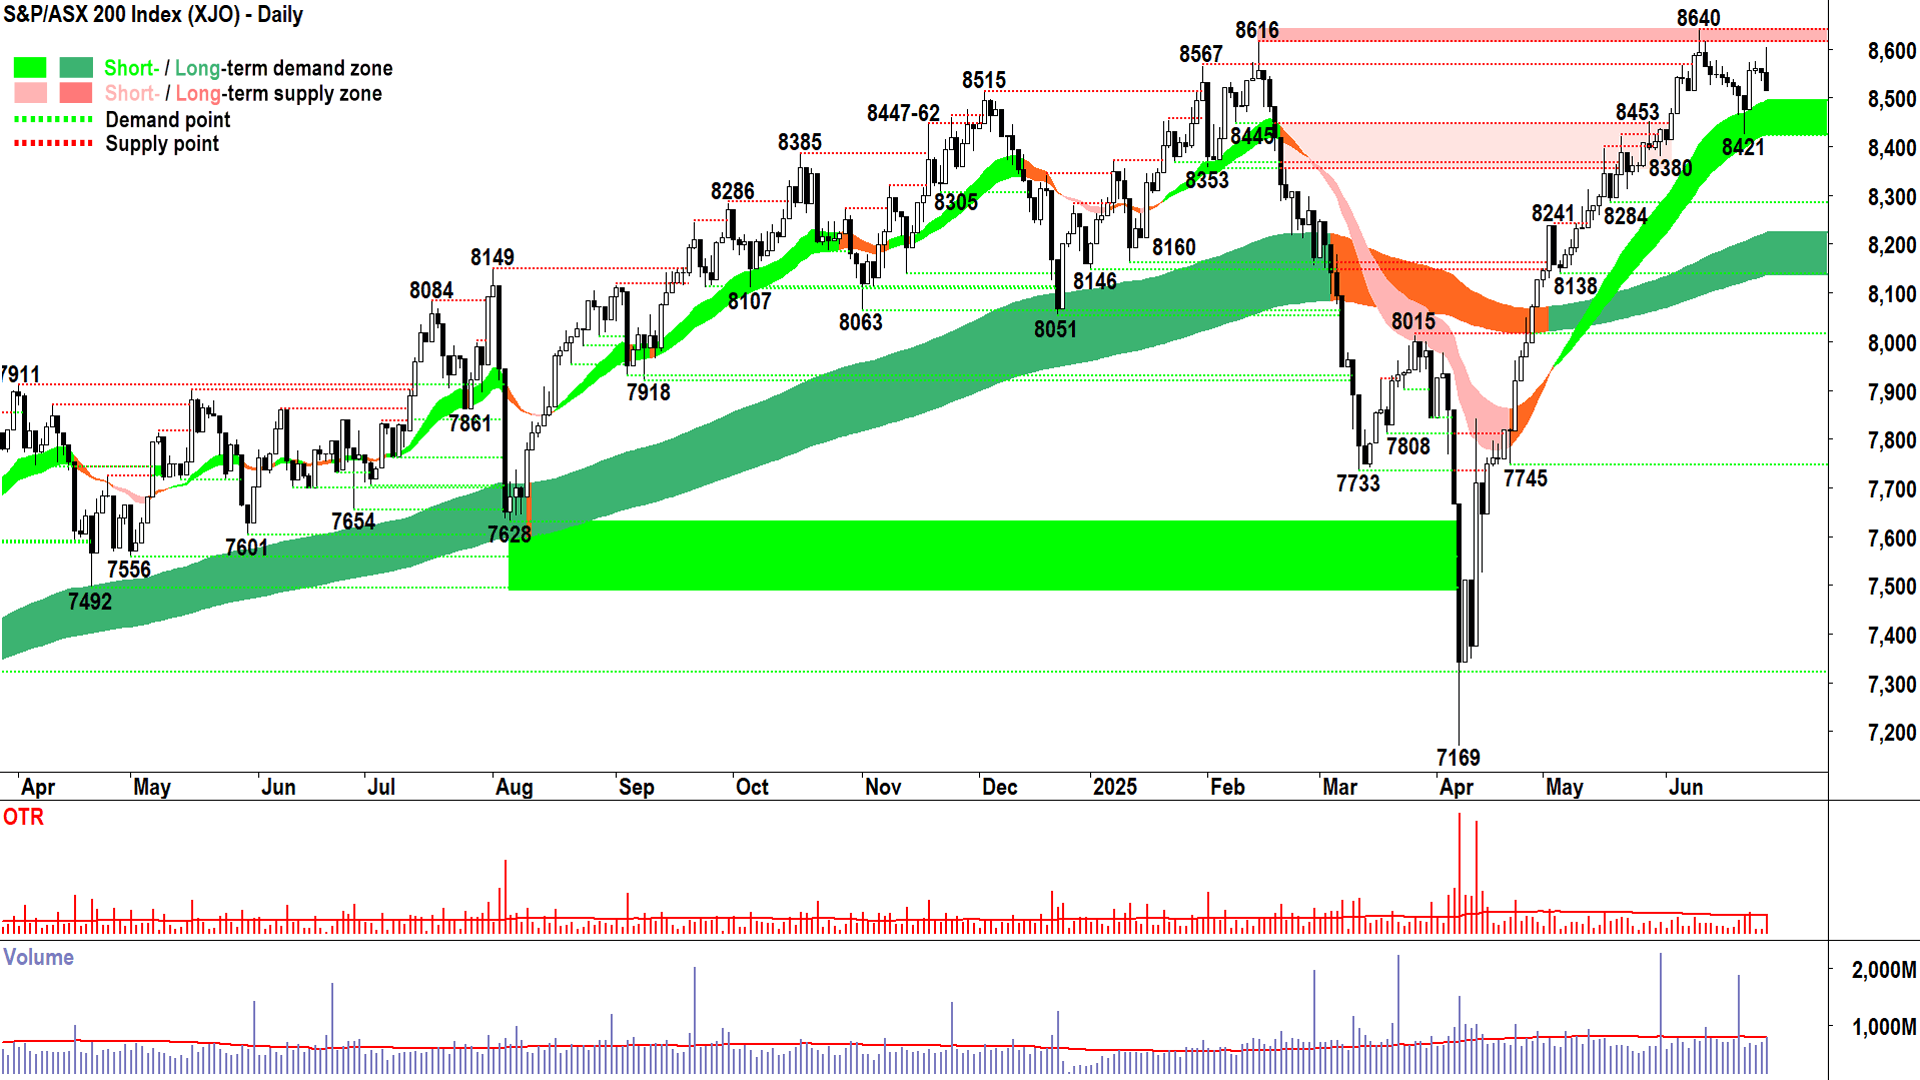
S&P/ASX 200 (XJO)
%20chart%2028%20Jul%202025.png)
B+ (click here for full size image)
If the Comp chart is an A+ the old Tin Pot would be a B+. Not terrible, but as is usually the case, could be much better!
I'm kind of glad I missed charting this one for the last month. Apart from the excitement of those two solid white candles on 17 & 18-Jul, it's been largely chop-chop.
But, credit where credit is due. Like the Comp, the XJO shows:
ST & LT trends = ⬆️/⬆️
Price action = Rising Peaks & Rising Troughs 📈
Candles = Predominantly demand-side (i.e., white-bodied and or downward pointing shadows)
= ✅✅✅
= Demand-side control
= Greater probability (but never certainty) that P continues to ⬆️
I see demand at the old supply zone of 8616-8640. It's roughly coinciding with the dynamic demand at the short term uptrend ribbon of 8580-8630.
Candles are decent enough overall, although I do note a few more of the longer-black-bodied nature compared to the Comp (less consensus / greater indecision!).
Hey, a B+ is still pretty good, right!?
I see supply at 8777, likely a serious level to contend with given it has been backed up with a lower peak at 8760.
In summary, I'm happy to back the short and long term trends here until I see something really sinister in the price action or candles (i.e., lower peaks or some very serious supply-side candles), or until a close below the short term uptrend ribbon.
Economy
Today
There weren't any major data releases in our time zone today
Later this week
Tuesday
No major data releases scheduled
Wednesday
00:00 USA JOLTS Job Openings June (7.49 million forecast vs 7.77 million previous)
00:00 USA Conference Board Consumer Confidence July (95.9 forecast vs 93.0 previous)
11:30 AUS Consumer Price Index June Quarter
Headline: +0.8% q/q and +2.1% p.a. vs +0.9% q/q and +2.1% p.a. in March
Trimmed Mean: +0.7% q/q forecast vs +0.7% p.a. in March
22:30 USA Advance GDP June Quarter (+2.4% p.a. forecast vs -0.5% p.a. (revised down from -0.3% p.a.) in March)
Thursday
04:00 USA Federal Funds Rate & Statement (no change at 4.50% forecast)
04:30 USA Federal Reserve Chairman Jerome Powell Press Conference
11:30 AUS Retail Sales June (+0.4% m/m vs +0.2% m/m in May)
11:30 AUS Building Approvals June (+1.7% m/m vs +3.2% m/m in May)
11:30 CHN Purchasing Managers Index (PMI) July (+1.7% m/m vs +3.2% m/m in May)
Manufacturing: 49.7 forecast vs 49.7 in June
Non-manufacturing: 50.3 forecast vs 50.5 in June
Tentative JPN BOJ Policy Rate, Monetary Policy Statement & Press Conference (unchanged at <0.50% forecast)
22:30 USA Core PCE June
Price Index: +0.3% m/m vs +0.2% m/m in May
Personal Income: +0.2% m/m vs -0.4% m/m in May
Personal Spending: +0.4% m/m vs -0.1% m/m in May
Friday
00:00 USA Non-Farm Payrolls July
Employment Change: +108,000 forecast vs 147,000 in June
Average Hourly Earnings: +0.3% forecast vs +0.2% in June
Unemployment Rate: 4.2% forecast vs 4.1% in June
Saturday
00:00 USA ISM Manufacturing PMI (49.5 forecast vs 49.0 previous)
Latest News
Interesting Movers
Trading higher
+14.1% Helloworld Travel (HLO) – HLO FY25 guidance update.
+12.8% Vection Technologies (VR1) – No news since 24-Jul Vection Wins $1m in AI Contracts, rise is consistent with prevailing short and long term uptrends ChartWatch 🔎📈
+9.9% Cyclone Metals (CLE) – No news since 24-Jul Quarterly Activities Report, rise is consistent with prevailing short and long term uptrends ChartWatch 🔎📈
+9.3% Imugene (IMU) – No news, bounced in the wake of the recent sharp selloff.
+8.5% Sun Silver (SS1) – No news since 24-Jul Investor Presentation, rise is consistent with prevailing short and long term uptrends ChartWatch 🔎📈
Trading lower
-44.0% Boss Energy (BOE) – June 2025 Quarterly Results Presentation and Honeymoon FY26 Guidance.
-18.1% Australian Strategic Materials (ASM) – Successful completion of Placement to raise A$13M.
-18.0% Coronado Global Resources (CRN) – No news, pulled back after Friday's sharp rally due to Q2 2025 Quarterly Report.
-11.7% Pilbara Minerals (PLS) – No news, general weakness across the broader Lithium sector today, benchmark September lithium contract closed limit down (-8%) today in China, reversing recent sharp gains.
-10.7% Bannerman Energy (BMN) – No news, general weakness across the broader Uranium sector today.
-10.3% Lotus Resources (LOT) – No news, general weakness across the broader Uranium sector today.
-9.4% Galan Lithium (GLN) – No news, general weakness across the broader Lithium sector today.
-9.0% Vulcan Energy Resources (VUL) – No news, general weakness across the broader Lithium sector today.
-8.4% Deep Yellow (DYL) – No news, general weakness across the broader Uranium sector today.
-8.0% Liontown Resources (LTR) – No news, general weakness across the broader Lithium sector today.
-7.7% Arafura Rare Earths (ARU) – No news, general weakness across the broader Resources sector today.
-7.3% Elsight (ELS) – Response to ASX Query.
-6.7% IGO (IGO) – No news, general weakness across the broader Lithium sector today.
-6.4% Mineral Resources (MIN) – No news, general weakness across the broader Lithium sector today.
-6.3% Novonix (NVX) – No news, general weakness across the broader Battery Materials sector today.
-5.1% Syrah Resources (SYR) – No news, general weakness across the broader Battery Materials sector today.
Broker Moves
The A2 Milk Company (A2M)
Retained at outperform at Macquarie; Price Target: $8.30 from $7.85
Aml3d (AL3)
Retained at buy at Shaw and Partners; Price Target: $0.400
ALS (ALQ)
Retained at buy at UBS; Price Target: $18.50
AMP (AMP)
Retained at buy at Citi; Price Target: $1.900
ANZ Group (ANZ)
Retained at neutral at Citi; Price Target: $27.50
Retained at equal-weight at Morgan Stanley; Price Target: $26.50
Retained at sell at UBS; Price Target: $26.50
ASX (ASX)
Retained at neutral at Citi; Price Target: $71.60
Bapcor (BAP)
Retained at neutral at Citi; Price Target: $3.90 from $5.43
Bendigo and Adelaide Bank (BEN)
Retained at equal-weight at Morgan Stanley; Price Target: $11.00 from $10.80
Retained at neutral at UBS; Price Target: $11.00
Boss Energy (BOE)
Retained at underweight at Morgan Stanley; Price Target: $3.25
Bank of Queensland (BOQ)
Retained at equal-weight at Morgan Stanley; Price Target: $6.60
Retained at sell at UBS; Price Target: $6.50
Commonwealth Bank of Australia (CBA)
Retained at sell at Citi; Price Target: $100.00
Retained at underweight at Morgan Stanley; Price Target: $129.00 from $128.00
Retained at sell at UBS; Price Target: $120.00
Challenger (CGF)
Retained at buy at Citi; Price Target: $9.20
Coles Group (COL)
Retained at overweight at Morgan Stanley; Price Target: $21.70
Computershare (CPU)
Retained at neutral at Citi; Price Target: $40.90
Coronado Global Resources (CRN)
Retained at underperform at Barrenjoey; Price Target: $0.190
Cleanaway Waste Management (CWY)
Retained at buy at UBS; Price Target: $3.20 from $3.30
Calix (CXL)
Retained at buy at Shaw and Partners; Price Target: $1.700
Downer EDI (DOW)
Retained at neutral at UBS; Price Target: $5.80
EVT (EVT)
Retained at buy at Citi; Price Target: $18.15 from $16.12
Fortescue (FMG)
Retained at overweight at Barrenjoey; Price Target: $20.00
Retained at neutral at Jarden; Price Target: $16.25 from $16.49
Downgraded to sell from neutral at UBS; Price Target: $17.40 from $16.20
Generation Development Group (GDG)
Retained at overweight at Morgan Stanley; Price Target: $6.25
Hub24 (HUB)
Retained at overweight at Morgan Stanley; Price Target: $115.00
Insurance Australia Group (IAG)
Retained at buy at Citi; Price Target: $10.00
Ikegps Group (IKE)
Retained at buy at Shaw and Partners; Price Target: $1.300 from $1.200
Iperionx (IPX)
Retained at buy at Bell Potter; Price Target: $7.90 from $6.25
Judo Capital (JDO)
Retained at overweight at Morgan Stanley; Price Target: $2.10
Lynas Rare Earths (LYC)
Retained at sell at Bell Potter; Price Target: $7.65 from $6.05
Retained at overweight at Morgan Stanley; Price Target: $12.15 from $11.00
Monadelphous Group (MND)
Retained at neutral at UBS; Price Target: $16.00
Medibank Private (MPL)
Retained at neutral at Citi; Price Target: $5.05
Macquarie Group (MQG)
Retained at neutral at UBS; Price Target: $225.00
Metcash (MTS)
Retained at equal-weight at Morgan Stanley; Price Target: $3.75
National Australia Bank (NAB)
Retained at sell at Citi; Price Target: $30.50
Retained at equal-weight at Morgan Stanley; Price Target: $35.40 from $35.00
Retained at neutral at UBS; Price Target: $37.50
Newmont Corporation (NEM)
Retained at overweight at Barrenjoey; Price Target: $115.00
Retained at outperform at Macquarie; Price Target: $109.00 from $106.00
Retained at buy at UBS; Price Target: $110.00 from $105.00
NIB (NHF)
Retained at neutral at Citi; Price Target: $6.95
Northern Star Resources (NST)
Retained at neutral at Jarden; Price Target: $15.10 from $19.40
Netwealth Group (NWL)
Retained at overweight at Morgan Stanley; Price Target: $41.50 from $29.75
Oneview Healthcare (ONE)
Retained at buy at Bell Potter; Price Target: $0.340 from $0.450
Pro Medicus (PME)
Retained at overweight at Morgan Stanley; Price Target: $320.00
Perpetual (PPT)
Retained at neutral at Citi; Price Target: $21.00
QBE Insurance Group (QBE)
Retained at buy at Citi; Price Target: $26.10
Qoria (QOR)
Downgraded to hold from buy at Shaw and Partners; Price Target: $0.520
Rio Tinto (RIO)
Retained at equal-weight at Morgan Stanley; Price Target: $118.00
Regal Partners (RPL)
Retained at buy at Bell Potter; Price Target: $3.55
Seek (SEK)
Retained at buy at Citi; Price Target: $28.50
Retained at outperform at Macquarie; Price Target: $27.00
SGH (SGH)
Retained at buy at UBS; Price Target: $60.00
Santana Minerals (SMI)
Retained at buy at Shaw and Partners; Price Target: $1.360
Step One Clothing (STP)
Retained at buy at Bell Potter; Price Target: $1.250 from $1.300
Strike Energy (STX)
Retained at speculative buy at Bell Potter; Price Target: $0.190 from $0.240
Super Retail Group (SUL)
Retained at overweight at Morgan Stanley; Price Target: $3.35
Suncorp Group (SUN)
Retained at neutral at Citi; Price Target: $22.40
Vault Minerals (VAU)
Retained at buy at Jarden; Price Target: $0.550 from $0.590
Westpac Banking Corporation (WBC)
Retained at sell at Citi; Price Target: $28.50
Retained at underweight at Morgan Stanley; Price Target: $27.50 from $37.30
Retained at buy at UBS; Price Target: $36.00
Whitehaven Coal (WHC)
Downgraded to hold from buy at Bell Potter; Price Target: $6.90 from $7.90
Downgraded to neutral from buy at Citi; Price Target: $7.10 from $7.00
Retained at neutral at Macquarie; Price Target: $7.00 from $5.50
Retained at overweight at Morgan Stanley; Price Target: $7.00
Worley (WOR)
Retained at buy at UBS; Price Target: $21.00 from $22.00
Woolworths Group (WOW)
Retained at underweight at Morgan Stanley; Price Target: $33.40
Xero (XRO)
Retained at overweight at Morgan Stanley; Price Target: $235.00
Scans
Top Gainers
Code | Company | Last | % Chg |
|---|---|---|---|
| JCS | Jcurve Solutions Ltd | $0.045 | +50.00% |
| NOX | Noxopharm Ltd | $0.097 | +29.33% |
| 8CO | 8COMMON Ltd | $0.021 | +23.53% |
| HTG | Harvest Technology Group Ltd | $0.017 | +21.43% |
| CMB | Cambium Bio Ltd | $0.32 | +20.76% |
Top Fallers
Code | Company | Last | % Chg |
|---|---|---|---|
| BOE | Boss Energy Ltd | $1.905 | -43.97% |
| SEQ | Sequoia Financial Group Ltd | $0.24 | -28.89% |
| NIM | Nimy Resources Ltd | $0.068 | -25.28% |
| SMM | Somerset Minerals Ltd | $0.014 | -22.22% |
| D3E | D3 Energy Ltd | $0.27 | -20.59% |
52 Week Highs
Code | Company | Last | % Chg |
|---|---|---|---|
| KCC | Kincora Copper Ltd | $0.072 | +18.03% |
| VR1 | Vection Technologies Ltd | $0.044 | +12.82% |
| RLT | Renergen Ltd | $1.345 | +10.25% |
| CLE | Cyclone Metals Ltd | $0.078 | +9.86% |
| QETH | Betashares Ethereum ETF | $41.93 | +8.49% |
52 Week Lows
Code | Company | Last | % Chg |
|---|---|---|---|
| BOE | Boss Energy Ltd | $1.905 | -43.97% |
| RIM | Rimfire Pacific Mining Ltd | $0.013 | -13.33% |
| HYT | Hyterra Ltd | $0.018 | -10.00% |
| AGE | Alligator Energy Ltd | $0.023 | -8.00% |
| TEE | Top End Energy Ltd | $0.037 | -7.50% |
Near Highs
Code | Company | Last | % Chg |
|---|---|---|---|
| ECF | Elanor Commercial Property Fund | $0.65 | -1.52% |
| OZBD | Betashares Australian Composite Bond ETF | $45.08 | -0.07% |
| DFND | Vaneck Global Defence ETF | $36.15 | +1.26% |
| WVOL | Ishares MSCI World Ex Aust Minimum Volatility ETF | $43.58 | +0.42% |
| IPX | Iperionx Ltd | $6.19 | -1.59% |
Relative Strength Index (RSI) Oversold
Code | Company | Last | % Chg |
|---|---|---|---|
| BOE | Boss Energy Ltd | $1.905 | -43.97% |
| SHV | Select Harvests Ltd | $3.47 | -0.86% |
| LSGE | Loomis Sayles Global Equity Fund - Active ETF | $2.40 | +0.84% |
| VTX | Vertex Minerals Ltd | $0.185 | -11.91% |
| BAP | Bapcor Ltd | $3.74 | +0.54% |
