News | Market Wraps
Evening Wrap: ASX 200 ekes win on strong iron ore, precious metals, lithium, uranium and rare earths stocks as banks falter
The S&P/ASX 200 closed 5.0 points higher, up 0.06%.

Mentioned
The S&P/ASX 200 closed 5.0 points higher, up 0.06%.
Aussie stocks edged higher, but the 5 point gain hid some potential issues that may come back to bite investors over the next few sessions.
There were strong performances from Resources (XJR) (+2.5%) – powered by gains in the iron ore majors ✅, Gold (XGD) (+2.8%) ✅, silver stocks ✅, uranium stocks ✅, lithium stocks ✅, and critical minerals stocks ✅ (um what wasn't good today in Resources!?) – Energy (XEJ) (+1.1%), and Real Estate (XPJ) (+0.9%).
But nearly more than balancing these out, there were rather soggy performances from Financials (XFJ) (-1.2%) and Consumer sectors, Discretionary (XDJ) (-0.9%) and Staples (XSJ) (-0.8%).
This was a distinct push and pull day, and it could mark a potential departing of ways of some of the major sectors 💔.
To make sense of all the above, I have detailed technical analysis on the Nasdaq Composite, the S&P/ASX 200, Lithium Carbonate and Uranium in today's ChartWatch.
Be sure to click/scroll through for the usual reporting of the major sector and stock-specific moves, the broker responses to them, as well as all the key economic data in tonight's Evening Wrap.
Let's dive in!
Today in Review
Mon 25 Aug 25, 5:09pm (AEST)
Name | Value | % Chg |
|---|---|---|
Major Indices | ||
| ASX 200 | 8,972.4 | +0.06% |
| All Ords | 9,245.0 | +0.12% |
| Small Ords | 3,565.5 | +1.75% |
| All Tech | 4,300.6 | -0.08% |
| Emerging Companies | 2,533.9 | +1.36% |
Currency | ||
| AUD/USD | 0.6502 | +0.16% |
US Futures | ||
| S&P 500 | 6,477.5 | -0.09% |
| Dow Jones | 45,682.0 | -0.07% |
| Nasdaq | 23,539.75 | -0.13% |
Name | Value | % Chg |
|---|---|---|
Sector | ||
| Materials | 18,002.3 | +2.72% |
| Energy | 9,299.3 | +1.12% |
| Real Estate | 4,199.5 | +0.79% |
| Health Care | 40,241.1 | +0.36% |
| Information Technology | 2,996.5 | +0.27% |
| Utilities | 10,124.4 | -0.46% |
| Industrials | 8,670.4 | -0.62% |
| Communication Services | 1,964.9 | -0.67% |
| Consumer Staples | 12,525.2 | -0.78% |
| Consumer Discretionary | 4,542.3 | -0.91% |
| Financials | 9,655.0 | -1.18% |
Markets
%20intraday%20chart_25%20Aug.png)
ASX 200 Session Chart
The S&P/ASX 200 (XJO) finished 5.0 points higher at 8,972.4, 0.92% from its session high and just 0.07% from its low ⚠️. But despite the washout from the high, the market breadth in the broader-based S&P/ASX 300 (XKO) was still commendable as advancers beat decliners by a tidy 193 to 87 💪.
When I use a ⚠️ and 💪 emoji in the above paragraph, clearly there's been some push and pull in the market. The substantial reversal from today's early session high – an all time high mind you – will no doubt grab the attention of those of you who've fine tuned your ChartWatch senses. It's a warning sign – it suggests sell the rally activity.
But the market breadth tells a different story, it really wasn't all that bad today – depending on which sector you were in – that is. And today, it seems that we've picked up again with the rotation from banks / Financials (XFJ) (-1.2%) into Resources (XJR) (+2.5%) and Energy (XEJ) (+1.1%), and Real Estate (XPJ) (+0.9%).
It's a theme I'd thought we'd dispensed with after the recent strong recovery in banking stocks (sans-CBA) as logged / charted in ChartWatch ASX Scans. Today's price action suggests it might be back on, as much of the intraday chart shown above for the XJO was simply "big bank drag" (i.e., they are identical!!!).

XFJ intraday chart 📉
Now check out the intraday charts of Resources and Energy in comparison... 🧐

XJR intraday chart 📈

XEJ intraday chart 📈
It's also worth noting other sectors that got tagged in today's rotation as potential targets through the week...

XHJ intraday chart 📉

XIJ intraday chart 📉

XDJ intraday chart 📈
And the plus 1 that prospered today with Resources and Energy, a very strong Real Estate (XPJ) (+0.9%) sector.

Today's best blue chip gainers
Company | Last Price | Change $ | Change % | 1mo % | 1yr % |
|---|---|---|---|---|---|
Ansell (ANN) | $34.53 | +$3.23 | +10.3% | +11.6% | +19.9% |
Block (XYZ) | $122.29 | +$7.29 | +6.3% | +1.1% | +26.4% |
Sandfire Resources (SFR) | $12.64 | +$0.63 | +5.2% | +14.3% | +43.8% |
James Hardie (JHX) | $31.80 | +$1.3 | +4.3% | -22.7% | -37.7% |
Lynas Rare Earths (LYC) | $14.86 | +$0.55 | +3.8% | +38.5% | +118.2% |
IGO (IGO) | $5.31 | +$0.19 | +3.7% | -0.9% | +0.6% |
Mineral Resources (MIN) | $37.01 | +$1.32 | +3.7% | +14.5% | -19.5% |
Evolution Mining (EVN) | $8.39 | +$0.28 | +3.5% | +14.9% | +93.3% |
Perseus Mining (PRU) | $3.72 | +$0.12 | +3.3% | +4.5% | +42.5% |
South32 (S32) | $2.93 | +$0.09 | +3.2% | -3.9% | -2.7% |
Life360 (360) | $46.48 | +$1.42 | +3.2% | +21.7% | +147.9% |
Whitehaven Coal (WHC) | $6.73 | +$0.2 | +3.1% | -3.2% | -6.5% |
Hub24 (HUB) | $112.46 | +$3.12 | +2.9% | +7.6% | +110.0% |
Northern Star Resources (NST) | $18.57 | +$0.51 | +2.8% | +17.5% | +24.6% |
BHP Group (BHP) | $43.14 | +$1.14 | +2.7% | +5.7% | +5.5% |
Fortescue (FMG) | $20.00 | +$0.5 | +2.6% | +9.0% | +11.3% |
Rio Tinto (RIO) | $115.42 | +$2.71 | +2.4% | -2.9% | +3.1% |
Pilbara Minerals (PLS) | $2.16 | +$0.05 | +2.4% | +12.2% | -26.5% |
Telix Pharmaceuticals (TLX) | $18.76 | +$0.43 | +2.3% | -11.7% | -6.1% |
Light & Wonder (LNW) | $144.10 | +$2.85 | +2.0% | -2.4% | -9.1% |
Today's worst blue chip losers
Company | Last Price | Change $ | Change % | 1mo % | 1yr % |
|---|---|---|---|---|---|
Reece (REH) | $11.76 | -$2.31 | -16.4% | -12.6% | -55.1% |
Computershare (CPU) | $37.43 | -$2.04 | -5.2% | -6.7% | +33.5% |
Suncorp Group (SUN) | $21.19 | -$0.63 | -2.9% | +4.3% | +19.3% |
Insurance Australia (IAG) | $8.44 | -$0.23 | -2.7% | -0.4% | +16.9% |
Wesfarmers (WES) | $92.13 | -$2.5 | -2.6% | +11.8% | +23.2% |
Steadfast Group (SDF) | $6.13 | -$0.15 | -2.4% | +5.3% | -5.3% |
Lendlease Group (LLC) | $5.42 | -$0.12 | -2.2% | +4.4% | -12.2% |
QBE Insurance Group (QBE) | $21.12 | -$0.46 | -2.1% | -6.3% | +31.4% |
Sonic Healthcare (SHL) | $24.12 | -$0.48 | -2.0% | -14.1% | -13.0% |
National Australia Bank (NAB) | $41.71 | -$0.76 | -1.8% | +11.2% | +13.3% |
Westpac Banking Corp. (WBC) | $38.29 | -$0.69 | -1.8% | +15.9% | +26.5% |
Wisetech Global (WTC) | $110.74 | -$1.85 | -1.6% | -7.8% | +20.3% |
Woolworths Group (WOW) | $32.61 | -$0.51 | -1.5% | +6.4% | -6.8% |
JB HI-FI (JBH) | $116.33 | -$1.76 | -1.5% | +10.7% | +53.4% |
Commonwealth Bank (CBA) | $170.30 | -$2.54 | -1.5% | -1.5% | +25.2% |
Endeavour Group (EDV) | $4.14 | -$0.06 | -1.4% | +0.2% | -24.3% |
Qube (QUB) | $4.24 | -$0.06 | -1.4% | -1.9% | +10.4% |
ANZ Group (ANZ) | $33.40 | -$0.47 | -1.4% | +10.5% | +11.5% |
Medibank Private (MPL) | $5.15 | -$0.07 | -1.3% | +4.3% | +31.4% |
Qantas Airways (QAN) | $11.15 | -$0.15 | -1.3% | +2.9% | +85.0% |
ChartWatch
Nasdaq Composite Index

Nasdaq Composite Index chart (click here for full size image)
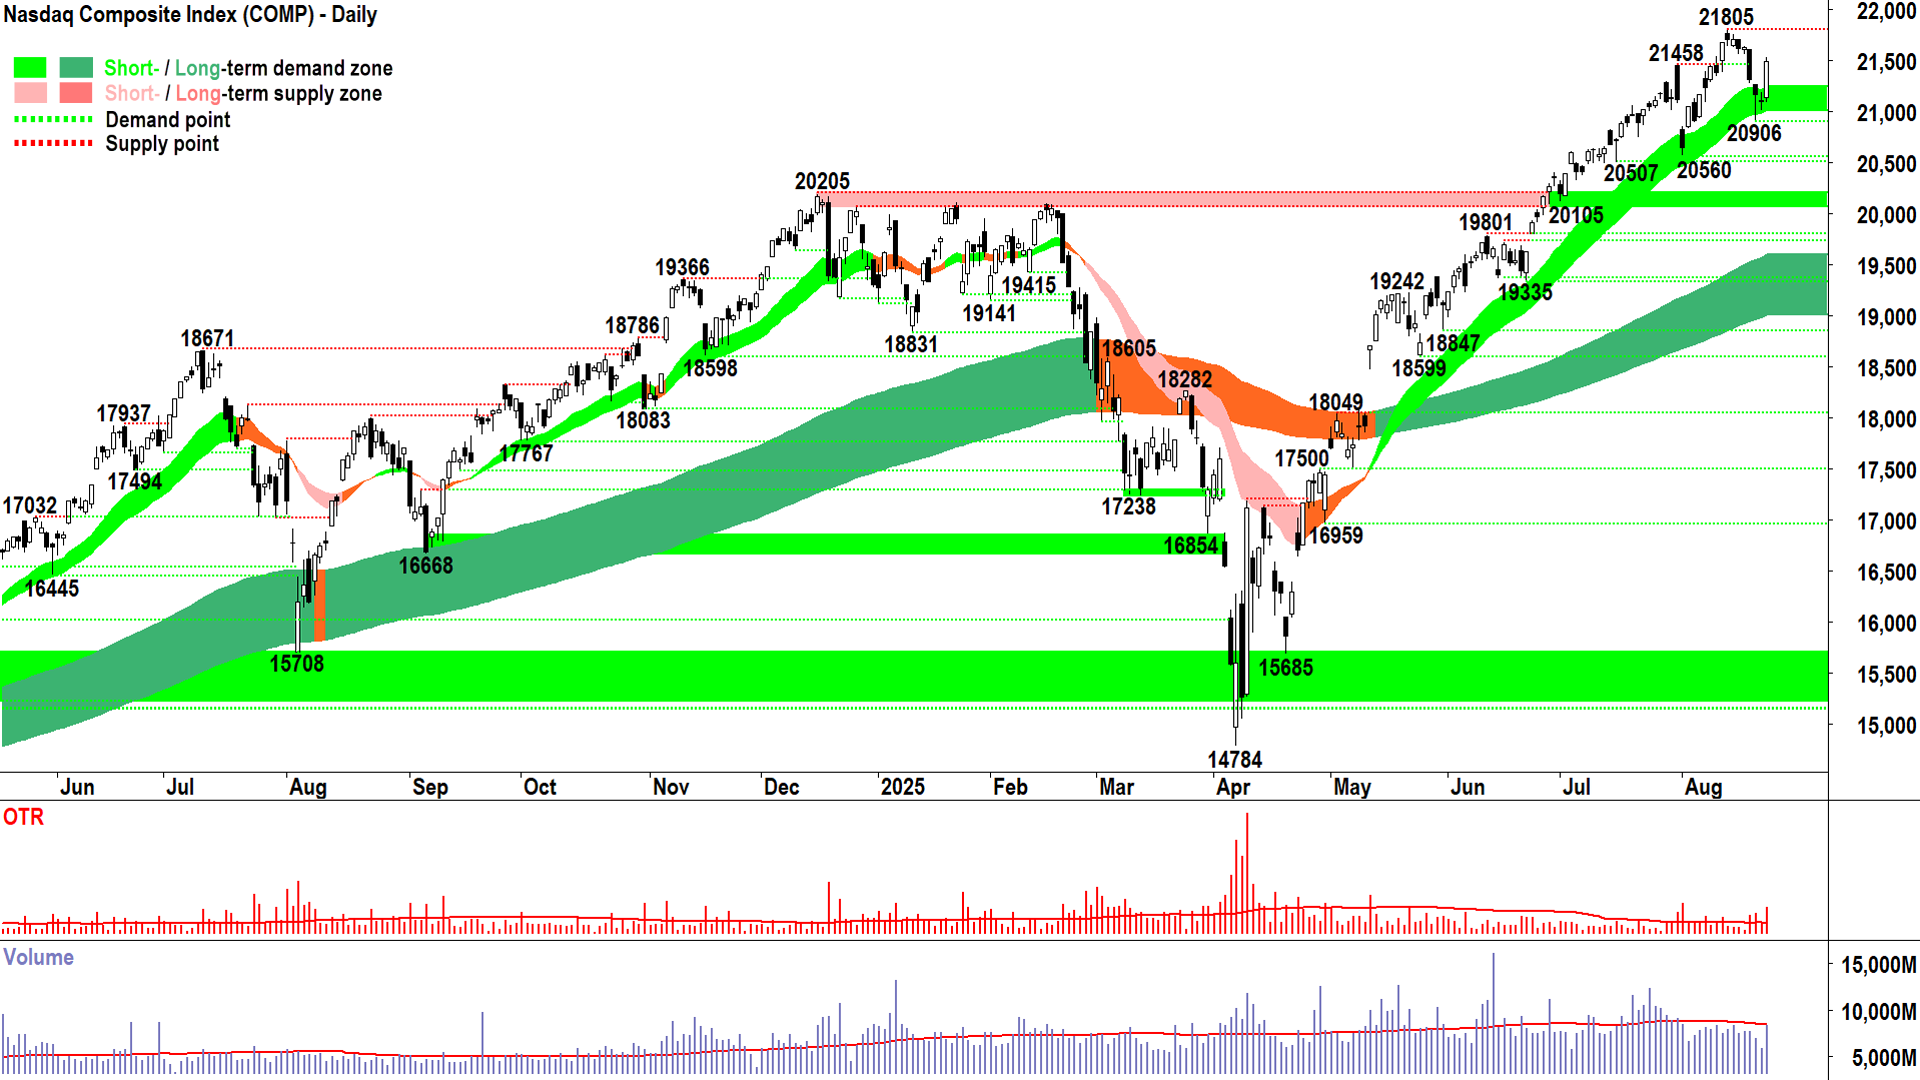
What a difference a little bit of certainty made for the Comp’s chart!
Last week was a dour affair, honestly, it was a painful cluster of nothing candle-and-volume combinations 😭. The impediment, of course, was one Mr Jerome Powell and the Jackson Hole Symposium – it looks like we got the all-clear on that one.
But last week was a great example of how the price action and volume responds to uncertainty: You get thin trading, and volatility that can often be misleading with respect to the overall trend.
Fortunately for us, well, firstly we’re very good at reading candles and volume (😁), and secondly, we never lost faith in the broader short and long term technical indicators – which never shifted from indicating both short and long term demand-side control.
Friday’s long, white bodied candle, with its near-session high close – is a picture of excess demand. It is also encouraging to see volume back to average. The demand-side returned and also shifted a bit of supply out of the way. Good 👍.
You’ll remember my greatest concern last week was the possibility that the demand-side had run out of ammunition. I suggest Friday does a good way towards putting pay to that concern.
But we’d love some follow up this week – more long white candles and or downward pointing shadows to confirm the demand-side has taken back up the reigns and is driving the price action higher. We’d particularly like to see such candles push deep into the 21805 point of supply – to indicate that it’s hardly anything to worry about.
It’s also great to see that the short term uptrend ribbon is doing its job, i.e., acting as a zone of dynamic demand. It’s been 100% reliable since it commenced back in May, and its typical reliability is the reason why you see me write in every update: “The short term trend is intact until the price closes below the short term uptrend ribbon”.
I won’t write that again tonight… because I just did.
In summary, this week we’re going to watch carefully the candles near 21805. I’ve told you what I want to see… you should know by now what I don’t want to see (i.e., black-bodied candles and or those with upward pointing shadows). We also don’t want to see a lower peak to 21085, and we definitely don’t want to see a close below 20906 = ⚠️.
Until then, as I suggested throughout last week’s shenanigans: Stay the course, FRP.
S&P/ASX 200 (XJO)
%20chart_25%20Aug.png)
S&P/ASX 200 chart (click here for full size image)
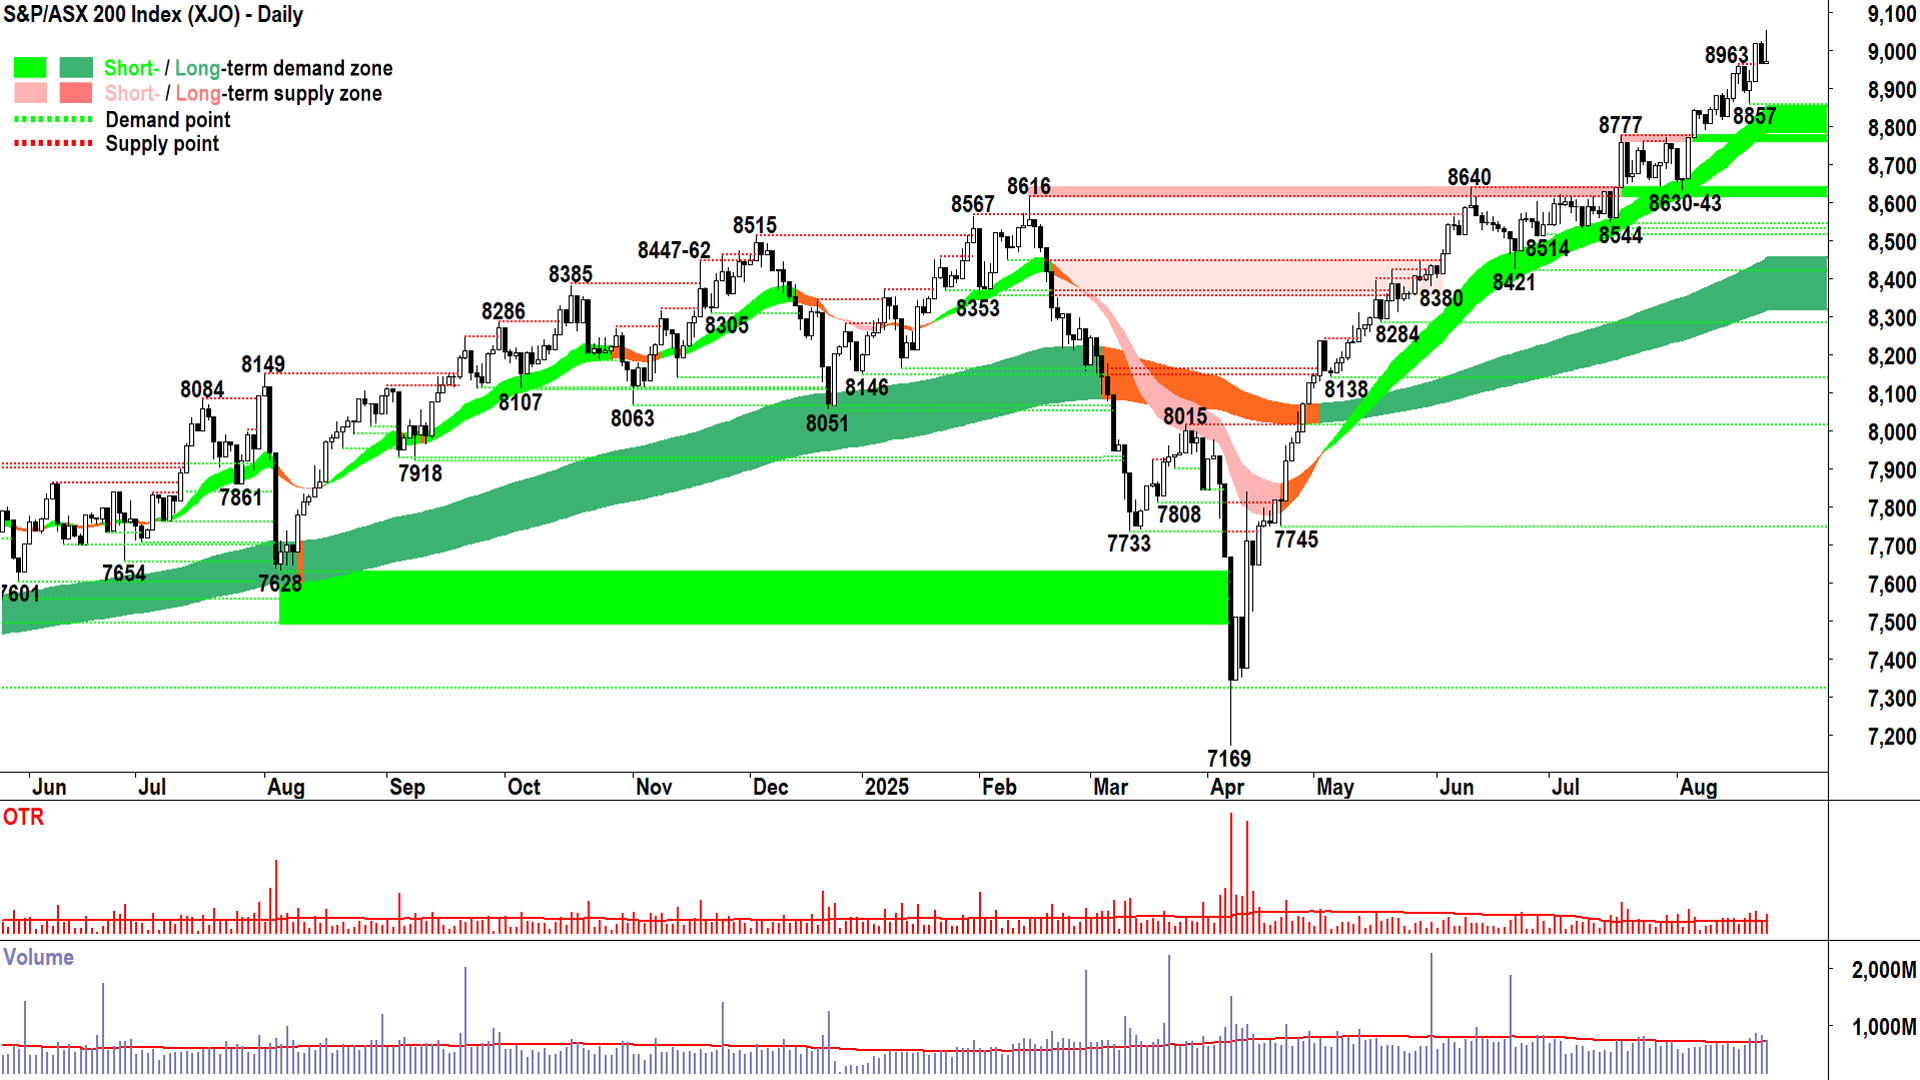
The non-technical analysis-based news services are going to report today as a small win for Aussie investors – hey, the benchmark ASX 200 closed up, right!? 🤔
You know better 🧐!!!
You know today was NOT a good day in terms of the demand-supply environment demonstrating confidence in Aussie stocks, but the opposite.
I do note, however, the very solid market breadth today (193 ⬆️ to 87 ⬇️). Add in those intraday charts and sector rotations and it smacks more of fund manager shenanigans than of something really concerning at this point... But if the big banks are about to dip – as flagged by their reversal today – it will make it difficult for the broader index to progress simply because of their massive weighting.
If we just focus on that candle, and what it potentially means, then we must consider that:
Confidence equals buy the dip. Start low, finish high.
Trepidation, can I go so far as to say strategically bearish behaviour, equals sell the rally. Start high, finish low.
So, today’s long upward pointing shadow is of some concern. I despise such a pattern into new highs, which is what occurred (today’s session high was an all time high).
But many of you are probably already anticipating what I’m going to say next. One candle (unless it’s a really bloody big one on massive volume!!!) does not a reversal make.
First, we must remind ourselves of the need to continue to trust the broader short and long term uptrends, plus the price action – which are both exemplary. Secondly, we shall await confirmation. So, that’s another supply-side candle or cluster of them, a lower peak to today’s high of 9055, the removal of demand at 8857, or a close below the short term uptrend ribbon.
In the absence of those, it will no doubt be a return to business as usual soon enough. So, “alert not alarmed” is probably the best way to describe our current state. Yes, it was a disappointing day, but one we’ll take in our stride. Stay the course, FRP.
Lithium Carbonate Futures (Benchmark month, back-adjusted) GFEX

An interesting chart (click here for full size image)
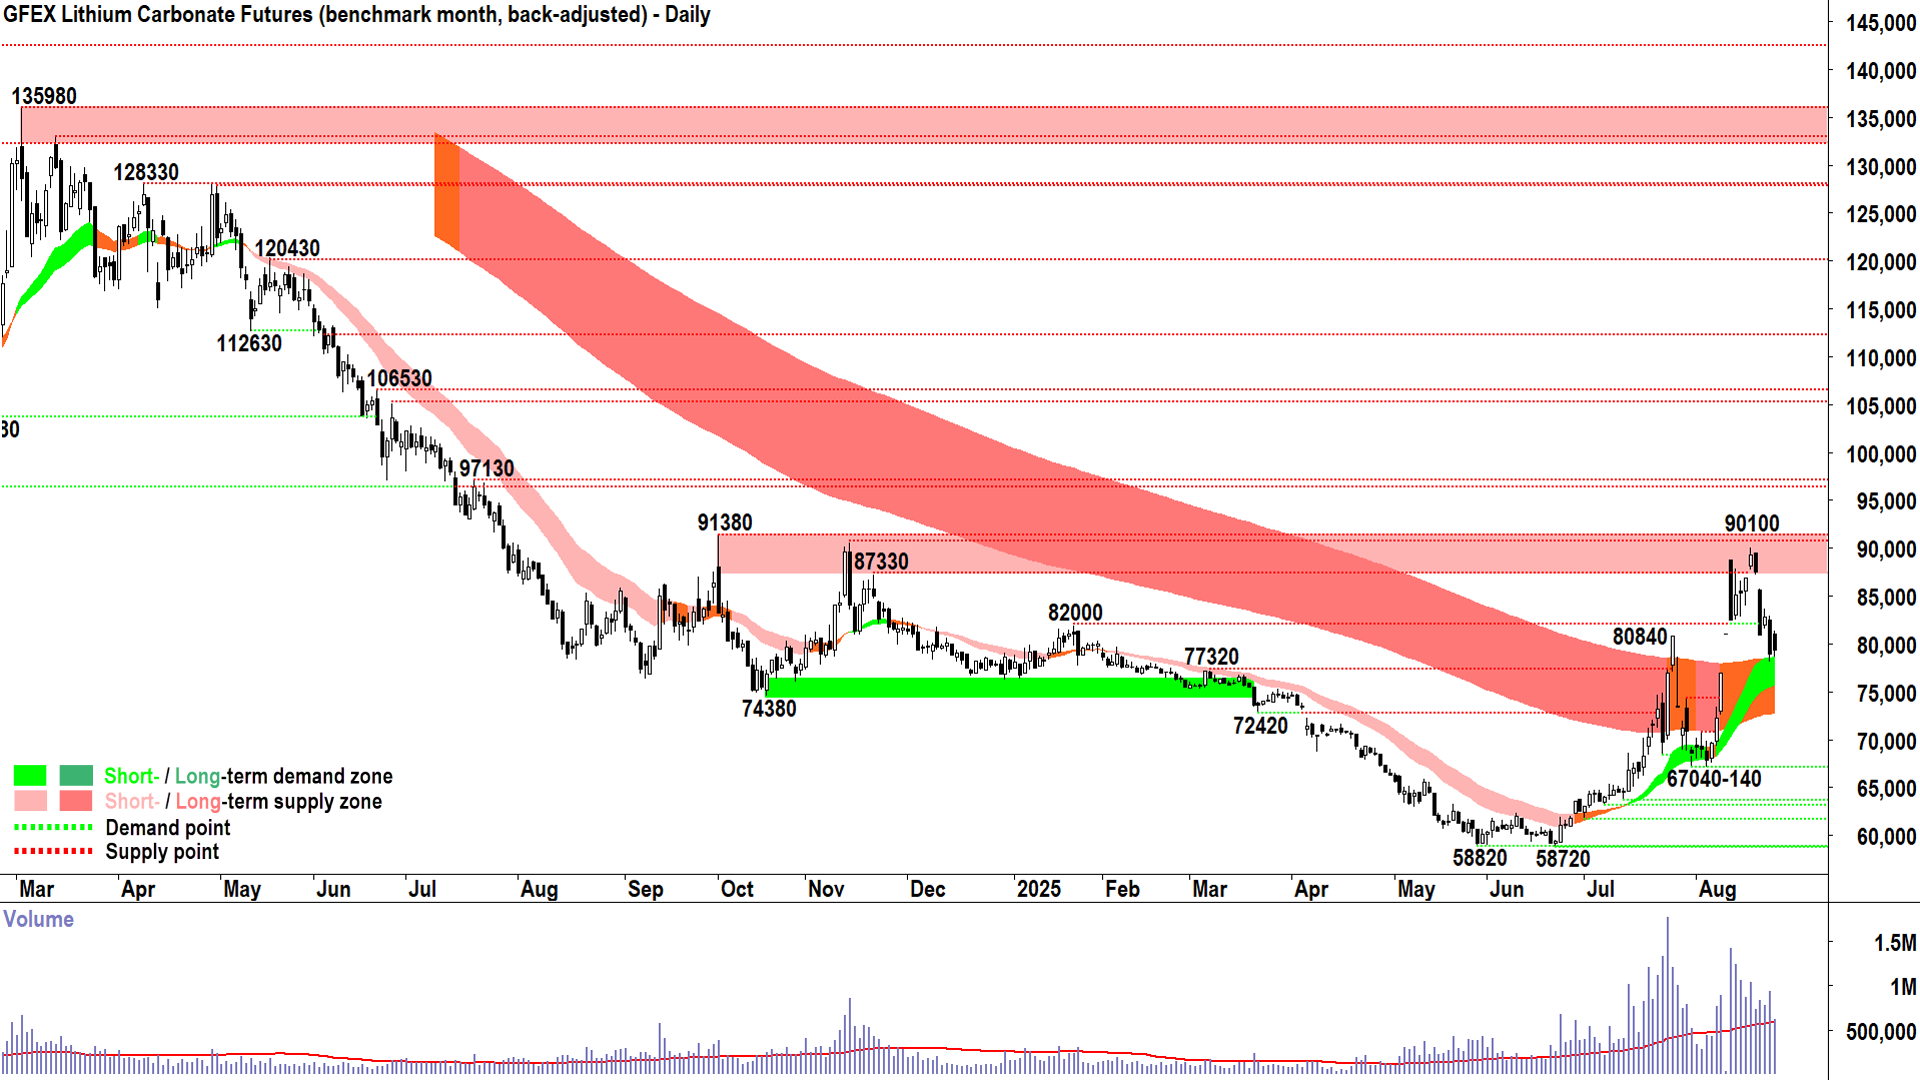
Just a super-quick update here, because I chose to deliver a detailed technical analysis update for GFEX lithium carbonate in a dedicated article this morning.
I'm simply drawing your attention to the one more candle we now have the benefit of perusing 🧐.
And, lithium bulls, it's not the candle you wanted 😭!
You wanted a long white-bodied candle and or a long downward pointing shadow reaching deep into the dynamic demand of the short and long term trend ribbons – thus confirming them as a zone of dynamic demand.
It wasn't to be today, but at least we didn't see a deeper probe of the trend ribbons. The supply-side has control of the short term price here and I suggest time is running out for bulls – you want to see a strong rally as soon as possible or the faith of the devoted will be tested! 🙏
Uranium Futures (Front month, back-adjusted) COMEX
%20COMEX%20chart_22%20Aug.png)
An interesting chart (click here for full size image)
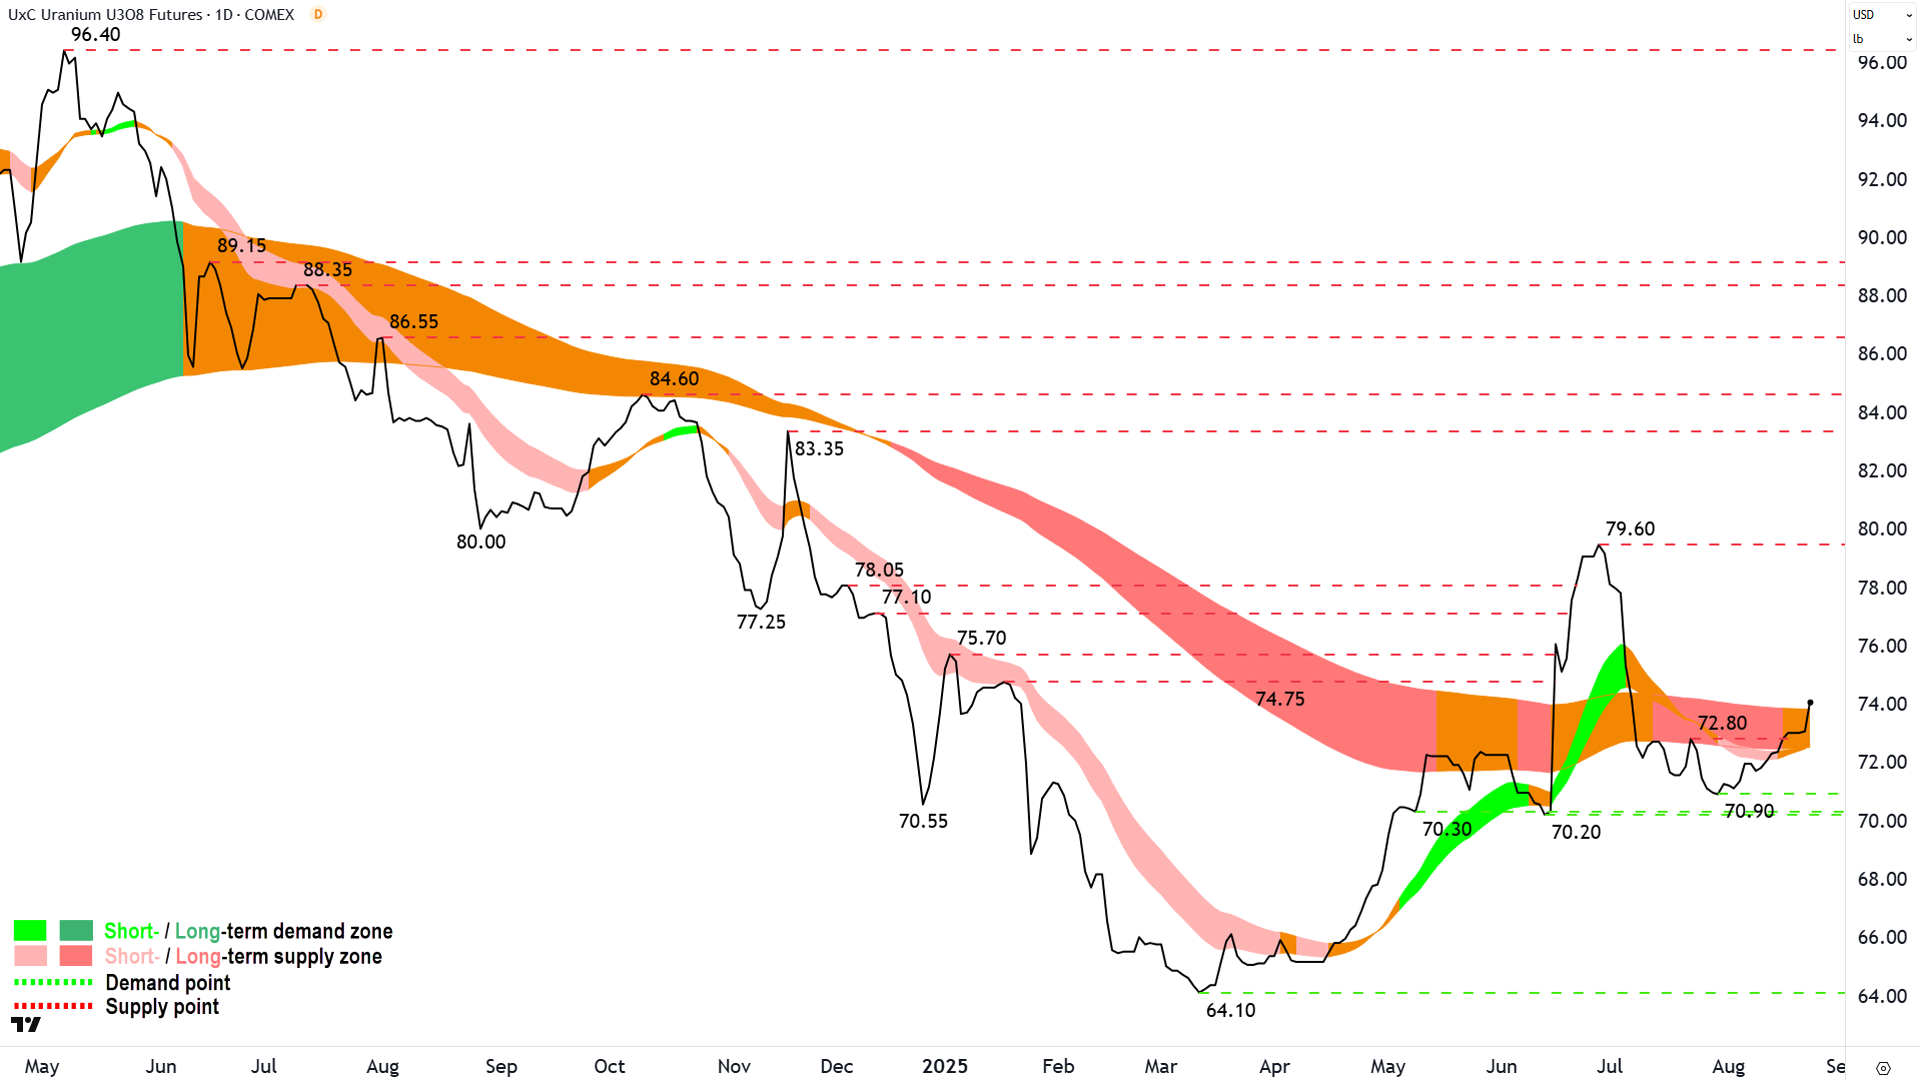
The last time we covered uranium was in ChartWatch in the Evening Wrap on 30 July.
In that update, we were lamenting the demise of its very promising first half rally. The price action had slipped back below the long term trend ribbon – which had reverted to down – and the short term trend had neutralised.
Two peaks below the long term trend ribbon suggested it had transitioned back to a zone of dynamic supply – a typical indicator that a long term downtrend had resumed...
Not great 👎.
But I have some good news! The uranium price has very gradually hauled itself off the canvas (i.e., demand support at 70.20-70.30) and as of Friday’s close – it has reclaimed a place above the long term trend ribbon ✅.
Before uranium bulls get too excited, though, short term and long term trends are very much neutral, and the price action since the last point of demand at 70.90 is gentle at best.
So, we are seeing the result of “a bit” of excess demand has returned to the system 🤏.
It’s a start, and the next few sessions will help determine if this rally has any legs. Ideally, we continue to see rising peaks and rising troughs – but more importantly – a steepening of the short term trend is required to signal the demand-side is really engaging.
Even more ideally, such a steepening would flick the short term trend ribbon back to up (light green), and we also see a trough set at or above the long term trend ribbon. The latter, which implies the long term uptrend ribbon’s transition back to a zone of dynamic demand – is critical.
I’m happy to entertain the bull case here until I see a lower peak / lower peak and trough, or until the price closes back below the long term trend ribbon. Going one step further, you’ll know this fledgling rally is done and dusted if the uranium price closes below 70.20 = 🌵💀⚰️⚠️.
Economy
Today
There weren't any major economic data releases in our time zone today
Later this week
Tuesday
00:00 USA July New Home Sales (635,000 forecast vs 627,000 in June)
11:30 AUS August RBA Board / Monetary Policy Meeting Minutes
22:30 USA July Core Durable Goods Orders (+0.3% m/m forecast vs +0.2% m/m in June)
Wednesday
00:00 USA Conference Board August Consumer Confidence (96.3 forecast vs 97.2 in July)
11:30 AUS July Consumer Price Index ("CPI") (+2.3% p.a. vs +1.9% p.a. in June)
Thursday
22:30 Prelim June Quarter GDP (+3.1% p.a. forecast vs +3.0% p.a. in March Quarter)
Friday
00:00 USA July New Home Sales (635,000 forecast vs 627,000 in June)
22:30 USA July Personal Consumption Expenditures ("PCE")
Core PCE Price Index: +0.3% m/m forecast vs +0.3% m/m in June
Personal Income: +0.4% m/m forecast vs +0.3% m/m in June
Personal Spending: +0.5% m/m forecast vs +0.3% m/m in June
Latest News
Interesting Movers
Trading higher
+42.2% Locksley Resources (LKY) – Transformative Partnership to Fast Track Antimony Processing, rise is consistent with prevailing short and long term uptrends, a regular in ChartWatch ASX Scans Uptrends list 🔎📈
+20.2% Aussie Broadband (ABB) – ABB FY25 Results - Investor Presentation, rise is consistent with prevailing short and long term uptrends, a regular in ChartWatch ASX Scans Uptrends list 🔎📈
+18.2% Decidr Ai Industries (DAI) – DAI to Acquire Remaining 49% Interest in Decidr.ai.
+15.0% IPD Group (IPG) – FY25 Investor Presentation.
+13.3% Sun Silver (SS1) – 65m of Antimony zones with grades up to 7.8% Sb, general strength across the broader Silver sector today.
+13.2% Megaport (MP1) – No news since 22-Aug FY25 Full Year Investor Presentation, rise is consistent with prevailing short and long term uptrends, a regular in ChartWatch ASX Scans Uptrends list 🔎📈
+13.0% Falcon Metals (FAL) – No news, rise is consistent with prevailing short and long term uptrends, a regular in ChartWatch ASX Scans Uptrends list 🔎📈
+12.9% Waratah Minerals (WTM) – Becoming a substantial holder, rise is consistent with prevailing short and long term uptrends, a regular in ChartWatch ASX Scans Uptrends list 🔎📈
+12.2% West Coast Silver (WCE) – No news since 22-Aug High Grade Shallow Silver Intercepts at Elizabeth Hill, rise is consistent with prevailing short and long term uptrends, a regular in ChartWatch ASX Scans Uptrends list 🔎📈
+12.2% LTR Pharma (LTP) – SPONTAN Case Series - Strong Post-Prostatectomy Results.
+10.6% Smart Parking (SPZ) – No news, rise is consistent with prevailing short and long term uptrends 🔎📈
+10.5% WA1 Resources (WA1) – No news 🤔.
+10.4% Caprice Resources (CRS) – No news, rise is consistent with prevailing short and long term uptrends, a regular in ChartWatch ASX Scans Uptrends list 🔎📈
+10.3% Ansell (ANN) – FY25 Full Year Results.
+10.0% DUG Technology (DUG) – Continued positive response to 22-Aug FY25 Results Presentation.
+9.9% Unico Silver (USL) – No news, general strength across the broader Silver sector today.
+9.3% Regis Resources (RRL) – No news since 22-Aug Full Year Results Presentation.
+9.3% Aurum Resources (AUE) – No news, rise is consistent with prevailing short and long term uptrends, a regular in ChartWatch ASX Scans Uptrends list 🔎📈
+9.1% Alligator Energy (AGE) – Samphire Field Recovery Trial PEPR Approved, general strength across the broader Uranium sector today.
+9.1% Polynovo (PNV) – FY25 Results Presentation.
+9.0% MTM Critical Metals (MTM) – REE Processing Strategy Expanded with Next-Gen Separation.
+8.8% Aurelia Metals (AMI) – No news 🤔.
+8.7% Andean Silver (ASL) – No news, general strength across the broader Silver sector today.
+8.3% Lindian Resources (LIN) – No news, rise is consistent with prevailing short and long term uptrends, a regular in ChartWatch ASX Scans Uptrends list 🔎📈
+8.3% Navigator Global Investments (NGI) – 2025 Annual Results Presentation, rise is consistent with prevailing short and long term uptrends, a regular in ChartWatch ASX Scans Uptrends list 🔎📈
+8.1% Nanoveu (NVU) – Nanoveu Establishes Key U.S. Sales Network, rise is consistent with prevailing short and long term uptrends, a regular in ChartWatch ASX Scans Uptrends list 🔎📈
+7.7% Alkane Resources (ALK) – Continued positive response to 22-Aug Appendix 4E and Full Year Statutory Accounts, rise is consistent with prevailing short and long term uptrends, a regular in ChartWatch ASX Scans Uptrends list 🔎📈
+7.5% Praemium (PPS) – FY2025 Full-Year Results Presentation.
+7.5% Zip Co. (ZIP) – Continued positive response to 22-Aug N, rise is consistent with prevailing short and long term uptrends, a regular in ChartWatch ASX Scans Uptrends list 🔎📈
+6.1% Lotus Resources (LOT) – No news, general strength across the broader Uranium sector today.
+6.0% Bannerman Energy (BMN) – No news, general strength across the broader Uranium sector today.
+6.0% BetaShares Global Uranium ETF (URNM) – No news, general strength across the broader Uranium sector today, Uranium sector ETF.
Trading lower
-16.4% Reece (REH) - FY25 Investor Presentation, fall is consistent with prevailing short and long term downtrends, one of the most Featured (highest conviction) stocks in ChartWatch ASX Scans Downtrends list 🔎📉
-14.8% Meteoric Resources (MEI) - Caldeira Project Update on Environmental Licence Process.
-14.7% EVT (EVT) - Year End Results Presentation.
-10.2% Lindsay Australia (LAU) - FY2025 Results investor Presentation.
-8.6% Lake Resources (LKE) - Notification of Company Presentation.
-8.1% Resolute Mining (RSG) - No news since 22-Aug Half Year Financial Results and Accounts.
-7.0% Imugene (IMU) - No news, fall is consistent with prevailing short and long term downtrends, one of the most Featured (highest conviction) stocks in ChartWatch ASX Scans Downtrends list 🔎📉
-5.8% Step One Clothing (STP) - No news, ex-div $0.024 fully franked.
-5.5% Stanmore Resources (SMR) - 2025 Half Year Financial Results Investor Presentation.
-5.1% Nuix (NXL) - FY25 Financial Results Presentation, fall is consistent with prevailing short and long term downtrends, a regular in ChartWatch ASX Scans Downtrends list 🔎📉
Broker Moves
Abacus Group (ABG)
Retained at buy at Citi; Price Target: $1.35
Alkane Resources (ALK)
Retained at accumulate at Ord Minnett; Price Target: $1.00
Ama Group (AMA)
Retained at buy at Bell Potter; Price Target: $0.13 from $0.12
Retained at accumulate at Morgans; Price Target: $0.11 from $0.12
Ansell (ANN)
Retained at outperform at RBC Capital Markets; Price Target: $34.00 from $41.00
Aspen Group (APZ)
Downgraded to hold from buy at Moelis Australia; Price Target: $4.43 from $3.83
Accent Group (AX1)
Retained at buy at Citi; Price Target: $1.83 from $1.67
Retained at overweight at Morgan Stanley; Price Target: $1.95
Upgraded to buy from hold at Morgans; Price Target: $1.65 from $1.85
Retained at buy at UBS; Price Target: $1.70 from $1.80
Antipa Minerals (AZY)
Retained at speculative buy at Canaccord Genuity; Price Target: $1.10 from $1.04
Bendigo and Adelaide Bank (BEN)
Retained at sell at Citi; Price Target: $9.75
Bega Cheese (BGA)
Retained at outperform at CLSA; Price Target: $5.25 from $5.50
Retained at positive at E&P; Price Target: $6.41 from $6.18
BHP Group (BHP)
Retained at overweight at Morgan Stanley; Price Target: $46.50 from $43.50
Breville Group (BRG)
Retained at hold at Morgans; Price Target: $36.05 from $30.75
Brambles (BXB)
Retained at overweight at Morgan Stanley; Price Target: $28.00 from $22.00
Retained at hold at Morgans; Price Target: $25.70 from $19.75
Retained at neutral at UBS; Price Target: $25.90 from $24.00
Cobram Estate Olives (CBO)
Retained at hold at Bell Potter; Price Target: $2.90 from $2.35
Retained at accumulate at Ord Minnett; Price Target: $3.22 from $2.66
Retained at buy at Shaw and Partners; Price Target: $3.30 from $2.85
Cuscal (CCL)
Retained at buy at Bell Potter; Price Target: $4.50 from $3.50
Retained at buy at Ord Minnett; Price Target: $4.80 from $3.75
Credit Clear (CCR)
Retained at buy at Shaw and Partners; Price Target: $0.40 from $0.44
Codan (CDA)
Retained at buy at Canaccord Genuity; Price Target: $28.26 from $17.90
Retained at buy at Goldman Sachs; Price Target: $26.40 from $23.00
Upgraded to outperform at Macquarie; Price Target: $27.15 from $17.00
Retained at buy at Moelis Australia; Price Target: $30.05 from $18.43
Downer EDI (DOW)
Upgraded to accumulate from hold at Ord Minnett; Price Target: $7.70 from $6.80
Deterra Royalties (DRR)
Retained at equal-weight at Morgan Stanley; Price Target: $4.00 from $3.80
Data3 (DTL)
Retained at positive at E&P; Price Target: $9.41
DUG Technology (DUG)
Retained at buy at Ord Minnett; Price Target: $2.08 from $2.18
Retained at buy at Shaw and Partners; Price Target: $3.00
Endeavour Group (EDV)
Upgraded to neutral from sell at Citi; Price Target: $4.54
Retained at sector perform at RBC Capital Markets; Price Target: $4.35
Electro Optic Systems Holdings (EOS)
Retained at buy at Bell Potter; Price Target: $5.70 from $5.00
Retained at buy at Ord Minnett; Price Target: $4.70 from $4.25
Fletcher Building (FBU)
Retained at buy at Citi; Price Target: $3.50 from $3.55
Fonterra Shareholders' Fund (FSF)
Retained at outperform at Macquarie; Price Target: $7.33 from $6.89
Goodman Group (GMG)
Retained at buy at Bell Potter; Price Target: $40.75 from $39.35
Upgraded to accumulate from hold at Morgans; Price Target: $38.40 from $37.20
GPT Group (GPT)
Retained at overweight at Morgan Stanley; Price Target: $6.00 from $5.67
GQG Partners Inc. (GQG)
Retained at overweight at JPMorgan; Price Target: $2.50 from $2.70
Retained at outperform at Macquarie; Price Target: $2.63 from $2.64
Retained at overweight at Morgan Stanley; Price Target: $3.04
Retained at hold at Morgans; Price Target: $1.90 from $2.10
Retained at buy at Ord Minnett; Price Target: $2.80 from $3.20
Retained at buy at UBS; Price Target: $2.35
Guzman Y Gomez (GYG)
Retained at sell at Goldman Sachs; Price Target: $23.50 from $29.00
Retained at underweight at JPMorgan; Price Target: $23.60 from $25.70
Retained at buy at Morgans; Price Target: $30.60 from $38.00
Retained at neutral at UBS; Price Target: $26.50 from $31.00
Helia Group (HLI)
Downgraded to underperform from neutral at Macquarie; Price Target: $4.10 from $3.35
Healius (HLS)
Upgraded to positive from neutral at E&P; Price Target: $1.05 from $0.92
Retained at hold at Morgans; Price Target: $0.87 from $0.96
hipages Group Holdings (HPG)
Retained at equal-weight at Morgan Stanley; Price Target: $1.37 from $1.35
Retained at buy at Shaw and Partners; Price Target: $2.80 from $1.90
Infomedia (IFM)
Retained at positive at E&P; Price Target: $1.72
IGO (IGO)
Retained at underweight at Morgan Stanley; Price Target: $3.90
Iluka Resources (ILU)
Retained at overweight at Morgan Stanley; Price Target: $6.55 from $6.05
Imdex (IMD)
Retained at neutral at Citi; Price Target: $3.15
Inghams Group (ING)
Retained at hold at Bell Potter; Price Target: $2.75 from $3.60
Downgraded to hold from outperform at CLSA; Price Target: $2.70 from $3.45
Retained at sell at Goldman Sachs; Price Target: $2.60 from $3.00
Downgraded to neutral from overweight at Jarden; Price Target: $2.90 from $3.70
Upgraded to hold from trim at Morgans; Price Target: $3.03 from $3.58
Kogan.com (KGN)
Retained at outperform at RBC Capital Markets; Price Target: $5.50
Latitude Group Holdings (LFS)
Retained at equal-weight at Morgan Stanley; Price Target: $1.30 from $1.25
Meteoric Resources NL (MEI)
Retained at speculative buy at Canaccord Genuity; Price Target: $0.35
Megaport (MP1)
Retained at neutral at Citi; Price Target: $15.45 from $15.95
Macquarie Group (MQG)
Upgraded to overweight from neutral at JPMorgan; Price Target: $241.00 from $207.00
Monash IVF Group (MVF)
Downgraded to hold from buy at Bell Potter; Price Target: $0.77 from $1.15
Retained at outperform at Macquarie; Price Target: $1.00 from $1.30
Retained at speculative buy at Morgans; Price Target: $0.96 from $1.00
Retained at buy at Ord Minnett; Price Target: $0.95
Downgraded to market-weight from overweight at Wilsons; Price Target: $0.72 from $1.25
MaxiPARTS (MXI)
Retained at buy at Ord Minnett; Price Target: $3.00 from $2.60
NIB Holdings (NHF)
Retained at neutral at Citi; Price Target: $6.95
NRW Holdings (NWH)
Retained at buy at Canaccord Genuity; Price Target: $3.99 from $3.55
Retained at overweight at Jarden; Price Target: $3.60 from $3.40
Retained at buy at UBS; Price Target: $4.00 from $3.55
Netwealth Group (NWL)
Retained at neutral at Citi; Price Target: $35.50 from $33.65
Nuix (NXL)
Retained at sector perform at RBC Capital Markets; Price Target: $2.60
Pilbara Minerals (PLS)
Retained at underweight at Barrenjoey; Price Target: $1.20
Retained at outperform at Macquarie; Price Target: $1.90
Retained at outperform at RBC Capital Markets; Price Target: $2.70
Praemium (PPS)
Retained at outperform at RBC Capital Markets; Price Target: $0.90 from $1.00
Perenti (PRN)
Retained at buy at Citi; Price Target: $2.20
PWR Holdings (PWH)
Downgraded to hold from buy at Bell Potter; Price Target: $7.75 from $8.00
Downgraded to neutral from positive at E&P; Price Target: $7.88 from $8.10
Downgraded to accumulate from buy at Morgans; Price Target: $8.50 from $8.80
Retained at neutral at UBS; Price Target: $7.90 from $7.50
Qualitas (QAL)
Retained at outperform at Macquarie; Price Target: $3.98 from $3.73
Qube Holdings (QUB)
Retained at buy at Citi; Price Target: $4.90 from $4.65
Regis Healthcare (REG)
Retained at outperform at RBC Capital Markets; Price Target: $8.75 from $8.25
Reece (REH)
Retained at neutral at Citi; Price Target: $15.98
Rural Funds Group (RFF)
Retained at buy at Bell Potter; Price Target: $2.45 from $2.50
Regis Resources (RRL)
Retained at underweight at Barrenjoey; Price Target: $3.10
Retained at hold at Canaccord Genuity; Price Target: $4.25
Retained at sell at Citi; Price Target: $3.80
Retained at neutral at Macquarie; Price Target: $4.40 from $4.50
Retained at accumulate at Morgans; Price Target: $5.00 from $5.10
Retained at neutral at UBS; Price Target: $4.55 from $4.60
Resolute Mining (RSG)
Downgraded to neutral from overweight at Barrenjoey; Price Target: $0.80 from $0.90
Retained at buy at Canaccord Genuity; Price Target: $1.50 from $1.80
Downgraded to neutral from outperform at Macquarie; Price Target: $0.75
Downgraded to hold from buy at Ord Minnett; Price Target: $0.80 from $0.90
St Barbara (SBM)
Retained at hold at Ord Minnett; Price Target: $0.29 from $0.30
Sandfire Resources (SFR)
Retained at hold at Morgans; Price Target: $12.55 from $11.40
Strickland Metals (STK)
Retained at speculative buy at Canaccord Genuity; Price Target: $0.43
Santos (STO)
Retained at buy at Citi; Price Target: $8.89
Super Retail Group (SUL)
Downgraded to accumulate from buy at Ord Minnett; Price Target: $19.00 from $15.50
Seven West Media (SWM)
Retained at underweight at Morgan Stanley; Price Target: $0.15 from $0.17
Telix Pharmaceuticals (TLX)
Initiated at overweight at Morgan Stanley; Price Target: $25.60
Universal Store Holdings (UNI)
Retained at buy at Citi; Price Target: $11.28 from $10.53
Retained at buy at Jarden; Price Target: $10.69 from $10.38
Retained at overweight at JPMorgan; Price Target: $10.20 from $9.90
Retained at sector perform at RBC Capital Markets; Price Target: $8.90 from $8.65
Veem (VEE)
Retained at buy at Morgans; Price Target: $1.30 from $1.50
Vysarn (VYS)
Retained at speculative buy at Morgans; Price Target: $0.64 from $0.58
Webjet Group (WJL)
Retained at buy at Ord Minnett; Price Target: $1.37 from $1.76
Zip Co (ZIP)
Retained at buy at Citi; Price Target: $3.10
Retained at outperform at CLSA; Price Target: $4.30 from $3.75
Upgraded to buy from underperform at Jefferies; Price Target: $4.40 from $2.10
Retained at buy at Ord Minnett; Price Target: $4.60 from $3.40
Retained at outperform at RBC Capital Markets; Price Target: $5.00 from $3.50
Retained at buy at UBS; Price Target: $4.50 from $3.40
Scans
Top Gainers
Code | Company | Last | % Chg |
|---|---|---|---|
| AHK | Ark Mines Ltd | $0.355 | +91.89% |
| T3D | 333D Ltd | $0.015 | +50.00% |
| LKY | Locksley Resources Ltd | $0.32 | +42.22% |
| GLA | Gladiator Resources Ltd | $0.019 | +35.71% |
| SXL | Southern Cross Media Group Ltd | $0.835 | +26.52% |
Top Fallers
Code | Company | Last | % Chg |
|---|---|---|---|
| DM1 | Desert Metals Ltd | $0.017 | -41.38% |
| PAT | Patriot Resources Ltd | $0.034 | -24.44% |
| CLG | Close the Loop Ltd | $0.032 | -23.81% |
| FEG | Far East Gold Ltd | $0.15 | -18.92% |
| NPM | Newpeak Metals Ltd | $0.014 | -17.65% |
52 Week Highs
Code | Company | Last | % Chg |
|---|---|---|---|
| AHK | Ark Mines Ltd | $0.355 | +91.89% |
| T3D | 333D Ltd | $0.015 | +50.00% |
| LKY | Locksley Resources Ltd | $0.32 | +42.22% |
| GLA | Gladiator Resources Ltd | $0.019 | +35.71% |
| SXL | Southern Cross Media Group Ltd | $0.835 | +26.52% |
52 Week Lows
Code | Company | Last | % Chg |
|---|---|---|---|
| DM1 | Desert Metals Ltd | $0.017 | -41.38% |
| REH | Reece Ltd | $11.76 | -16.42% |
| AD1 | Adneo Ltd | $0.04 | -13.04% |
| AOF | Australian Unity Office Fund | $0.42 | -8.70% |
| NAG | Nagambie Resources Ltd | $0.013 | -7.14% |
Near Highs
Code | Company | Last | % Chg |
|---|---|---|---|
| U100 | Global X US 100 ETF | $16.13 | +0.75% |
| WGX | Westgold Resources Ltd | $3.24 | +0.62% |
| FASI | Fidelity Asia Active ETF | $11.84 | +0.77% |
| APE | Eagers Automotive Ltd | $22.16 | +0.77% |
| SMLL | Betashares Australian Small Companies Select ETF | $4.08 | +1.75% |
Relative Strength Index (RSI) Oversold
Code | Company | Last | % Chg |
|---|---|---|---|
| MHK | Metal Hawk Ltd | $0.155 | -11.43% |
| REH | Reece Ltd | $11.76 | -16.42% |
| CNB | Carnaby Resources Ltd | $0.31 | -6.06% |
| RFG | Retail Food Group Ltd | $1.55 | -4.32% |
| LAU | Lindsay Australia Ltd | $0.66 | -10.20% |
