Can the lithium rally continue? Pilbara Minerals, Mineral Resources, IGO, and Liontown rallies hang on this indicator
This week's price action in GFEX futures could be make or break for lithium prices, and the ASX lithium stocks that rely on them.

Source: Shutterstock
Mentioned
KEY POINTS
- A strong rally in lithium futures since June appears to offer lithium bulls some respite – it has also helped power a massive rebound in ASX lithium stocks like Pilbara Minerals (PLS), Mineral Resources (MIN), IGO, and Liontown Resources (LTR).
- Last week’s dip could just be a pullback in a new bull trend, but the analysis suggests this week’s price action is shaping as a critical for lithium prices, and by extension, the ASX lithium stocks that rely on them.
- We investigate the latest technical analysis factors for lithium prices, and exactly what investors must watch out for this week to determine if the fledgling uptrend can continue.
For much of the past two and a half years, lithium prices have been in decline. After peaking during the speculative frenzy of 2021–22, the metal at the heart of the electric vehicle (EV) revolution collapsed under the weight of a wall of new supply. The most recent rally, which began in June this year, appears to offer bulls some respite.
It was fuelled by hopes of a more rational Chinese production environment (generally referred to as “anti-involution”) and the temporary closure of a key marginal Chinese lithium mine amidst whispers of tightening regulation on the industry. But by last week, the rally appears to be faltering.
Prices for lithium carbonate on the Guangzhou Futures Exchange (GFEX) surged to a peak of RMB 90,100 per tonne on 18 August, before correcting sharply to close at RMB 78,960 per tonne by Friday. That’s still substantially better than the 23 June low of RMB 58,720, however, and the die-hard lithium faithful, hardened by nearly three years of withering bear market will undoubtedly still claim a substantial win!
As a technical analyst, I agree that nothing goes up in a straight line and last week’s dip may well prove to just be just a regulation pullback in a new bull market. But the analysis I'll present to you today suggests this week's price action could make or break the recent lithium rally, as well as the share prices of most ASX lithium stocks that have enjoyed a similar reprieve.
Guangzhou Futures Exchange (GFEX) Lithium Carbonate
The Guangzhou Futures Exchange (GFEX) launched its lithium carbonate futures contract in mid-2023, giving the market its first widely traded derivative tied directly to lithium prices. The contract has quickly grown in influence, with open interest surging as producers, traders, and investors use it to hedge exposure or speculate on swings in supply and demand.
GFEX now provides a transparent pricing reference that generally leads spot market moves, making it the de facto benchmark for lithium globally. On a potentially negative note, its prominence has also attracted speculative flows, prompting regulators to impose daily position limits to temper volatility and protect market stability.
👍 GFEX is a widely used and transparent pricing reference that generally leads spot market moves.
👎GFEX has become a plaything of Chinese speculators, and if left unchecked, this will likely exacerbate moves both up and down and diminish its value as an indicator of underlying market fundamentals.
A beginner's guide to my trading model 🔎
1. Trend Alignment:
Short term (ST) exhibits traders demand-supply dynamics / intentions vs long term (LT) exhibits positional / major suppliers and consumers demand-supply dynamics / intentions.
When ST and LT trends align, it yields the strongest signals.
ST trend ribbon = Light green (uptrend/demand-side control) / orange (neutral/equilibrium) / light pink (downtrend/supply-side control) ribbon.
ST trend ribbon is acting as a zone of dynamic demand in an uptrend / zone of dynamic supply in a downtrend (i.e., in an uptrend the price is bouncing off the ST ribbon vs in a downtrend it's being repelled by the ST trend ribbon).
LT trend ribbon = Dark green (uptrend/demand-side control) / orange (neutral/equilibrium) / dark pink (downtrend/supply-side control) ribbon.
LT trend ribbon is acting as a zone of dynamic demand in an uptrend / zone of dynamic supply in a downtrend (i.e., in an uptrend the price is bouncing off the LT ribbon vs in a downtrend it's being repelled by the LT trend ribbon).
2. Price Action:
📈 Rising peaks and rising troughs indicates demand-side control (i.e., exhibiting supply removal and buy the dip demand reinforcement)
📉 Falling peaks and falling troughs indicates supply-side control (i.e., exhibiting demand removal and sell the rally supply reinforcement)
3. Candles:
⬜ White bodies and or downward pointing shadows indicates demand-side control (i.e., exhibits buy the dip activity, accumulation and pervasive programmed buy orders)
⬛ Black bodies and or upward pointing shadows indicates supply-side control (i.e., exhibits sell the rally activity, distribution and pervasive programmed sell orders)
My latest GFEX Lithium Carbonate technical analysis 🧐

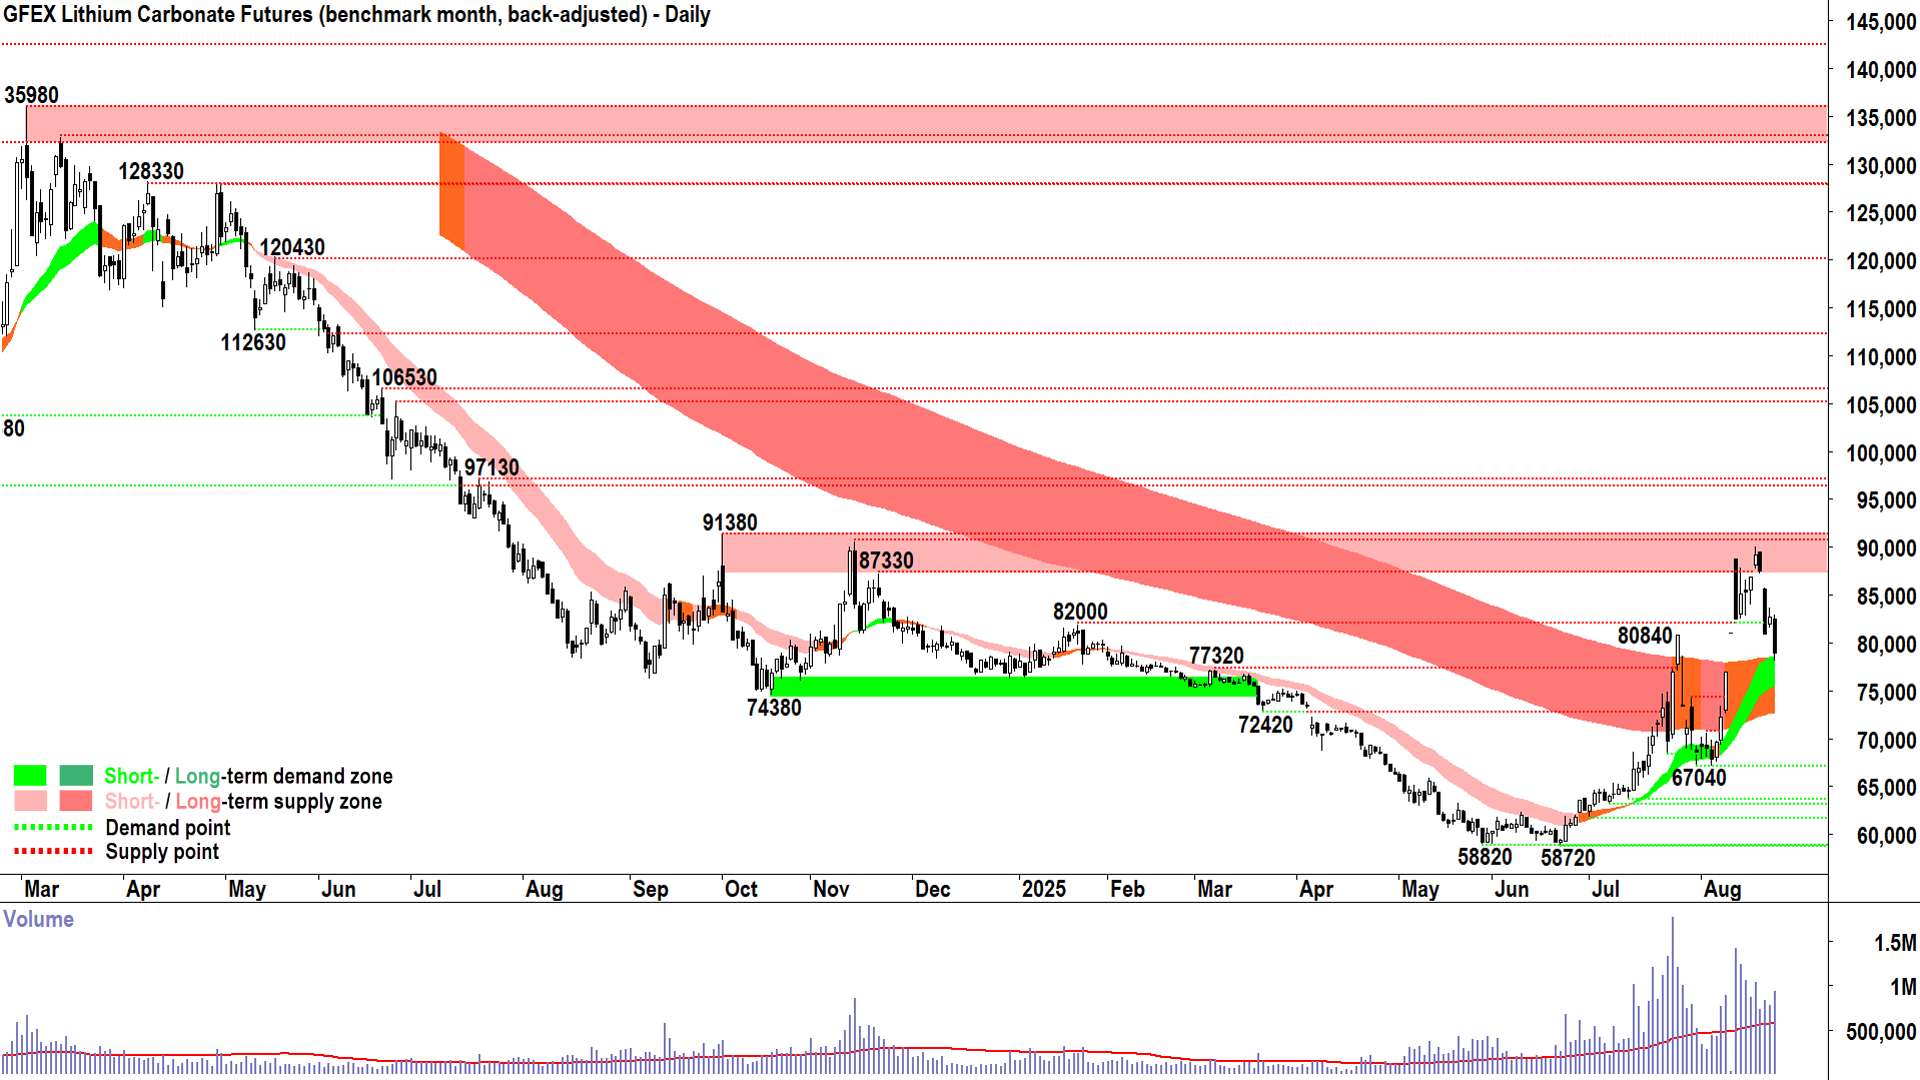
Guangzhou Futures Exchange (GFEX) lithium carbonate futures November 2025 (benchmark contract, back-adjusted) (click here for full size image)
ST/LT trends: ⬆️/⬆️
Price action: 📈
Candles: Mixed, predominantly demand-side between Jun 23 and 18 Aug ⬜, last week decisively supply-side ⬛.
View: Despite last week’s pullback, the ST trend remains strong, and the ST trend ribbon appears to be acting as a zone of dynamic demand for now. The LT trend ribbon is neutral, but as the price is trading above the LT trend ribbon, and the LT trend ribbon is rising – the current indication is the LT trend is transitioning from down to up.
I require a test and hold (i.e. a pullback to and subsequent bounce off) the LT trend ribbon to confirm its transition from a zone of dynamic excess supply to a zone of dynamic excess demand. This is the final step in the transition from LT downtrend to LT uptrend – and therefore the trigger for me to call the start of a new lithium bull market.
Note on that last point, I called the end of the previous bear market several weeks ago (as we had clearly transitioned to a neutral/equilibrium market). Since then, I have been leaning towards calling a new bull market, but as stated in previous ChartWatch updates – I have expressed my preference to see confirmation via a test and hold of the LT trend ribbon first.
As can be seen by last week’s correction – pulling back perfectly back to the confluence of the ST and LT trend ribbons – we will likely get our answer this week! By the end of this week, we should have a much better idea of whether a new bull market in lithium has begun, or if we remain in the present state of equilibrium (or something worse? 🤔).
I must leave that final option in, because the worse case scenario this week is if the price slices straight through the ST/LT uptrend ribbons – and we’re then not looking for signs of confirmation we’re in a new bull market – but rather for signs of confirmation of a return to a bear market… Dah - dah - daaahhmmmm! 🚨⚠️
The price action remains rising peaks and rising troughs – despite last week’s pullback – with 90100 vs 80840 as peaks and 67040 vs 67140 as troughs. I note the reversal from 90100 should not be too surprising considering it occurred from the well defined supply zone of 87330-91380. That zone will likely continue to inhibit upside potential in the short-to-medium term.
The setting of a higher trough here – i.e., at/above the confluence of the ST/LT trend ribbons – would be a strong signal that the demand-side remains intent on buying the dip. It’s also important that previous points of supply (80840) act as future points of demand – another reason to see a trough right here – as it's critical to the sustainability of the present ST uptrend.
The candles prior to the 18 August peak at 90100 were predominantly demand-side in nature, with one exception, the long black-bodied candle on 12 August. It has joined with similar supply-side dominant signals on 19, 20, and 22 August to flag an aggressive return of ST dominance of the supply-side. Disturbingly, last week we saw a wall of uncontested excess supply. Even the minor demand-side candle on 21 August signals just how feeble the demand-side was in responding to the latest supply-side challenge.
Volume bars show the characteristic increase heading into and during the June low – interest increased, demand-side control increased, supply was consumed. This facilitated the initial breakout. A massive, and record for GFEX lithium futures volume was logged – signalling a massive amount of supply was consumed during the first rally to 80840.
The subsequent pullback occurred on an initial strong volume push as the supply-side eventually entered in size to take advantage of higher prices – but dissipated quickly as that supply dried up. Volume then exploded again as the demand-side re-entered (i.e., on CATL's Jianxiawo mine closure news), but importantly – the supply-side remained engaged the whole way up. I say this because you can see significant and above average volumes in the second push to 90100 – culminating in last week’s sell off. The volume bars clearly indicate that the demand-side has taken on greater exposure (i.e., cash has been transformed into risk... the risk here is all the cash in now in risk and there's a demand-side vacuum).
And here we are. Monday 25 August – arguably stuck in the middle of a major tug of war between renewed demand-side interest – and clearly persistent supply-side engagement. Rising trend and price action indications remain intact, but short term developments – as in last week’s candles – are substantially disturbing. I proposed the technicals indicate that the supply-side has barely left the market in any major size throughout the entire rally since June.
What the bulls want to see this week 🐂:
White-bodied candles and or downward pointing shadows – big ones! We want to see the demand-side sweeping back into dominance, and this means higher prices without pushback (i.e., white-bodied candles), it also means targeted buy the dip into the dynamic demand zones (i.e., downward pointing shadows into trend ribbons). ✅=💪
The price should NOT close below the confluence of the ST and LT trend ribbons. 🚫=💪
A trough MUST BE set at or above the confluence of the ST and LT trend ribbons. ✅=💪
A lower peak to 90100 should NOT be set. 🚫=💪
What the bears want to see this week 🐻:
Black-bodied candles and or upward pointing shadows, even small bodied / feeble responses to last week's decisive supply-side candles would be disturbing... These would indicate continued supply-side price action and a lack of demand-side intent, respectively. ⚠️
The price closes below the confluence of the ST and LT trend ribbons – a massive deal breaker as arguments "it's just a pullback" will be quashed. Instead, the market will begin to fear and factor in a more protracted downturn – and lose hope higher prices are still coming down the track...⚠️
A trough set deep inside or below the confluence of the ST and LT trend ribbons – again, newly stoked demand will lose faith – this rally cannot sustain itself merely on the hopes and dreams of ardent lithium bulls! ⚠️
A lower peak to 90100 would indicate supply reinforcement and sell the rally – indications of growing supply-side control. ⚠️
The lingering concern remains supply, not demand ⚖️
According to today’s B* Resources Daily report from Australian broking and research house Barrenjoey, Asian seaborne markets have been less volatile than futures pricing, only slightly softer through last week. But the broker quotes a source on the ground in the Chinese lithium market who stated “the lithium market remained in a surplus” and that they remained uncertain wither recent buying was driven "more by sentiment than real demand".
And that's where my chart picks up the narrative! Sentiment (i.e., the short term rally) or real demand (i.e., a sustainable rally / start of the next bull market)? 🤷
For investors, it’s clear that the market is trying to reconcile several near-term positive drivers for lithium prices against a broader backdrop of an ongoing supply glut. The irony of the situation for lithium bulls is arguably this: The more the price goes up, the more likely supply will either increase to snuff out the rally, or that it curtails both forced and planned cutbacks in uneconomic output – further delaying a market rebalancing.
I will leave you with this thought: The charts always reflect the fundamentals. They are created by the interaction of the demand and supply of all market participants – who are ultimately acting based on their best assessments of all critical mitigating circumstances. So, rhetoric, fear, and euphoria aside, my tip is to watch the price action for clues as to how the fundamentals will develop!
