

The ASX 200 edged higher in a defensive session as fund managers sought the safety of blue-chip banks, insurers, and healthcare names while shedding mining and technology stocks. Energy was the session's most interesting mover — rising despite lower crude oil as refiners and oil producers outweighed a sharp sell down in coal.
Be sure to click/scroll through for the usual reporting of the major sector and stock-specific moves, the broker responses to them, as well as all the key economic data in tonight's Evening Wrap. Also, I have detailed technical analysis on the Nasdaq Composite and the S&P/ASX 200 in today's ChartWatch.
Let’s dive in!
Today in Review
Name | Value | % Chg |
|---|---|---|
Major Indices | ||
| ASX 200 | 8,731.9 | +0.01% |
| All Ords | 8,919.1 | -0.04% |
| Small Ords | 3,392.7 | -0.58% |
| All Tech | 2,750.9 | -1.05% |
| Emerging Companies | 3,100.7 | -0.31% |
Currency | ||
| AUD/USD | 0.7126 | +0.02% |
US Futures | ||
| S&P 500 | 7,755.5 | +0.56% |
| Dow Jones | 52,369.0 | +0.56% |
| Nasdaq | 30,152.5 | +0.79% |
Name | Value | % Chg |
|---|---|---|
Sector | ||
| Financials | 9,185.5 | +0.63% |
| Health Care | 32,065.6 | +0.51% |
| Energy | 11,041.3 | +0.45% |
| Real Estate | 3,194.0 | +0.09% |
| Industrials | 7,959.5 | +0.05% |
| Utilities | 10,258.4 | -0.11% |
| Consumer Staples | 12,801.8 | -0.23% |
| Consumer Discretionary | 3,457.8 | -0.41% |
| Communication Services | 1,544.4 | -0.43% |
| Materials | 24,059.1 | -0.66% |
| Information Technology | 1,613.8 | -1.60% |
ASX 200 Intraday Chart
%20intraday%20chart_21%20Sep.png)
Markets
The S&P/ASX 200 (XJO) finished 0.7 points higher at 8,731.9, 0.59% from its session low and just 0.05% from its high. In the broader-based S&P/ASX 300 (XKO) advancers snuck past decliners by a narrow 145 to 134.
Financials (XFJ) (+0.6%) attracted the bulk of Monday's defensive capital — a risk-off session that had fund managers reaching for the market's most liquid, highest-yielding, fully franked stalwarts regardless of the macro backdrop. Juicy! 🧃
Insurers led the sector on the higher yield environment — NIB Holdings (NHF) (+1.4%), Medibank Private (MPL) (+1.3%), and Suncorp (SUN) (+1.2%) all advanced alongside Macquarie Group (MQG) (+1.2%), whose commodity markets and trading business continues to benefit from the sustained volatility in energy and base metals prices. The major banks participated broadly — ANZ (ANZ) (+0.9%), National Australia Bank (NAB) (+0.7%), Westpac (WBC) (+0.5%), and Commonwealth Bank (CBA) (+0.4%) all firmed.
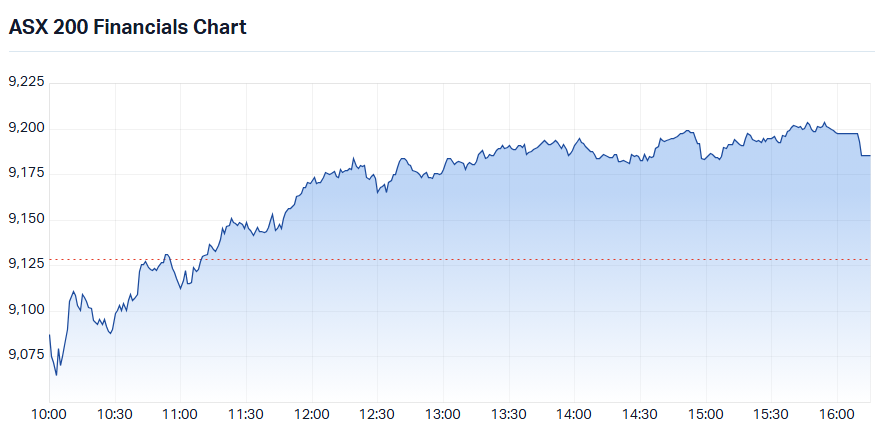
S&P/ASX 200 Financials Sector Index intraday chart 🧃
Health Care (XHJ) (+0.5%) continued its remarkable start to FY27. It has a habit (unlike most other sectors) of finding buyers on both good and bad market days. The blue-chip end of the sector attracted the most conviction today: Cochlear (COH) (+5.3%) surged alongside another solid gain in CSL (CSL) (+1.5%), while elsewhere, Nanosonics (NAN) (+4.5%) and Fisher & Paykel Healthcare (FPH) (+1.5%) were notable.
Energy (XEJ) (+0.5%) was Monday's most interesting sector. ICE Brent crude futures fell 1.9% to US$101.92/bbl yet the sector finished positive — the result of a sharp split between its constituents. Refiners and oil and gas producers outweighed the coal cohort by enough to drag the sector into the green: Viva Energy (VEA) (+1.9%), Ampol (ALD) (+1.6%) advanced as lower crude supported refining margins. Santos (STO) (+1.6%) was the best of the oil and gas majors.
Coal stocks moved decisively in the opposite direction, however, as SGX Australian Premium Coking Coal futures fell 3.3% to US$262/t and globalCoal Newcastle Coal futures dropped 1.6% to US$146.10/t — Coronado Global Resources (CRN) (-6.8%), New Hope Corp. (NHC) (-5.2%), and Whitehaven Coal (WHC) (-2.3%) all ended lower.
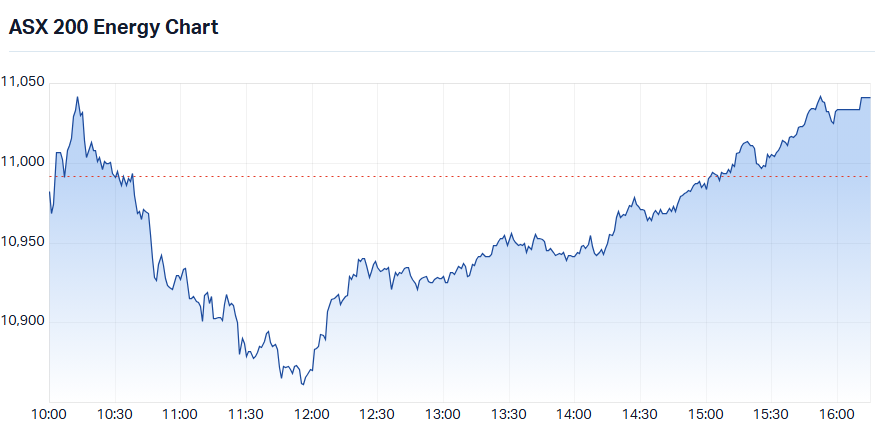
S&P/ASX 200 Energy Sector Index intraday chart
Information Technology (XIJ) (-1.6%) was Monday's worst sector — and despite the Nasdaq rising overnight, the local result was entirely predictable for anyone who has followed the sector through this year. The US technology bull market is being driven by AI innovators and hyperscalers; the ASX has neither, and its SaaS-heavy technology sector faces the opposite dynamic — AI disruption risk rather than AI opportunity. Catapult Sports (CAT) (-4.8%), Xero (XRO) (-4.3%), NextDC (NXT) (-3.3%), and Macquarie Technology (MAQ) (-2.4%) all fell.
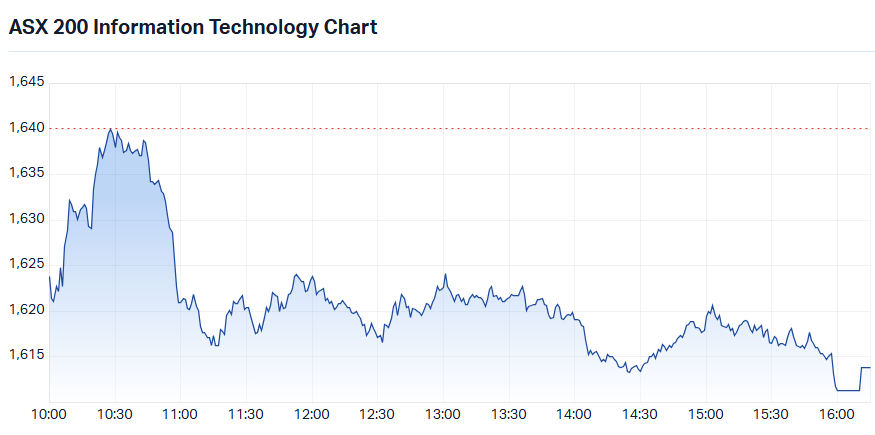
S&P/ASX 200 IT Sector Index intraday chart
The Gold Sub-Index (XGD) (-0.7%) and Materials (XMJ) (-0.7%) both fell for the same reason — capital flowing into defensives had to come from somewhere, and in the ASX's zero-sum daily rotation, mining stocks are consistently the source of funds when banks and healthcare are in demand.
The commodity price signal for selling was modest — COMEX gold futures fell 0.8% to US$4,390/oz — but the prices of iron ore, copper, tin, zinc, and rare earths (NdPr) were each modestly higher on Friday, or through to Asian trade today.
Within gold, St Barbara (SBM) (-4.3%), Kingsgate Consolidated (KCN) (-4.1%), and Newmont (NEM) (-2.0%) led the selling. Within Materials, the damage was spread across all sub-themes: iron ore names Deterra Royalties (DRR) (-4.4%) and Champion Iron (CIA) (-1.2%); base metals South32 (S32) (-1.2%); critical minerals Lynas Rare Earths (LYC) (-2.6%) and Iluka Resources (ILU) (-1.2%); and diversifieds Rio Tinto (RIO) (-0.8%) and BHP (BHP) (-0.4%) all retreated.
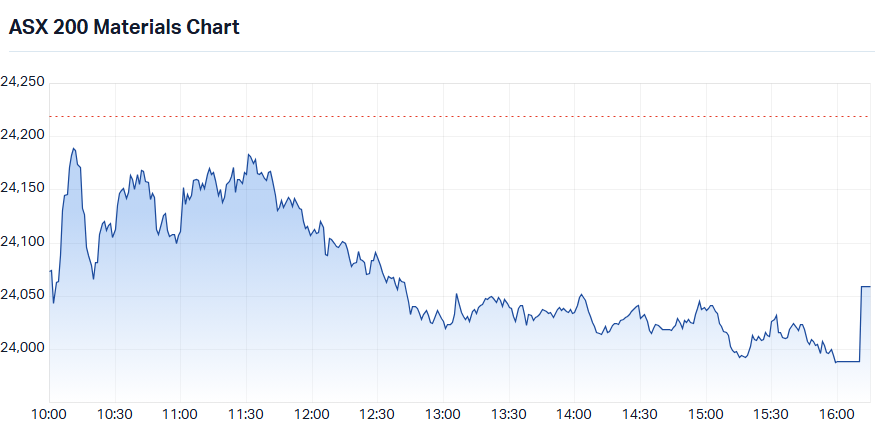
S&P/ASX 200 Materials Sector Index intraday chart
GFEX lithium carbonate futures in China gained 4.2% to CNY 132,500/t — more than recovering Friday's 3.1% decline — yet most lithium stocks failed to respond, investors likely waiting for further confirmation that the commodity's recovery has genuine legs before re-engaging with a sector that has burned them repeatedly through this correction.
Elevra Lithium (ELV) (-3.1%), Pilbara Minerals (PLS) (-1.0%), Vulcan Energy Resources (VUL) (-0.9%), and IGO (IGO) (-0.7%) all fell against the positive commodity lead. Core Lithium (CXO) (+1.4%) and Liontown Resources (LTR) (+1.0%) were the exceptions — the only names willing to follow the price signal higher.
Today's best ASX Top 300 gainers
Company | Last Price | Change $ | Change % | 1mo % | 1yr % |
|---|---|---|---|---|---|
| Air New Zealand (AIZ) | $0.335 | +$0.02 | +6.3% | -2.9% | -37.4% |
| Ramelius Resources (RMS) | $3.80 | +$0.22 | +6.1% | -3.1% | +8.3% |
| Cochlear (COH) | $140.95 | +$7.05 | +5.3% | +3.0% | -51.9% |
| L1 Group (L1G) | $1.14 | +$0.05 | +4.6% | -10.9% | +53.0% |
| PYC Therapeutics (PYC) | $2.79 | +$0.12 | +4.5% | +26.8% | +219.2% |
| Benz Mining Corp (BNZ) | $4.91 | +$0.21 | +4.5% | +28.5% | +190.5% |
| Nanosonics (NAN) | $3.05 | +$0.13 | +4.5% | -15.3% | -26.7% |
| Judo Capital Holdings (JDO) | $1.00 | +$0.04 | +4.2% | +0.5% | -42.7% |
| Treasury Wine Estates (TWE) | $5.36 | +$0.21 | +4.1% | -4.1% | -27.4% |
| Meridian Energy (MEZ) | $4.47 | +$0.17 | +4.0% | -1.8% | -10.1% |
| Bannerman Energy (BMN) | $4.00 | +$0.14 | +3.6% | +5.3% | +14.3% |
| Pantoro Gold (PNR) | $2.87 | +$0.10 | +3.6% | +10.8% | -46.0% |
| Navigator Global Investments (NGI) | $2.40 | +$0.08 | +3.4% | -6.2% | +15.2% |
| Paladin Energy (PDN) | $10.16 | +$0.33 | +3.4% | -2.3% | +25.4% |
| FDC Consolidated Holdings (FDC) | $3.90 | +$0.12 | +3.2% | +5.4% | +30.0% |
| Lovisa Holdings (LOV) | $23.32 | +$0.70 | +3.1% | -0.9% | -40.3% |
| Storage King Group (SKG) | $1.085 | +$0.03 | +2.8% | -5.2% | -23.0% |
| Nickel Industries (NIC) | $0.795 | +$0.02 | +2.6% | -5.9% | +13.6% |
| Graincorp (GNC) | $6.72 | +$0.16 | +2.4% | +19.8% | -24.4% |
| Tuas (TUA) | $2.31 | +$0.05 | +2.2% | +12.1% | -68.7% |
Today's worst ASX Top 300 losers
Company | Last Price | Change $ | Change % | 1mo % | 1yr % |
|---|---|---|---|---|---|
| Perpetual (PPT) | $16.64 | -$2.96 | -15.1% | -15.5% | -12.9% |
| Telix Pharmaceuticals (TLX) | $15.76 | -$2.09 | -11.7% | -9.3% | +8.5% |
| Minerals 260 (MI6) | $0.86 | -$0.08 | -8.5% | +3.0% | +319.5% |
| Resolute Mining (RSG) | $1.24 | -$0.115 | -8.5% | -2.0% | +47.6% |
| Lindian Resources (LIN) | $0.61 | -$0.055 | -8.3% | -19.7% | +139.2% |
| Brazilian Rare Earths (BRE) | $3.75 | -$0.33 | -8.1% | -6.2% | -0.5% |
| Sunrise Energy Metals (SRL) | $18.17 | -$1.37 | -7.0% | +9.3% | +365.9% |
| FireFly Metals (FFM) | $1.68 | -$0.115 | -6.4% | -10.4% | +42.8% |
| New Murchison Gold (NMG) | $0.08 | -$0.005 | -5.9% | +19.4% | +166.7% |
| Alcoa Corporation (AAI) | $62.18 | -$3.82 | -5.8% | -14.7% | +25.6% |
| Turaco Gold (TCG) | $0.825 | -$0.05 | -5.7% | +6.5% | +91.9% |
| Cobram Estate Olives (CBO) | $2.82 | -$0.17 | -5.7% | -17.3% | -15.6% |
| New Hope Corporation (NHC) | $6.05 | -$0.33 | -5.2% | +6.9% | +44.4% |
| Catapult Sports (CAT) | $2.95 | -$0.15 | -4.8% | -20.9% | -58.4% |
| 4DMedical (4DX) | $4.11 | -$0.20 | -4.6% | +2.2% | +146.8% |
| Aura Consolidated Group, Inc. (AXQ) | $3.94 | -$0.19 | -4.6% | +6.2% | -42.5% |
| Deterra Royalties (DRR) | $4.12 | -$0.19 | -4.4% | -7.2% | -0.2% |
| Xero (XRO) | $60.08 | -$2.70 | -4.3% | -29.6% | -63.0% |
| St Barbara (SBM) | $0.89 | -$0.04 | -4.3% | +34.8% | +83.5% |
| BCI Minerals (BCI) | $0.56 | -$0.025 | -4.3% | +20.4% | +41.8% |
Chartwatch
Nasdaq Composite Index
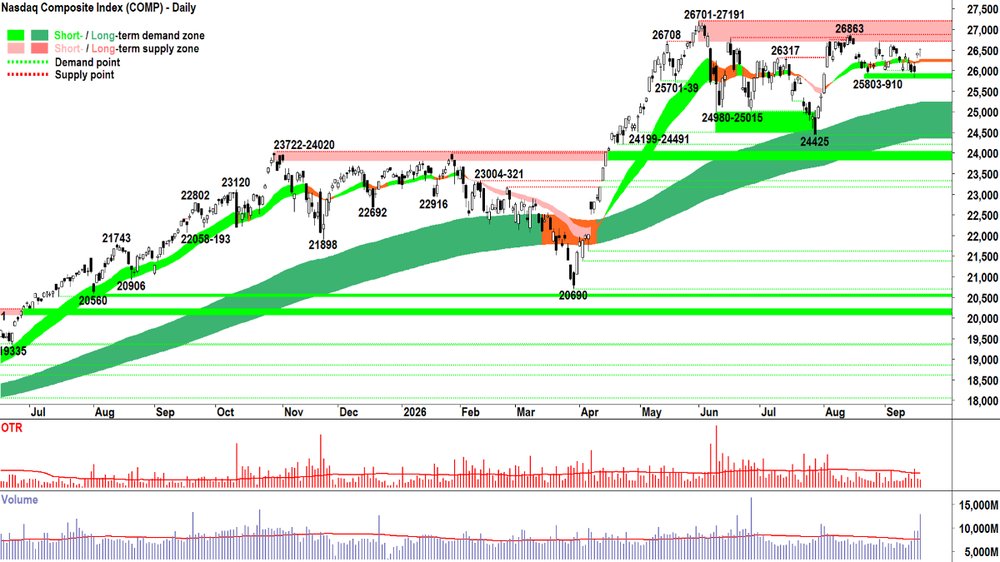
Nasdaq Composite Index chart
Analysis
Friday's Comp candle is so in tune with the nature of this market: gap higher vs previous close... pullback... wall of BTD... close near the high.
Look at the volume. Comp in Beast Mode 💪.
But it's still at odds (at least in the very short term) compared to the signal we're getting from the RUT 👇.
%20chart_18%20Sep.png)
Russell 2000 Index (RUT) chart
But does that matter?
Is the Comp about to decouple from the rest of the US equity market? The rest of the global stock market cohort? 🤔
The last two candles suggests it can.
But 26701-27191 stands in the way. And I need more than just two beastly candles to warrant increasing my portfolio risk.
View
Act = 1/2RP. (RP = Risk Position – it reflects my personal allowable capital allocation limit for my investments in US stocks. So 1/2RP is 50%, 2/3RP is 67% and FRP is 100%).
Key Levels
26701-863 is the closest key point of supply vs 25803-910 as the closest key zone of demand, and then the long term trend ribbon (presently 24358-25222).
S&P/ASX 200 (XJO)
%20chart_21%20Sep.png)
S&P/ASX 200 (XJO) chart
Analysis
Most evening wraps are going to say: "The ASX 200 closed flat... quiet day... nothing to see here..."
You know that I'm going to look at today's downward pointing shadow — as small as it is, particularly in context of the fall from 9297 that preceded it, and say: decent session ✅.
I suggest, some credible BTD — nothing to get too excited about yet — and no need to change the present portfolio RP setting. But following on from Thursday's and Friday's upward pointing shadows, today's result is far from the wipe out that the MOTN from price action and candles might have forecast.
8708-8656 is holding, and while it does, there's no need to panic. Not that "panic" requires much action from here... I'm already at my maximum portfolio risk setting! 😉
View
I am 1/3RP on Australian shares (i.e., 67% cash vs 33% invested, with some of the invested portion allocated to shorts).
Key levels
8708-8656 is the critical zone of demand, while the long term trend ribbon (presently 8798-8861) is the the biggest barrier the OTP will have to contend with on the way back up.
(Glossary of acronyms! Old Tin Pot (OTP): S&P/ASX 200 | MOTN: More Often Than Not | FOMO: Fear Of Missing Out | HOFU: Holding On For Upside | BTD: Buy The Dip | NUTE: No Urgency To Enter | FOHO: Fear Of Holding On | STR: Sell The Rally | RP: Risk Position | FFS: Fund Flow Shenanigans!)
***CHARTWATCH LIVE WEBINARS 📺🍿***
Weekly, Wednesday's @ 12pm AEDT (Returning October 28!!! 🏖️)
Learn more about technical analysis and trend following through real case studies on ASX stocks. Australia's premier technical analyst, Carl Capolingua, shares his unique insights on stocks as requested by viewers. Ask about a company in your portfolio or anything related to trading and investing and get Carl's expert opinion.
Places are limited so >REGISTER NOW!<
Economy
TODAY
CHN People's Bank of China (PBOC) Loan Prime Rate
1-year LPR: unchanged at 3% as forecast
1-year LPR: unchanged at 3.5% as forecast
LATER THIS WEEK
TUESDAY
13:10 RBA Gov Bullock Speaks (at Committee for Economic Development of Australia event to discuss inflation, interest rates, and Australia’s economic outlook)
WEDNESDAY
09:00 AUS September Flash Purchasing Managers Index (PMI)
Manufacturing: previous was 52.0
Services: previous was 53.2 (revised up from 52.9)
23:45 USA September Flash Purchasing Managers Index (PMI)
Manufacturing: 53.4 forecast vs 53.9 in August (revised up from 53.2)
Services: 56.0 forecast vs 56.5 in August (revised down from 56.8)
THURSDAY
11:30 AUS August Employment
Employment change: +20,900 m/m forecast vs -15,800 m/m in July
Unemployment rate: 4.5% unchanged
FRIDAY
22:30 USA August Core Durable Goods Orders (+0.5% m/m forecast vs +0.4% m/m in July)
Interesting Movers
Trading higher
- Ramelius Resources (RMS) $3.80+6.2%
Issued an updated four-year outlook and guidance. Management increased FY30 production to between 560-610koz at an AISC of A$2,100 - 2,400/oz, representing an 11% production increase on the previous October 2025 plan.
- Treasury Wine Estates (TWE) $5.36+4.1%
Substantial share holder notice stating that JP Morgan now owns 5.03% of the company. The substantial holding appears largely attributable to securities-lending activity – potentially including the facilitation of short selling – rather than a conventional investment stake.
- Bapcor (BAP) $0.81+3.9%
Substantial share holder notice stating that Australian Retirement Trust has reduced its stake in the company from 10.0% to 8.2%.
- Pantoro Gold (PNR) $2.87+3.6%
Issued an operational update ahead of investor presentations due in North America later in the week. Management noted that quarter-to-date production at company's Norseman mine is in line with guidance at 19,130 oz.
Trading Lower
- Perpetual (PPT) $16.64-15.1%
Announced that an entity controlled EQT (EQT) has submitted a further revised non-binding proposal to acquire 100% of PPT for $22.50 per share in cash. PPT may also declare a dividend of up to $0.60 cents per share. The board declared that the offer was not in the best interests of shareholders.
- Telix Pharmaceuticals (TLX) $15.76-11.7%
Announced a $3.3 billion deal to purchase German ITM Isotope Technologies.
- Resolute Mining (RSG) $1.24-8.5%
Released an operational update for its Syama Gold Mine in Mali. Management noted that a "challenging operating environment" had negatively impacted production and the mine will now produce 150–160 koz and AISC to $2,300–2,400 /oz. FY27 group gold production is now is now expected to be 205–225 koz at an AISC of $2,250–2,350 /oz.
Broker Moves
Company | Broker | Action | Rating | Price Target |
|---|---|---|---|---|
A2MThe a2 Milk Company | Morgan Stanley | Retained | Overweight | $8.50 |
ABGAbacus Group | Shaw and Partners | Retained | Buy | $1.05 |
ALLAristocrat Leisure | Morgan Stanley | Retained | Overweight | $63.90 |
ANZANZ Group Holdings | Morgan Stanley | Retained | Overweight | $35.50 |
AX1Accent Group | Morgan Stanley | Retained | Equal Weight | $0.75 |
AZYAntipa Minerals | Canaccord Genuity | Retained | Speculative Buy | $1.00 |
BHPBHP Group | Morgan Stanley | Retained | Overweight | $68.00 |
BOEBoss Energy | Macquarie | Retained | Outperform | $2.00 |
| Morgan Stanley | Retained | Overweight | $1.65 | |
CBACommonwealth Bank of Australia | Morgan Stanley | Retained | Underweight | $124.00 |
CGFChallenger | UBS | Retained | Buy | $11.50 |
CSLCSL | Morgan Stanley | Retained | Overweight | $182.00 |
DMPDomino's Pizza Enterprises | Morgan Stanley | Retained | Underweight | $16.00 |
| UBS | Retained | Buy | $22.00 | |
DNLDyno Nobel | Morgans | Retained | Hold | $4.42(from $3.46) |
DRRDeterra Royalties | Morgan Stanley | Retained | Underweight | $3.80 |
ELDElders | Citi | Downgraded | Neutral(from Buy) | $6.60(from $6.50) |
FMGFortescue | Morgan Stanley | Retained | Underweight | $15.45 |
IAGInsurance Australia Group | UBS | Retained | Buy | $9.25 |
ILUIluka Resources | Morgan Stanley | Retained | Overweight | $8.10 |
LOVLovisa Holdings | UBS | Retained | Buy | $28.00 |
LYCLynas Rare Earths | Morgan Stanley | Retained | Equal Weight | $15.45 |
MQGMacquarie Group | Morgan Stanley | Retained | Overweight | $273.00 |
MTSMetcash | UBS | Retained | Buy | $3.25 |
NABNational Australia Bank | Morgan Stanley | Retained | Underweight | $34.00 |
NHCNew Hope Corporation | Bell Potter | Downgraded | Sell(from Hold) | $5.00 |
NICNickel Industries | Bell Potter | Retained | Buy | $1.45 |
| Morgan Stanley | Retained | Equal Weight | $0.80 | |
NUFNufarm | Citi | Retained | Neutral | $3.40(from $2.95) |
NWLNetwealth Group | UBS | Retained | Neutral | $24.00 |
PDNPaladin Energy | Morgan Stanley | Retained | Overweight | $12.05 |
QBEQBE Insurance Group | UBS | Retained | Neutral | $25.70 |
REAREA Group | Macquarie | Retained | Neutral | $170.00 |
RIORio Tinto | Morgan Stanley | Retained | Underweight | $150.00 |
RSGResolute Mining | Canaccord Genuity | Retained | Buy | $2.20(from $2.25) |
SFRSandfire Resources | Morgan Stanley | Retained | Equal Weight | $20.00 |
SGHSGH | Morgans | Retained | Buy | $48.00(from $50.00) |
SIGSigma Healthcare | Morgan Stanley | Retained | Overweight | $3.30 |
| UBS | Retained | Buy | $3.15 | |
TLXTelix Pharmaceuticals | Bell Potter | Retained | Buy | $19.00 |
TWETreasury Wine Estates | Morgan Stanley | Retained | Equal Weight | $5.30 |
UNIUniversal Store Holdings | UBS | Retained | Buy | $9.25 |
WBCWestpac Banking Corporation | Morgan Stanley | Retained | Underweight | $30.00 |
WESWesfarmers | UBS | Retained | Neutral | $82.00 |
WHCWhitehaven Coal | Morgan Stanley | Retained | Overweight | $8.45 |
XROXero | Morgan Stanley | Retained | Overweight | $130.00 |
Scans
Top Gainers
Code | Company | Last | % Chg |
|---|---|---|---|
| MX1 | Micro-X Ltd | $0.025 | +38.89% |
| ETM | Energy Transition Minerals Ltd | $0.06 | +33.33% |
| CZN | Corazon Mining Ltd | $0.12 | +26.32% |
| IVG | Invert Graphite Ltd | $0.045 | +25.00% |
| OM1 | Omnia Metals Group Ltd | $0.016 | +23.08% |
Top Fallers
Code | Company | Last | % Chg |
|---|---|---|---|
| KFM | Kingfisher Mining Ltd | $0.064 | -16.88% |
| NXD | Nexted Group Ltd | $0.052 | -16.13% |
| PPT | Perpetual Ltd | $16.64 | -15.10% |
| NYR | Nyrada Inc | $0.62 | -15.07% |
| WC8 | Wildcat Resources Ltd | $0.29 | -14.71% |
52 Week Highs
Code | Company | Last | % Chg |
|---|---|---|---|
| WCN | White Cliff Minerals Ltd | $0.028 | +21.74% |
| BTE | Botala Energy Ltd | $0.076 | +7.04% |
| AMD | Arrow Minerals Ltd | $0.023 | +4.55% |
| PYC | PYC Therapeutics Ltd | $2.79 | +4.49% |
| BNZ | BENZ Mining Corp | $4.91 | +4.47% |
52 Week Lows
Code | Company | Last | % Chg |
|---|---|---|---|
| NXD | Nexted Group Ltd | $0.052 | -16.13% |
| AGR | Aguia Resources Ltd | $0.012 | -14.29% |
| FLX | FELIX Group Holdings Ltd | $0.034 | -12.82% |
| SBZ | Schoolblazer Ltd | $0.145 | -12.12% |
| BIM | Bindi Metals Ltd | $0.08 | -11.11% |
Near Highs
Code | Company | Last | % Chg |
|---|---|---|---|
| SMLL | Betashares Australian Small Companies Select ETF | $4.55 | +0.22% |
| RHC | Ramsay Health Care Ltd | $55.61 | +0.40% |
| AN3PI | Australia and New Zealand Banking Group Ltd | $102.15 | +0.29% |
| PCI | Perpetual Credit Income Trust | $1.11 | +0.91% |
| WVOL | iShares MSCI World Ex Aust Minimum Volatility ETF | $45.51 | +0.07% |
Relative Strength Index (RSI) Oversold
Code | Company | Last | % Chg |
|---|---|---|---|
| PWR | Peter Warren Automotive Holdings Ltd | $0.725 | -3.33% |
| EDV | Endeavour Group Ltd | $2.89 | -0.35% |
| VAP | Vanguard Australian Property Securities INDEX ETF | $81.84 | -0.34% |
| MRE | Metrics Real Estate Multi-Strategy Fund | $1.64 | -1.50% |
| CTD | Corporate Travel Management Ltd | $2.57 | -3.38% |
